GOLD for todayHello to all traders. 😎😎
I hope all your deals will hit their targets. 🎉🎉
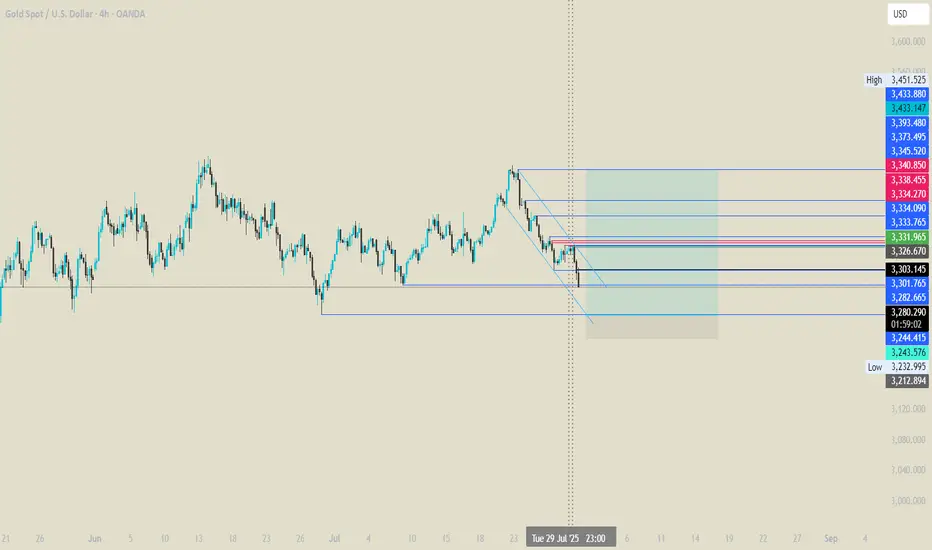
Based on yesterday’s analysis (link in the caption), we can expect gold to make a small upward move towards the 3335–3345 zone to collect sell orders in that area, and then potentially drop with more strength.
As you can see on the chart, the previous bearish move was strong, while the recent bullish move from yesterday until now has been slow and weak.
🌟🌟 The main reason for expecting this drop is the break of a key trendline on the 4H timeframe.
I’ve marked the entry point and stop-loss in red, and the targets in blue on the chart.
📌 Don’t forget to apply proper risk management!
⚠ Important: If a 1H candle closes above 3350 without giving us a valid entry beforehand, this analysis will be considered invalid.
What Do You Think?
Which scenario do you think is more likely to happen? **Share your thoughts!** ⬇️
Don't forget that this is just an analysis to give you an idea and trade with your own strategy. And don't forget the stop loss🛑🛑🛑
❤️❤️❤️The only friend you have in financial markets is your stop loss❤️❤️❤️
Please support me with your ✅' like'✅ and comments to motivate me to share more analysis with you and share your opinion about the possible trend of this chart with me 🙏😊
Be Happy , Ali Jamali
Futures market

GOLD for short timeCaption important🛑🛑🛑
Hello to all traders. 😎😎
I hope all your deals will hit their targets. 🎉🎉
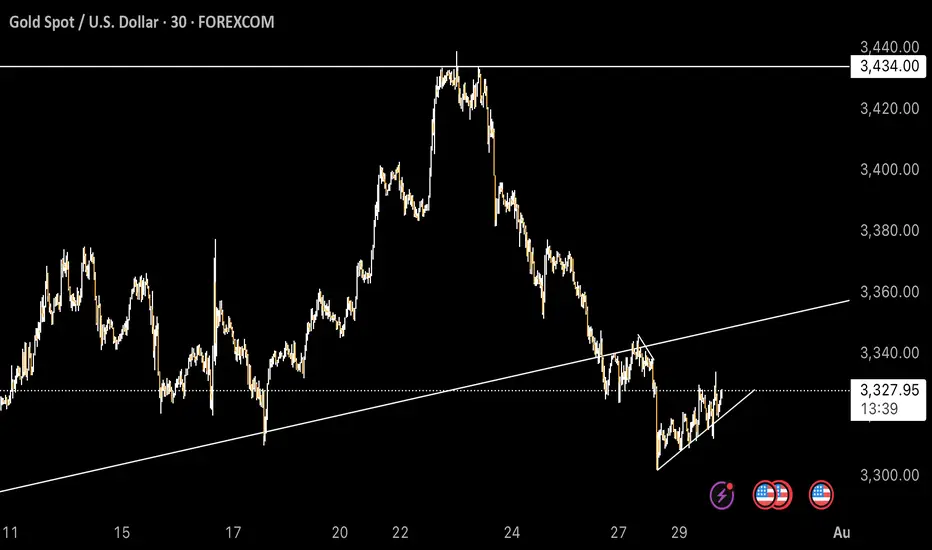
Gold has broken a key trendline on the 4H chart, and I believe the bearish move could continue today, potentially down to at least $3300.
My expectation is that price will first reach the $3335–$3340 zone. From there, you can look for a good short opportunity, with a suggested stop-loss at $3355.
If you’re willing to take on more risk, you could consider opening a short position from the current level around $3325, using a reasonable position size.
Personally, I prefer to wait for price to reach the orange zone ($3335) and enter a solid short position from there.
What Do You Think?
Which scenario do you think is more likely to happen? **Share your thoughts!** ⬇️
Don't forget that this is just an analysis to give you an idea and trade with your own strategy. And don't forget the stop loss🛑🛑🛑
❤️❤️❤️The only friend you have in financial markets is your stop loss❤️❤️❤️
Please support me with your ✅' like'✅ and comments to motivate me to share more analysis with you and share your opinion about the possible trend of this chart with me 🙏😊
Be Happy , Ali Jamali

XAU / USD Weekly ChartHello traders. News was good for the US dollar this morning. Powell did nothing, as expected, and gold is testing the lower boundries of the weekly candle body from last week. So now the question is, do we push down more, or does gold move up to take out all the leveraged shorts that are in profit? I marked the area to watch. Buys and sells with break and close out of the zone. Let's see how the daily and 4 hour candles play out. Shout out to Big G. Be well and trade the trend.

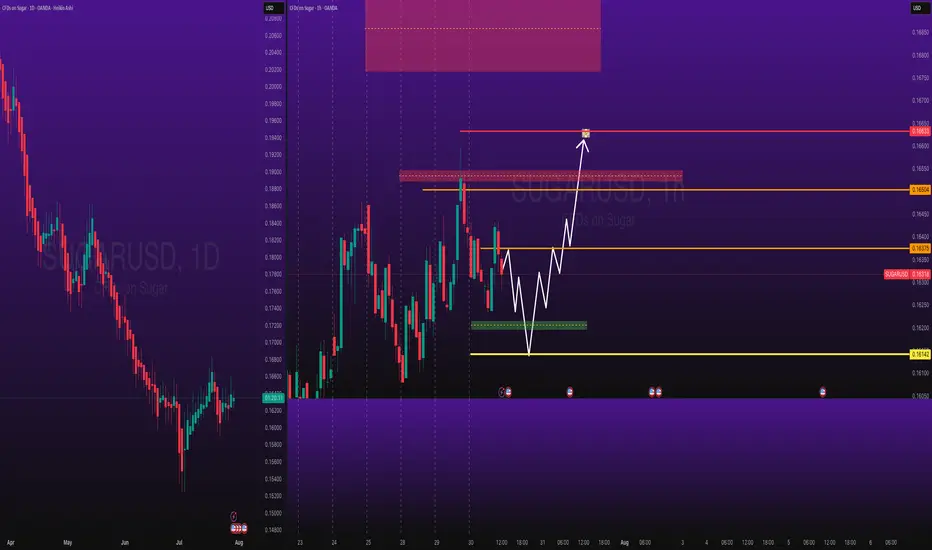
Sugar Long Trade PEPPERSTONE:SUGAR Long Trade, with my back testing of this strategy, it hits multiple possible take profits, manage your position accordingly.
Note: Manage your risk yourself, its risky trade, see how much your can risk yourself on this trade.
Use proper risk management
Looks like good trade.
Lets monitor.
Use proper risk management.
Disclaimer: only idea, not advice
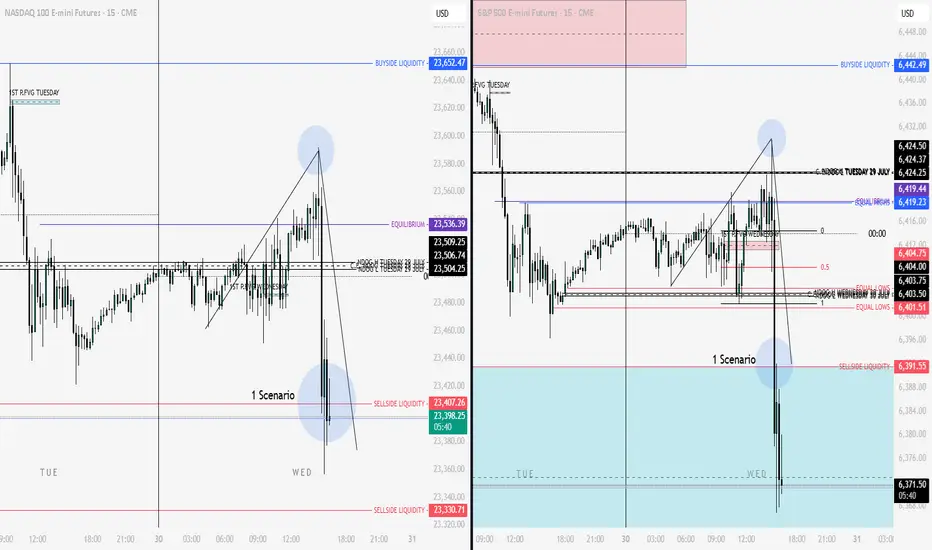
Nq & Es Key levels 30-07 Looking at my previous post regarding flat keys, I am horrified by the accuracy of the reversal and the evolution of price action today...
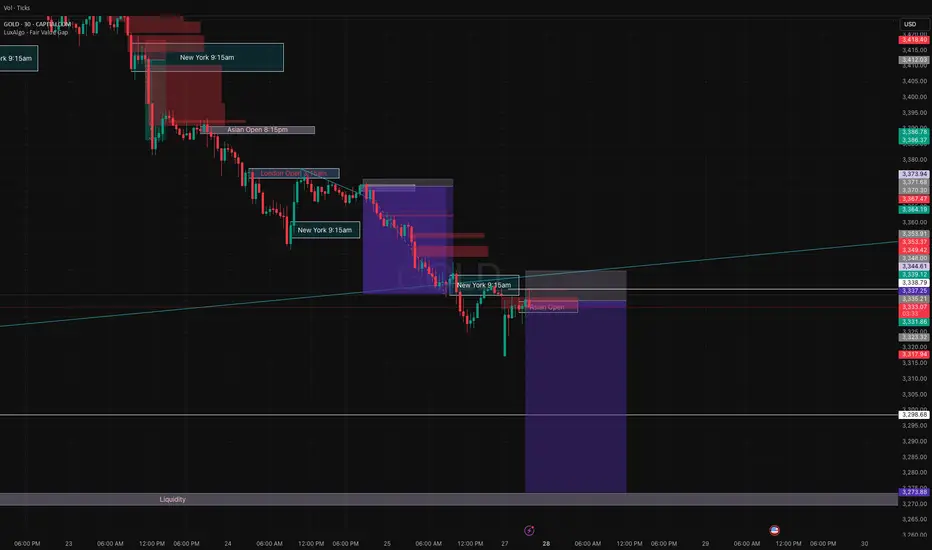
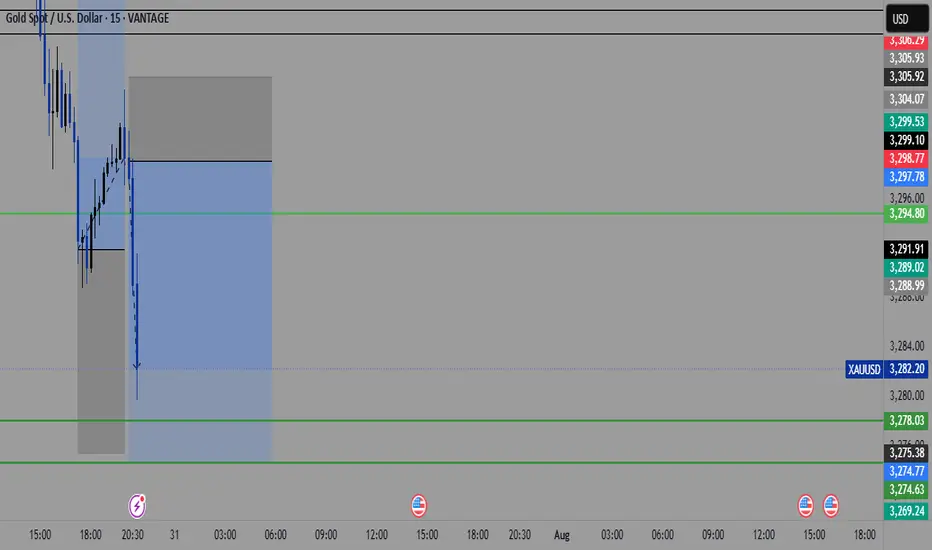
Gold Slipping Lower — 3250 and 3200 in Sight!✅ Gold & DXY Update – Post-FOMC Price Action
Earlier today, before the U.S. interest rate decision, I released my outlook on both the Dollar Index and gold.
In that analysis, I highlighted the DXY’s readiness to move toward the key level of 100 — and as of now, price is actively testing that exact zone, just as expected.
As for gold, I repeatedly emphasized the visible weakness on the buy side. It was clear that there were very few remaining buy orders strong enough to hold price up in this region — and that’s exactly what played out. Price has started pushing lower, in line with our expectations.
Looking ahead, I believe the first target is 3250, followed by a deeper move toward the liquidity zone and the marked box around 3200, which could act as a key target area in the coming days.
🔁 This analysis will be updated whenever necessary.
Disclaimer: This is not financial advice. Just my personal opinion.

Gold Outlook- My BiasAlways know I do not own the market, I only predict what i think ,May happen and I may be wrong, but I have followed my set of rules.
Be cautious with the numerous news and short sell on rebound#XAUUSD
The market is fluctuating sideways, and whether it can achieve a V-shaped reversal still needs to wait for information such as ADP and the Federal Reserve's decision.🗞 Invest lightly today and avoid letting emotions dictate your thinking.⚖️
⚠️Although the market currently predicts that the news information is bullish for gold, and most of the trading voices are centered around bulls, we still need to be wary of the resistance area above 3345-3350.
📉Judging from the daily chart, I have clearly stated in the figure before that the current trend is a converging triangle. If the price hits the triangle boundary, coupled with the interference of external news, it may trigger panic selling, killing a wave of long buyers first🐂, and then trigger an upward trend when it retreats to near the 3300 support level, and may even test the support level of 3285. 🩳
The 4H chart shows that although the rebound momentum is still continuing📈, the gold price is still below the short-term moving average and has only recovered the lower support level. It is necessary to wait for a second retracement confirmation to determine whether a true trend reversal has been achieved. 📈
In addition, the price on the hourly chart continues to run in a downward channel. Combined with the previous trend pattern, after the rebound correction at the 4H level is completed, it is highly likely that the downward trend will continue to return to the lower support level of the daily level.🐻
If resistance is encountered at 3345-3350 for the first time today, consider shorting.💡
If the price currently retreats to around 3320-3315, consider a short-term long position. Long positions held yesterday can be manually closed at around 3330.💡
🚀 SELL 3340-3350
🚀 TP 3330-3320-3300
🚀 BUY 3320-3315
🚀 TP 3330-3340

GOLD: Multi-Timeframe Analysis Ahead of FOMCGOLD: Multi-Timeframe Analysis Ahead of FOMC
Gold prices may experience a short-term surge leading up to the FOMC announcement.
But what comes next?
Let’s break down the analysis, step by step.
For deeper insights, watch the full breakdown in the video.
Thank you!


Bearish Gold Outlook — Potential Flash Crash Imminent🔻 Technical Structure – Bearish Breakdown Brewing
Lower highs and lower lows forming on the daily and 4H timeframes — classic downtrend mechanics.
Price has rejected multiple times near $3,400–3,430, forming a strong resistance ceiling.
Support at $3,280–3,300 has been tested too many times— and each bounce is weaker. When support holds with less conviction, it's often about to break.
Volume spikes on red candles show smart money is exiting on down moves — signs of institutional distribution.
The **tightening consolidation range** looks like a **descending triangle** — usually resolves downward.
If $3,280 breaks, expect a **liquidity event**. Stops get swept, leading to a **sudden acceleration — possibly a flash crash** to $3,200 or lower.
🌍 **Fundamental Drivers – Macro Picture Is Turning Hostile for Gold**
1. Real Yields Are Climbing
U.S. real yields are up as inflation fades and the Fed stays hawkish.
Gold, being yieldless, suffers when investors can get positive returns from bonds.
2.The Dollar Is Gaining Strength
DXY is pushing higher, fueled by strong U.S. data and weak peers (euro, yen).
Gold priced in USD becomes more expensive globally — this suppresses demand.
3. **Rate Cuts Are Off the Table — or Delayed**
Market is pricing fewer and later rate cuts from the Fed.
This removes one of gold’s biggest bullish catalysts from earlier in the year.
4. Geopolitical Fear Is Cooling
No major escalation in Ukraine, Middle East, or Taiwan.
Without fear, gold loses its safe-haven premium.
5. Central Bank Buying May Have Peaked
Recent data from WGC shows some slowing in central bank accumulation.
If this institutional bid softens, gold could drop hard — few natural buyers remain above $3,300.
⚠️Conclusion: Gold Is Walking a Tightrope
The chart is a staircase down.
Macro fundamentals are no longer supportive.
A clean breakdown below $3,280 could trigger a **chain reaction** of automated selling and margin calls — **a flash crash is on the table**.
This isn’t just a correction — this feels like the calm before the storm.

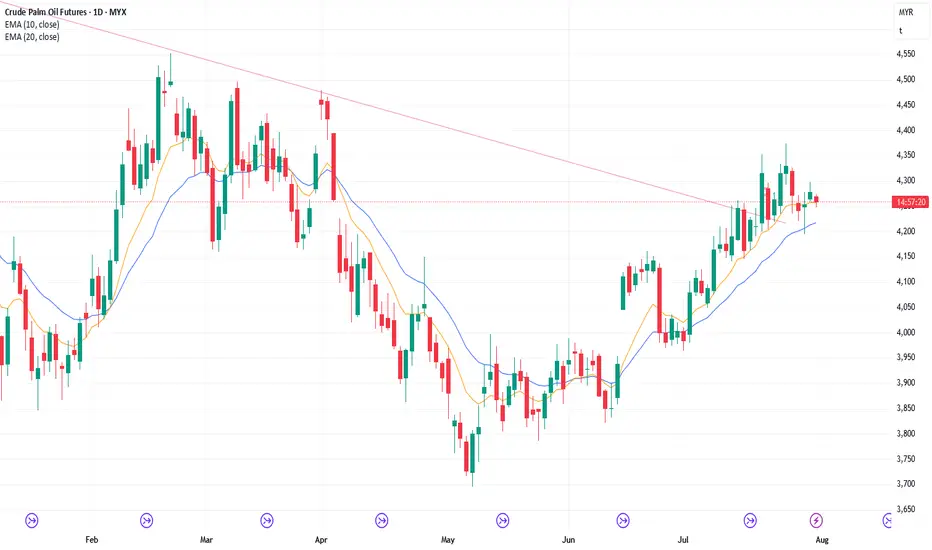
31/7/25 Still Sideways to Down Pullback Phase
Wednesday’s candlestick (Jul 30) was a small bull bar with a prominent tail above.
In our last report, we said traders would see if the bulls could create a retest of the July 24 high and a breakout above, or if the market would trade slightly higher but stall around or below the July 24 high, forming bear bars instead.
The market traded slightly higher for the day.
The bulls want a retest of the April high.
They want any pullback to lack follow-through selling, similar to the last few pullbacks (July 7, July 11, July 15, and July 22).
They want the pullback to be shallow (overlapping candlesticks, bull bars and long tails below candlesticks). They want the 20-day EMA to act as a support level. So far, this appears to be the case.
If the market trades lower, they want it to form a double bottom bull flag with the July 29 low.
They want another strong leg up to form the wedge pattern, with the first two legs being Jun 20 and July 24.
The bears want a reversal from a large wedge pattern (May 15, Jun 20, and Jul 24) and an embedded wedge (Jul 14, Jul 18, and Jul 24). They want a major lower high vs the April high.
Previously, the bears were unable to create follow-through selling in the last four selloff attempts (July 7, July 11, July 15, and July 22). They were also unable to create follow-through selling on July 29.
They see Tuesday (July 30) as a pullback and want at least a small second leg sideways to down, retesting the July 29 low.
They need to create consecutive bear bars closing near their lows and trading below the 20-day EMA to show they are back in control.
If the market trades higher, they want it to stall around the July 24 high area, forming a double top.
Production for July is expected to be around the same level as June or slightly higher. August may be flat or down.
Refineries' appetite to buy looks decent recently.
Export: Perhaps down -8% for the month.
So far, the buying pressure is slightly stronger than the selling pressure, but not in an overwhelming way yet (no strong consecutive bull bars closing near their highs).
However, the move up has lasted a considerable amount of time. The market may have to form a pullback before it moves higher again. The pullback phase is still underway.
Traders will assess the strength of the pullback to determine whether it will be a minor correction or a more significant event. So far, the pullback appears to be minor.
The bears need to create follow-through selling to show they are back in control, something they couldn't do in the last few pullbacks (July 7, July 11, July 15, Jul 22, and Jul 29).
For tomorrow (Thursday, July 31), traders will see if the bears can create a strong retest of the July 29 low.
Or will the market trade slightly lower, but find support around the 20-day EMA, closing the day with a long tail below or a bull body instead?
Andrew
Gold long from 3242LOOKING FOR LONGS AT AROUND THAT REGION.
gold looks good .
Lets wait for this to unfold.
Gold next move (Read Description). Hello, Traders.
As we achieved more than 400 pips on last trade, Now I’m back with new idea for next move.
As you can see the gold is dropping since last few days.
Now the trend is bearish according Higher Time Frames and Bullish trend in Lower Time Frames, We will have to follow the Higher Time Frames to find the next move.
The market is creating the trend line buy according to H1,M30 and also respecting the trend line.
Keep in mind the trend is bearish, the gold will drop.
If the price doesn't breaks the 3347, then next move will be around 3284. If the price breaks the 3347 then gold will fly, trend will be change.
Kindly share your ideas and drop positive comments, Thanks.
GC1! – The Wedge Strikes BackGC1! – The Wedge Strikes Back 🚀
Gold futures (GC1!) just gave us a textbook rollover move. As the front-month rolled, price faked a wedge breakdown, only to rip back inside the structure once rollover completed. That failed breakout speaks volumes – and now the wedge is back in control.
Rollover Trap → Back Inside the Wedge
Rollover volatility flushed price below the wedge, pulling in shorts… but the move didn’t stick. Buyers stepped up and snapped price back inside, turning the wedge’s lower boundary into rock-solid support once again.
The Long Game 🎯
With GC1! holding the wedge:
Longs off wedge support are the play
Resistance: 3,380
Target: 3,446 (upper wedge boundary)
Stop-loss: 3,336 (below support)
Risk/Reward: 🔥 10.69 RRR
Volume Profile also shows heavy accumulation in the 3,336–3,380 zone – crack through 3,380, and we could see momentum accelerate quickly.
Bottom Line
This isn’t just another bounce – it’s a failed breakdown on rollover. Wedge traders are back in the driver’s seat, and the setup offers a crystal-clear invalidation point with serious upside potential.

Interest rates unchanged, sticking to my bearish idea.Look at my other posts and you''ll understand as to why, I was telling everyone to sell. There was a small sellers trap, we pushed up, at that moment I already had closed my positions. Now we go down to the other key levels. I'm done till the end of August. Will still post my setups, but won't take any trades. Stay safe and keep your funds safe. Hella Love!
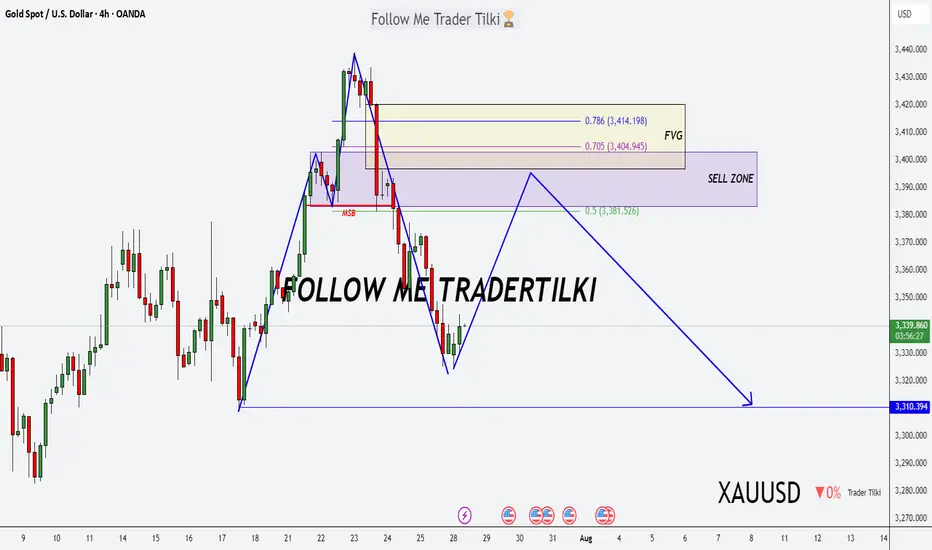
Gold Alert: Key Levels for Potential Sell Setup!Good morning, my friends 🌞
Here’s today’s gold analysis. I'm expecting a decline in gold prices, specifically from the 3,383–3,420 level.
Once a correction starts around that zone, my target will be 3,310. Gold has been riding a strong uptrend, and if we reach those levels, I’ll be expecting a pullback and opening a sell position accordingly.
Please set your stop loss based on your personal margin preferences.
Your likes and support are my biggest motivation for continuing to share these analyses. Thank you to everyone showing appreciation 🙏
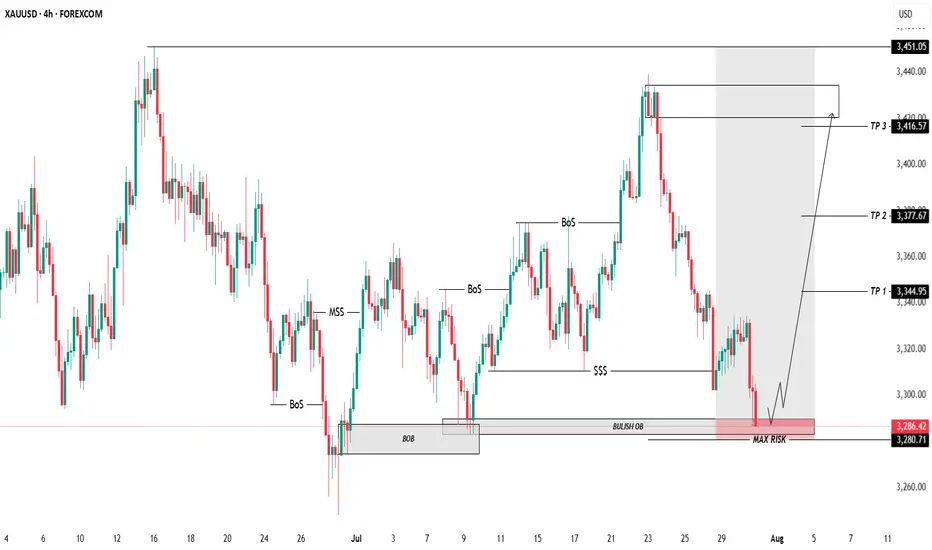
BUY XAUUSD ....GOLDBUY XAUUSD price gas reached a potential strong bullish orderblock and a well structured demand zone
use proper risk management
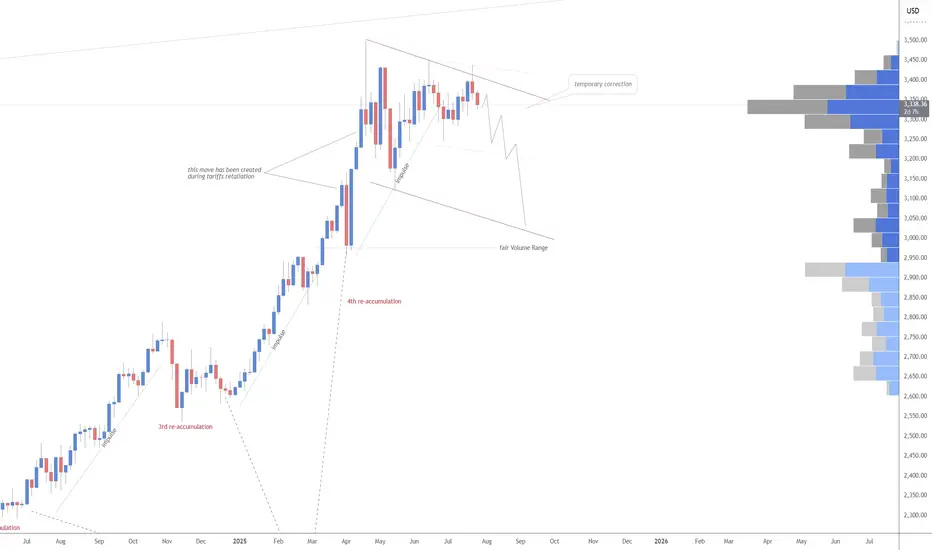
SILVER H9 IdeaWhen you look at silver market has actually been in an uptrend for about three years. It was sideways a couple of times, and it’s very possible that we go sideways or correctionn for the short term. But over the longer term, it goes from the lower left to the upper right, and there’s really no way to dispute that.

GOLD Weekly Idea💡Why Gold Pulled Back
- Gold pulled back today after hitting $3439.04, just below resistance at $3451.53. Traders took profits ahead of key Fed and trade headlines. Right now, it’s trading around $3414.48, down 0.50%.
- The dip came after the U.S.-Japan trade deal eased geopolitical tension, cutting safe-haven demand. Plus, U.S. bond yields are climbing (10-year at 4.384%), which adds pressure on gold.
Support is building at $3374.42, with stronger buying interest expected around $3347.97 and the 50-day moving average at $3336.40 — a key level bulls want to defend.
Short-term looks a bit weak, but as long as gold holds above the 50-day MA, the bullish trend remains intact. Longer-term, weakness in the dollar, central bank gold buying, and concerns about Fed independence could push prices higher.
🔍Watching the Fed’s July 29–30 meeting next
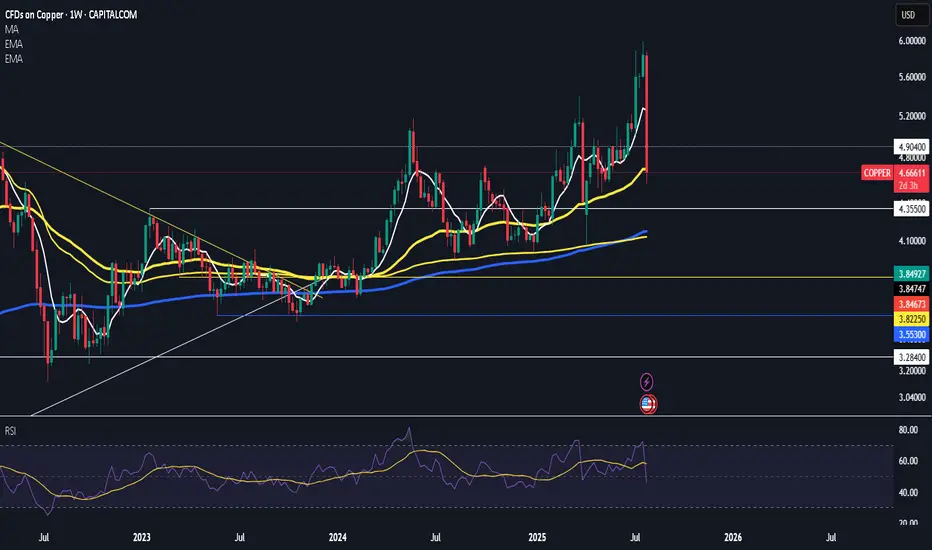
$copperlovely gift by trump i guess
50 ema holding for now
bid here and will look for a deviation below white line
Double bottom Double bottom on gold with RSI regular divergency on 5 , 15 and 1 hour chart. It seems like buyers are interested again on this level.

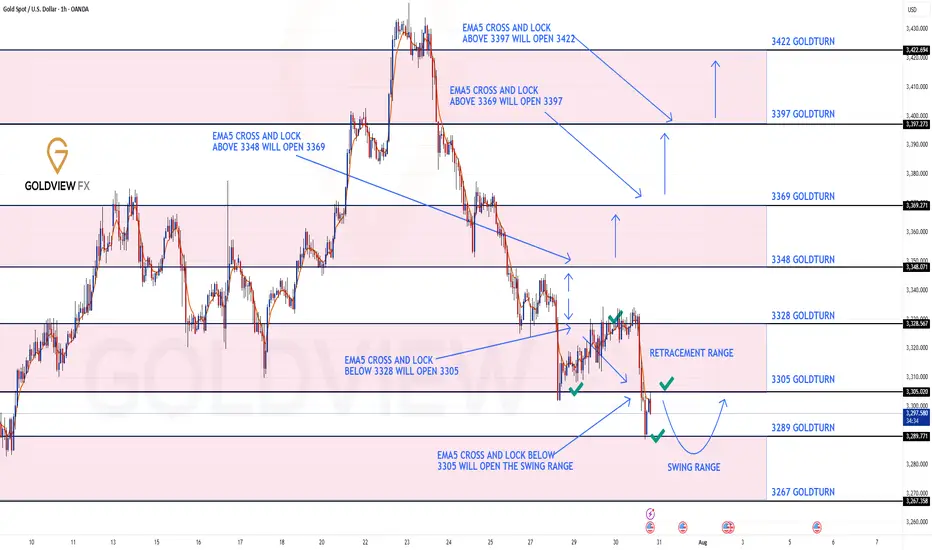
GOLD ROUTE MAP UPDATEHey Everyone,
Quick follow up on our 1H chart route map:
We had the break below 3305 Goldturn, opening and hitting the 1st level of the swing range at 3289, which did exactly what it says on the tin and gave us the perfect swing bounce into 3305.
We are now looking for support above the swing range and a break above 3305 to track the movement up or further retest and break below the 1st level of the swing range may open the the 2nd level at 3267. Ema5 cross and lock will confirm this.
From here, we’re watching for:
Support to hold above the swing range, followed by a clean break above 3305, which would suggest upward continuation.
Alternatively, if we retest and break below 3289, that opens the path toward the second level of the swing range at 3267.
We will keep the above in mind when taking buys from dips. Our updated levels and weighted levels will allow us to track the movement down and then catch bounces up.
We will continue to buy dips using our support levels taking 20 to 40 pips. As stated before each of our level structures give 20 to 40 pip bounces, which is enough for a nice entry and exit. If you back test the levels we shared every week for the past 24 months, you can see how effectively they were used to trade with or against short/mid term swings and trends.
The swing range give bigger bounces then our weighted levels that's the difference between weighted levels and swing ranges.
BULLISH TARGET
3348
EMA5 CROSS AND LOCK ABOVE 3348 WILL OPEN THE FOLLOWING BULLISH TARGETS
3369
EMA5 CROSS AND LOCK ABOVE 3369 WILL OPEN THE FOLLOWING BULLISH TARGET
3397
EMA5 CROSS AND LOCK ABOVE 3397 WILL OPEN THE FOLLOWING BULLISH TARGET
3422
BEARISH TARGETS
3328 - DONE
EMA5 CROSS AND LOCK BELOW 3328 WILL OPEN THE FOLLOWING BEARISH TARGET
3305 - DONE
EMA5 CROSS AND LOCK BELOW 3305 WILL OPEN THE SWING RANGE
3289 - DONE
3267
As always, we will keep you all updated with regular updates throughout the week and how we manage the active ideas and setups. Thank you all for your likes, comments and follows, we really appreciate it!
Mr Gold
GoldViewFX