Interest rates unchanged, sticking to my bearish idea.Look at my other posts and you''ll understand as to why, I was telling everyone to sell. There was a small sellers trap, we pushed up, at that moment I already had closed my positions. Now we go down to the other key levels. I'm done till the end of August. Will still post my setups, but won't take any trades. Stay safe and keep your funds safe. Hella Love!
Futures market
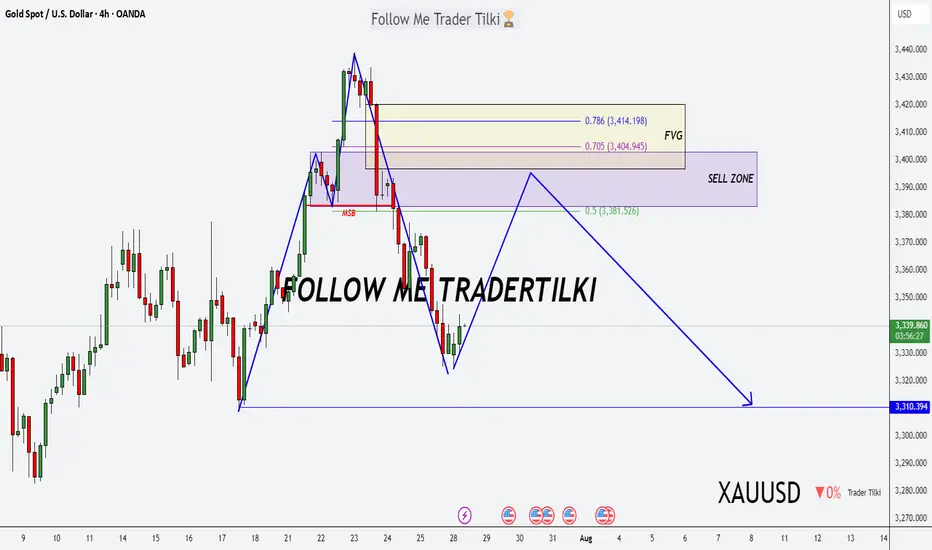
Gold Alert: Key Levels for Potential Sell Setup!Good morning, my friends 🌞
Here’s today’s gold analysis. I'm expecting a decline in gold prices, specifically from the 3,383–3,420 level.
Once a correction starts around that zone, my target will be 3,310. Gold has been riding a strong uptrend, and if we reach those levels, I’ll be expecting a pullback and opening a sell position accordingly.
Please set your stop loss based on your personal margin preferences.
Your likes and support are my biggest motivation for continuing to share these analyses. Thank you to everyone showing appreciation 🙏
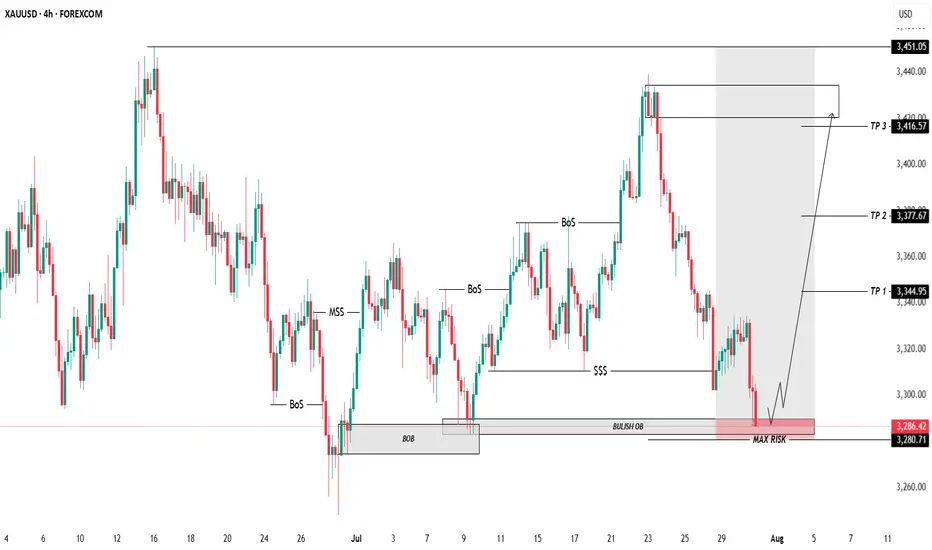
BUY XAUUSD ....GOLDBUY XAUUSD price gas reached a potential strong bullish orderblock and a well structured demand zone
use proper risk management
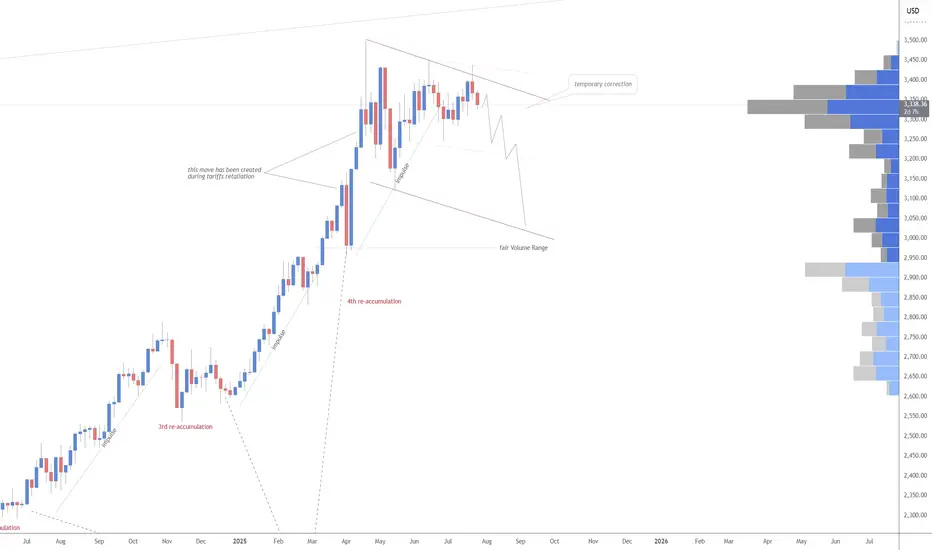
SILVER H9 IdeaWhen you look at silver market has actually been in an uptrend for about three years. It was sideways a couple of times, and it’s very possible that we go sideways or correctionn for the short term. But over the longer term, it goes from the lower left to the upper right, and there’s really no way to dispute that.

GOLD Weekly Idea💡Why Gold Pulled Back
- Gold pulled back today after hitting $3439.04, just below resistance at $3451.53. Traders took profits ahead of key Fed and trade headlines. Right now, it’s trading around $3414.48, down 0.50%.
- The dip came after the U.S.-Japan trade deal eased geopolitical tension, cutting safe-haven demand. Plus, U.S. bond yields are climbing (10-year at 4.384%), which adds pressure on gold.
Support is building at $3374.42, with stronger buying interest expected around $3347.97 and the 50-day moving average at $3336.40 — a key level bulls want to defend.
Short-term looks a bit weak, but as long as gold holds above the 50-day MA, the bullish trend remains intact. Longer-term, weakness in the dollar, central bank gold buying, and concerns about Fed independence could push prices higher.
🔍Watching the Fed’s July 29–30 meeting next
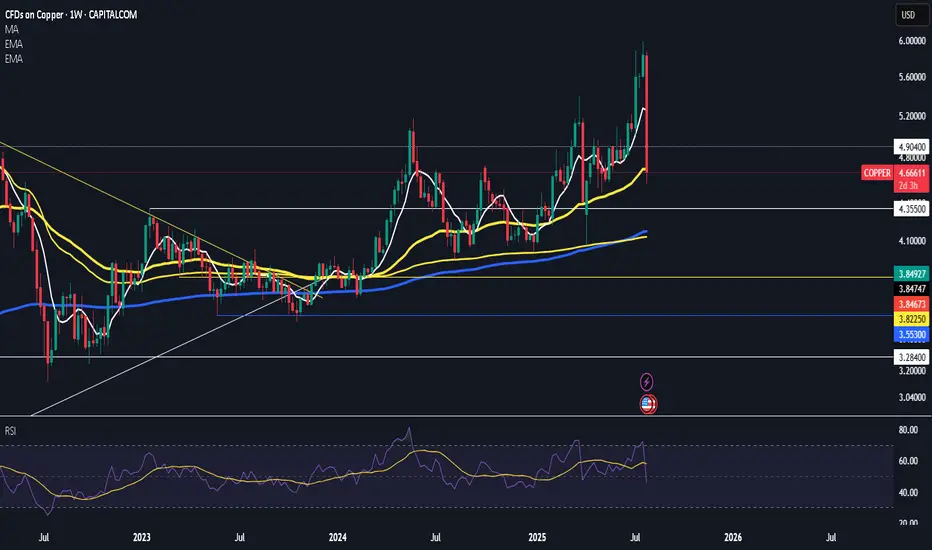
$copperlovely gift by trump i guess
50 ema holding for now
bid here and will look for a deviation below white line
Double bottom Double bottom on gold with RSI regular divergency on 5 , 15 and 1 hour chart. It seems like buyers are interested again on this level.

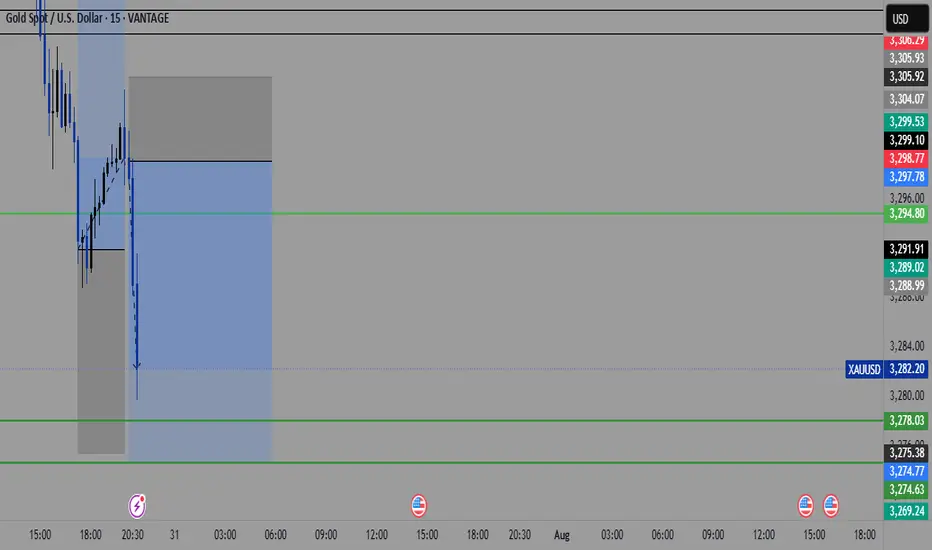
GOLD ROUTE MAP UPDATEHey Everyone,
Quick follow up on our 1H chart route map:
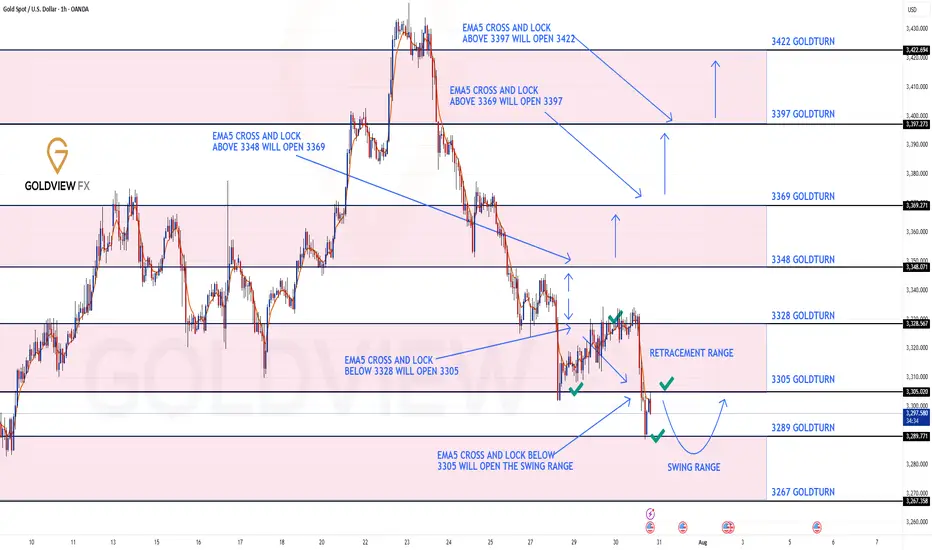
We had the break below 3305 Goldturn, opening and hitting the 1st level of the swing range at 3289, which did exactly what it says on the tin and gave us the perfect swing bounce into 3305.
We are now looking for support above the swing range and a break above 3305 to track the movement up or further retest and break below the 1st level of the swing range may open the the 2nd level at 3267. Ema5 cross and lock will confirm this.
From here, we’re watching for:
Support to hold above the swing range, followed by a clean break above 3305, which would suggest upward continuation.
Alternatively, if we retest and break below 3289, that opens the path toward the second level of the swing range at 3267.
We will keep the above in mind when taking buys from dips. Our updated levels and weighted levels will allow us to track the movement down and then catch bounces up.
We will continue to buy dips using our support levels taking 20 to 40 pips. As stated before each of our level structures give 20 to 40 pip bounces, which is enough for a nice entry and exit. If you back test the levels we shared every week for the past 24 months, you can see how effectively they were used to trade with or against short/mid term swings and trends.
The swing range give bigger bounces then our weighted levels that's the difference between weighted levels and swing ranges.
BULLISH TARGET
3348
EMA5 CROSS AND LOCK ABOVE 3348 WILL OPEN THE FOLLOWING BULLISH TARGETS
3369
EMA5 CROSS AND LOCK ABOVE 3369 WILL OPEN THE FOLLOWING BULLISH TARGET
3397
EMA5 CROSS AND LOCK ABOVE 3397 WILL OPEN THE FOLLOWING BULLISH TARGET
3422
BEARISH TARGETS
3328 - DONE
EMA5 CROSS AND LOCK BELOW 3328 WILL OPEN THE FOLLOWING BEARISH TARGET
3305 - DONE
EMA5 CROSS AND LOCK BELOW 3305 WILL OPEN THE SWING RANGE
3289 - DONE
3267
As always, we will keep you all updated with regular updates throughout the week and how we manage the active ideas and setups. Thank you all for your likes, comments and follows, we really appreciate it!
Mr Gold
GoldViewFX
THE KOG REPORT - FOMCTHE KOG REPORT – FOMC
This is our view for FOMC, please do your own research and analysis to make an informed decision on the markets. It is not recommended you try to trade the event if you have less than 6 months trading experience and have a trusted risk strategy in place. The markets are extremely volatile, and these events can cause aggressive swings in price.
It’s been an aggressive month on the markets especially this week which has been testing for traders due to the extended movement on gold. We’ve managed to stay ahead of the game and although we missed the move downside, we’ve capture scalps up and down trading it on an intra-day basis rather than a swing.
Looking at the 4H chart, we can see we have support forming at the 3310 level which is the key level for this week and will need to be broken to go lower. If we can flip the 3334 resistance, price should attempt higher into the 3355-60 region which is where we may settle in preparation for NFP. on Friday This is the level that needs to be watched for the daily close, as a close above will confirm the structure and pattern test which can form a reversal if not breached.
Now, here is the flip! We’re still sitting below the daily red box but we know this break does give a retracement and with sentiment long, it may not be a complete retracement again. Here 3345-50 is the red box to watch and as above, if not breached, we may see a rejection here which will confirm no reversal for higher and, potentially a further decline into the 3270-5 regions for the end of the month and quarter.
Pivot – 3323-6
RED BOX TARGETS:
Break above 3335 for 3338, 3340, 3345, 3347 and 3357 in extension of the move
Break below 3320 for 3310, 3306, 3302, 3297 and 3393 in extension of the move
Please do support us by hitting the like button, leaving a comment, and giving us a follow. We’ve been doing this for a long time now providing traders with in-depth free analysis on Gold, so your likes and comments are very much appreciated.
As always, trade safe.
KOG

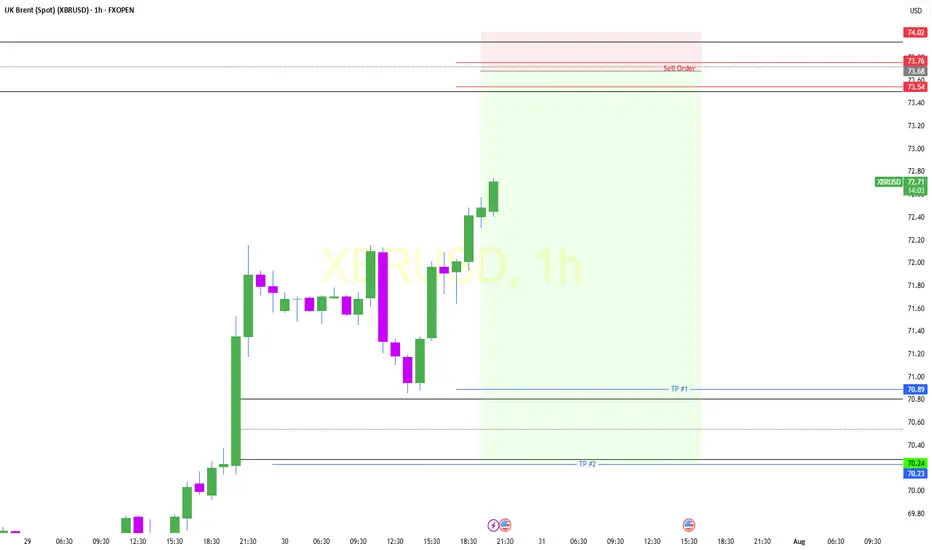
UKOIL Short UKOIL prices may decline from the $73.7 level within the Fair Value Gap (FVG) zone, targeting a lower FVG zone as the next potential objective.
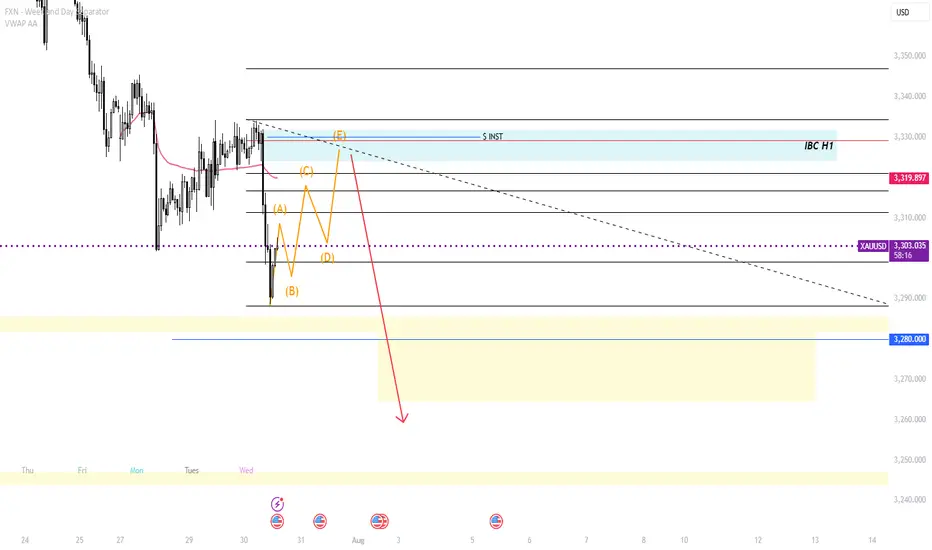
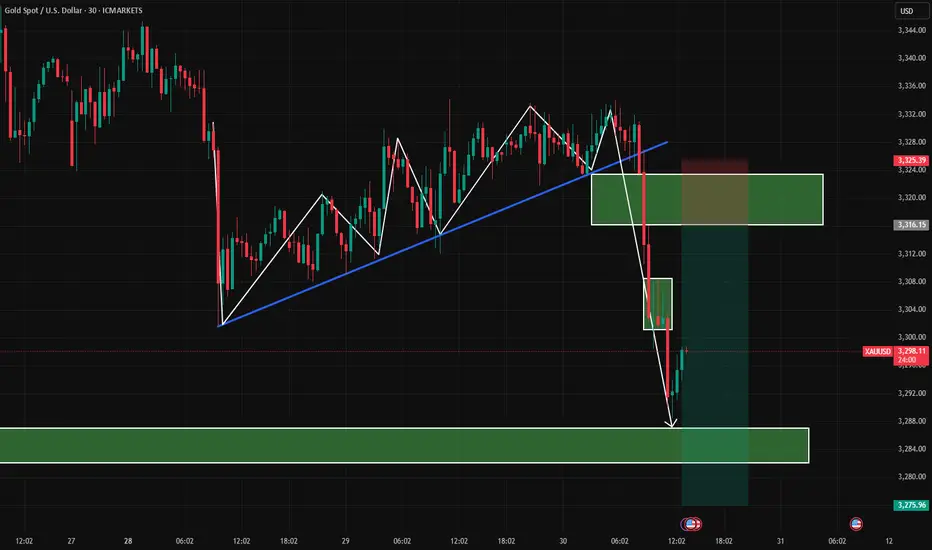
Gold Price Rebound Towards 3325 Target After Support TestGold (30-min chart) shows a recovery from the support zone (3288–3298) with potential bullish movement. Key resistance levels are 3305 and 3316, with a target zone around 3325.510. Price is expected to follow a corrective structure before possibly reaching the target.

GOLD PLAN – LIQUIDITY HUNT BEFORE THE REAL MOVE? SCALPING PLAN – LIQUIDITY HUNT BEFORE THE REAL MOVE? 🔍
🔹 Timeframe: 30M
🔹 Bias: Intraday Bullish to Bearish Reversal
🔹 Posted by: Clinton Scalper | Smart Money Focus
🔹 Date: July 30, 2025
🔍 MACRO CONTEXT – WHY GOLD REMAINS HIGHLY REACTIVE
The macro backdrop continues to favor volatility in gold:
🟢 Dovish Fed tone ahead of FOMC
– Fed speakers hint at a pause or rate cut timeline.
– Inflation pressures are easing → lowers interest rate expectations.
📉 USD weakening + falling yields
– 10Y U.S. bonds retreating → dollar under pressure → gold gains ground.
🌐 Geopolitical risks remain elevated
– Tensions from Middle East and global recession risks continue to drive flows into safe-haven assets like gold.
🧭 Conclusion: Short-term upside still viable – but be cautious of liquidity traps and OB rejection.
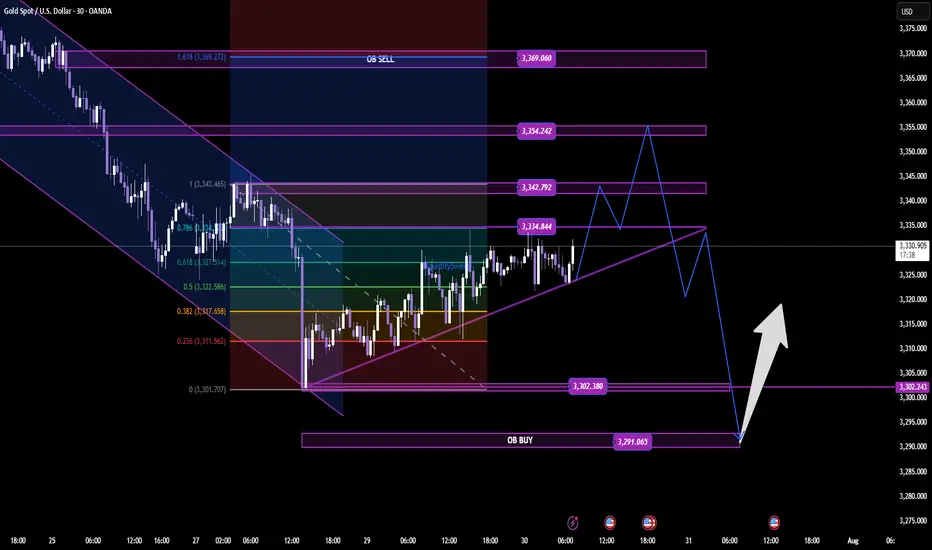
📈 TECHNICAL + SMC INSIGHTS – THE CHART TELLS THE STORY
🔹 Structure Overview:
Market broke out of a descending channel and formed a bullish ascending wedge.
However, price is now approaching multiple OB SELL zones, aligning with smart money exhaustion levels.
🔹 Key Zones:
🔺 OB SELL Zones:
3,334 → 3,342
3,354 → 3,369 (Fibonacci 1.618 extension)
🔻 OB BUY Zones:
3,302 → 3,291 (confluence with previous liquidity sweep)
📍 Current Price: 3,330 – approaching first supply zone.
🔹 Smart Money Flow:
Liquidity above 3,334 has likely been targeted.
If price reaches 3,354–3,369 and shows exhaustion, expect distribution + reversal.
Key confirmation will be a break back below the ascending structure with momentum.
🎯 TRADE PLAN – TWO POSSIBLE SCALPING SCENARIOS
✅ SCENARIO 1: SHORT FROM PREMIUM OB SELL ZONE
Looking to fade bullish liquidity grab near top of range.
Entry: 3,354–3,369
SL: 3,375
TP1: 3,334
TP2: 3,302
TP3: 3,291
Ideal for reversal scalpers catching the distribution move.
✅ SCENARIO 2: LONG FROM DISCOUNT OB BUY ZONE
If price rejects OB SELL and dumps into unfilled demand.
Entry: 3,291–3,302
SL: 3,275
TP1: 3,322
TP2: 3,343
TP3: 3,354
Smart money often reloads after hunting liquidity beneath discount OBs.
⚠️ EXECUTION REMINDERS
✅ Wait for confirmation candles: engulfing / wick rejection / breaker structure
⛔ No market orders without OB reaction
📊 Risk max 1–1.5% per position
📉 Use volume to confirm absorption / exhaustion in OB zones
📢 FINAL THOUGHT – TRAPS COME FIRST, THEN MOVES
Smart Money doesn't chase price — it hunts stops first.
We’re watching closely to see if price completes its liquidity sweep at 3,354–3,369 before a potential reversal. Alternatively, we wait for price to return to the OB BUY zone around 3,291 for a high-RR long play.
🔥 If this helped you:
👍 Like this idea
💬 Comment your thoughts below
🔔 Follow Clinton Scalper for weekly institutional-grade setups
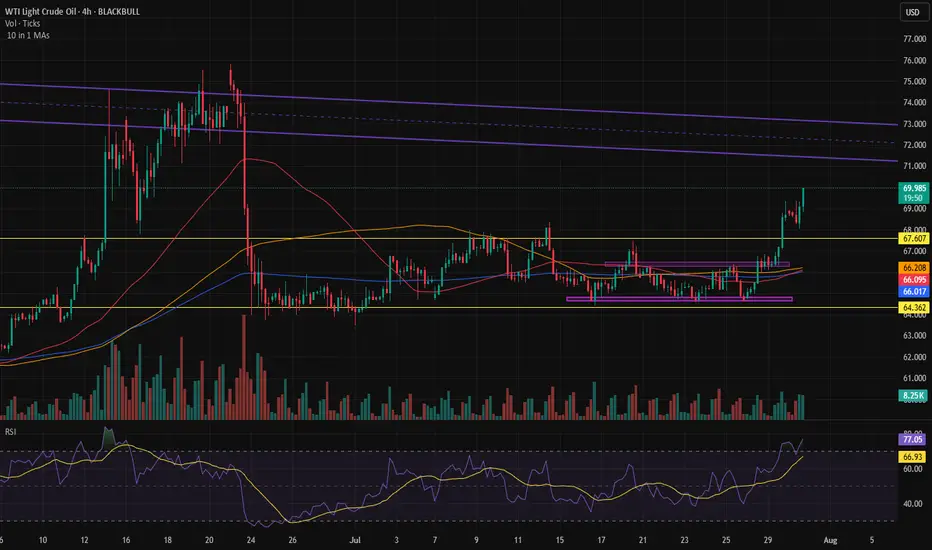
Is there any news in the Middle East?Rapid move in oil.
We need to see if something significant is about to happen in the Middle East — it usually is when we see moves like this.
Xmoon Indicator Tutorial – Part 2 – Pivots🔻🔻🔻+ Persian translation below 🔻🔻🔻
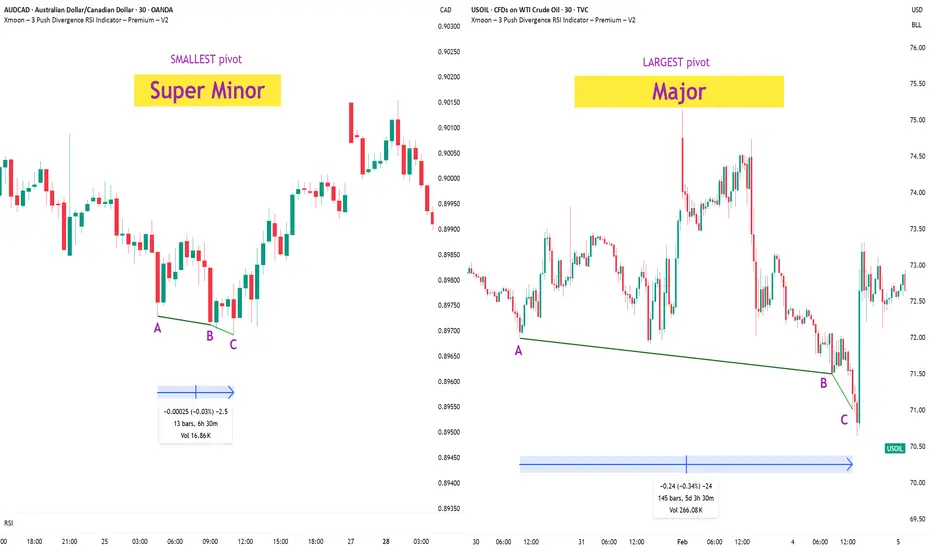
🔹 What Is a Pivot?
In the Xmoon strategy, every high or low that forms on the chart is considered a pivot.
The number of candles between two highs or two lows defines the size of the pivot.
The more candles there are between them, the larger and more reliable the pivot becomes.
🔸 Types of Pivots in the Xmoon Indicator Settings
In the settings panel, you can choose which types of pivots the patterns should be based on.
There are 4 pivot types :
• Super Minor → the smallest pivot
• Minor
• Mid Major
• Major → the largest pivot
⏫ As you move from Super Minor to Major, the strength of the pivot increases — but the number of signals decreases.
⚖️ Choosing the Right Pivot = Your Trading Style
• Want more signals? → Use smaller pivots like Minor or Super Minor
• Prefer higher accuracy and lower risk? → Use larger pivots like Major or Mid Major
💡 Pro Tip: On higher timeframes, pivots perform better and help reduce risk.
✍️ Summary
If you're looking for frequent signals, trade on lower timeframes, and can handle higher volatility and pressure, then smaller pivots like Super Minor and Minor are a better choice.
But if you prefer quality over quantity, work on higher timeframes, and value clarity, peace of mind, and higher success rates, then larger pivots like Mid Major and Major are the way to go.
📣 If you have any questions or need guidance, feel free to ask us. We’d be happy to help.
🔻🔻🔻 Persian Section – بخش فارسی 🔻🔻🔻
🔹 پیوت چیست؟
در استراتژی ایکسمون، هر قله یا درهای که روی چارت شکل میگیرد، یک پیوت محسوب می شود
فاصله زمانی بین دو قله یا دو دره (یعنی تعداد کندلهایی که بینشان قرار دارد) اندازهی پیوت را مشخص میکند
هرچه تعداد کندل بین دو سقف یا کف بیشتر باشد، آن پیوت بزرگتر و معتبرتر است
🔸 انواع پیوت در تنظیمات اندیکاتور ایکسمون
در بخش تنظیمات، میتوانید مشخص کنید که الگوها بر اساس چه نوع پیوتهایی شناسایی شوند
ما ۴ نوع پیوت داریم
• سوپر مینور ← کوچکترین پیوت
• مینور
• میدماژور
• ماژور ← بزرگترین پیوت
⏫ هرچه از سوپرمینور به سمت ماژور برویم، قدرت پیوت بیشتر میشود، ولی تعداد سیگنالها کمتر می شود
⚖️ انتخاب پیوت مناسب = سبک معاملاتی شما
• به دنبال سیگنال زیاد هستید ← پیوت کوچک تر = مینور و سوپرمینور
• به دنبال دقت بیشتر و ریسک کمتر هستید← پیوت بزرگتر = ماژور و میدماژور
💡 نکته حرفهای: در تایمفریمهای بالا، پیوتها عملکرد بهتری دارند و به کنترل ریسک کمک میکنند
✍️ جمعبندی
اگر دنبال سیگنالهای زیاد هستید، در تایمفریمهای کوچکتر کار میکنید و میتونید نوسانات و فشار روانی بالاتر رو تحمل کنید، پیوتهای کوچکتر مثل سوپرمینور و مینور انتخاب مناسبتری هستند
اما اگر در تایم فریم های بزرگتر کار می کنید و کیفیت سیگنال، آرامش ذهنی و احتمال موفقیت برایتان مهمتر است، پیوتهای بزرگتر مثل میدماژور و ماژور انتخاب بهتری هستند
📣 اگر سوالی دارید یا نیاز به راهنمایی دارید، خوشحال میشویم از ما بپرسید
با کمال میل در خدمتتان هستیم
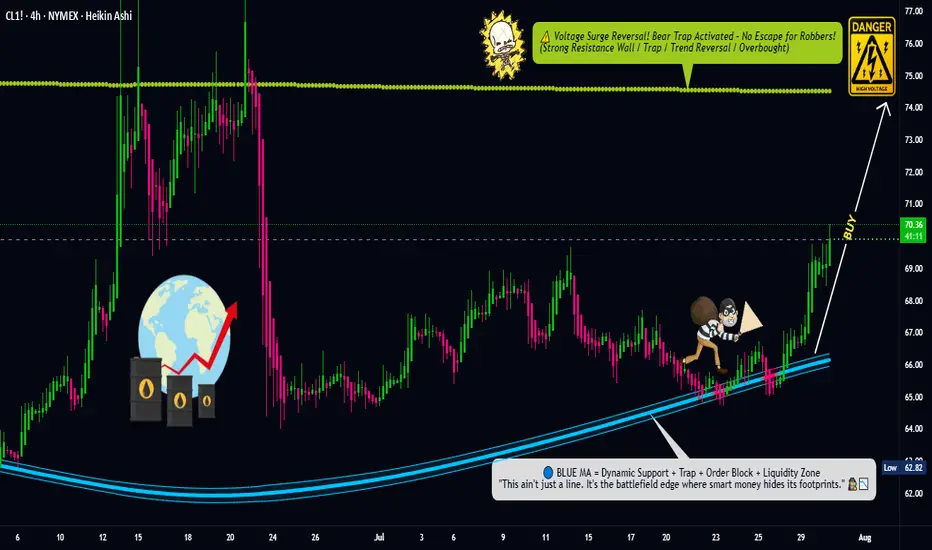
Oil Trap Activated – Limit Orders Set for the Big Score💥🛢️Crude Oil Vault Breach Plan – DCA Heist Begins!🧨💰
🚨Asset: CL1!
📈Bias: BULLISH RAID MODE ON
🎯Target: $74.50
🛡️Stop Loss: $67.50
🔑Entry: ANY LEVEL – Thief stacking limit orders like layers of gold bars 💼⚖️ (DCA Mode Activated)
🕵️♂️Thief Trader is not chasing, we're ambushing 🧠 — scaling in smart with multiple limit traps. The crew never FOMOs, we trap the market 🎯.
💣This is a layered loot plan, not for weak hands. Watch how we load up quietly while market sleeps 😴, then hit hard when the vault cracks open 🔐.
Support this heist by smashing that ❤️LIKE button
💬 Comment your plans below & join the real thief squad
🤝 Together we rob the market — LEGALLY & LOGICALLY
#ThiefTrader #OilHeist #CL1 #BullishTrap #DCA #CrudeOilStrategy #SmartMoneyPlay #MarketRobbery #TeamLoot #NoRetailPanic
GOLD – A Bottom in Place or Just the Calm Before the Storm?GOLD – A Bottom in Place or Just the Calm Before the Storm?
Gold has recently shed nearly $50, indicating sustained bearish pressure. But here’s the real question:
👉 Is this simply a liquidity sweep before a bullish reversal?
👉 Or are we witnessing the early stages of a broader bearish continuation?
Let’s break it all down – step by step – to map out smart, reaction-based trading opportunities.
🌍 Macro & Fundamental Overview
The US–EU trade and defence agreement has dampened gold’s role as a safe haven in the short term.
The US Dollar and equity markets remain strong, driven by solid macroeconomic data.
Overall market sentiment leans “risk-on”, pushing capital into riskier assets and away from precious metals.
📆 Upcoming Key Events:
Tuesday: ADP Employment Data
Friday: FOMC Statement & Nonfarm Payrolls (NFP)
These events could drastically shift market expectations around Fed policy, impacting gold’s direction.
📊 Technical Picture (Timeframes H1–H4)
Gold has rebounded from recent lows and is currently moving within a parallel bullish channel.
However, price is now nearing a critical resistance level at 3342 – a potential turning point.
🔎 Key Technical Zones:
🔺 Short-Term Resistance: 3342
🔺 Major Supply Zone: 3369–3388 (Order Block + Fair Value Gap + Fib 0.5–0.618)
🔻 High-Liquidity Support Zone: 3293–3290
🔻 Key Demand Zone (FVG): 3275–3273
🔺 High-Level Resistance: 3416
🧭 Trading Plan – Based on Price Action (Not Prediction)
We don’t guess the market. We wait, watch, and react based on price confirmation.
✅ Scenario 1 – Buy the Dip (Scalp Setup)
Entry: 3293 – 3291
Stop Loss: 3286
Targets: 3296 → 3300 → 3304 → 3308 → 3312 → 3315 → 3320 → 3330
🟢 Ideal for intraday scalps within high-liquidity zones.
✅ Scenario 2 – Buy from Deep Demand (Swing Setup)
Entry: 3275 – 3273
Stop Loss: 3269
Targets: 3280 → 3284 → 3288 → 3292 → 3300 → 3305 → 3310 → 3320 → 3330
🟢 Great opportunity if price absorbs selling pressure at the FVG zone and reverses.
❌ Scenario 3 – Short from Key Resistance (3342)
Entry: 3340 – 3342
Stop Loss: 3346
Targets: 3335 → 3330 → 3325 → 3320 → 3310
🔴 Use if price fails to break and hold above 3342.
❌ Scenario 4 – Short from Major Supply Zone (Swing)
Entry: 3369 – 3372
Stop Loss: 3376
Targets: 3365 → 3360 → 3355 → 3350 → 3345 → 3340 → 3330 → 3320
🔴 Higher-risk setup; enter only on strong rejection or bearish candlestick confirmation.
⚠️ Risk Management Guidelines
Avoid entries during the London and NY open – fakeouts and stop hunts are common.
Always wait for clear price reaction within zones – avoid impulsive entries.
Respect your stop-loss levels, especially with this week’s major data releases.
🎯 Final Thoughts for UK & Global Traders
Let the market come to you – never chase price.
Stay disciplined, especially in volatile weeks like this one.
The best trades are reactionary, not predictive.
💬 Found this plan useful?
Feel free to comment your views or follow for more structured gold analyses throughout the week.

XAUUSD: Buy ideaOn XAUUSD we have a very nice buy candle. Indeed, this candle reassures us of a high probability of an upward trend....

retest and strong selling zonemarket na bearish pennant pattren banaya tha or thank you god proper pura levels ko repect dee hay market na ... or ab support form ker kay retest kern jara hay apna level ko agaar in area per market mila tau hum sell ki opportunity dekh sakta hay with strong risk management kay saath now Let see kya kerti hay market
Gold is in the Bearish Direction after Breaking SupportHello Traders
In This Chart GOLD HOURLY Forex Forecast By FOREX PLANET
today Gold analysis 👆
🟢This Chart includes_ (GOLD market update)
🟢What is The Next Opportunity on GOLD Market
🟢how to Enter to the Valid Entry With Assurance Profit
This CHART is For Trader's that Want to Improve Their Technical Analysis Skills and Their Trading By Understanding How To Analyze The Market Using Multiple Timeframes and Understanding The Bigger Picture on the Charts
NASDAQ Long 7.30.25Price had hit a weekly +ob on 7.29.25, and the current day (7.30.25) had not taken the previous day high or low, but looked like it wanted to distribute into the pd wick equilibrium premium level. After 10 AM closed as a bullish candle, signifying higher price, I entered iat 11 AM on the 10 AM candle equilibrium. Price hit the 75% BE and Final TP with 1.28 RR.

Today's Gold Price: (3280-3290) Be Cautious About Bottom-fishingToday's Gold Price: (3280-3290) Be Cautious About Bottom-fishing
Today's gold price volatility was another lethargic day.
It oscillated back and forth between 3300 and 3330.
Like a loom, it was a lethargic experience.
In fact:
This market trend is typical of gold's volatility.
It suggests that significant news will be released today.
Buyers are reluctant to buy in large quantities.
Shorts are reluctant to sell in large quantities.
Everyone is waiting and watching.
Once news and market sentiment emerge, we will choose a new direction.
As shown on the 4-hour chart,
the area around 3330 has become a strong resistance zone.
The area around 3300 has become a temporary resistance zone.
The area around 3280 has become a strong support zone.
However, it is worth noting that when this ascending triangle descends, trading volume increases, indicating active selling.
Gold prices are rising, but trading volume is shrinking.
This clearly shows that the funds driving gold prices are not currently active enough.
This suggests that the current bullish momentum has yet to fully develop.
Bulls remain weak and wary of bears.
As a result, everyone awaits today's release of a small amount of non-farm payroll data and the Federal Reserve's interest rate decision.
I expect the Fed to adopt a more dovish stance this time, meaning that while they won't cut rates immediately, they will hint at a rate cut later this year.
Gold prices are likely to continue to fluctuate widely.
Trading Strategy:
Support: $3,280/$3,290
Resistance: $3,330/$3,300
Aggressive Strategy:
Sell Price: $3,295-$3,300
Stop Loss: $3,305
Target Price: $3,280-$3,280
Conservative Strategy:
Sell Price: $3,320-$3,330
Stop Loss: $3,335
Target Price: $3,300-$3,280
Bottom Picking Strategy: (Cautious)
Buy Price: $3,280-$3,290
Stop Loss: $3,275
Target Price: $3,330/$3,350
XAUUSD: Buy idea On XAUUSD we would have a high probability of having an uptrend depending on the configuration of the chart.
