How to Find Liquidity Zones/Clusters on Any Forex Pair (GOLD)
You need just 1 minute of your time to find significant liquidity zones on any Forex pair and Gold.
In this article, I will teach you how to identify supply and demand zones easily step by step.
Liquidity Basics
By a market liquidity, I mean market orders.
The orders are not equally distributed among all the price levels.
While some will concentrate the interest of the market participants,
some levels will be low on liquidity.
Price levels and the areas that will attract and amass trading orders will be called liquidity zones.
How to Find Supply Zones
To find the strongest liquidity clusters, we will need to analyze a daily time frame.
A liquidity zone that is above current prices will be called a supply zone.
High volumes of selling orders will be distributed within.
One of the proven techniques to find such zones is to analyze a historic price action. You should identify a price level that acted as a strong resistance in the past.
4 horizontal levels that I underlined on EURGBP influenced market behavior in the recent past.
The price retraced from these levels significantly.
Why It Happened?
A down movement could occur because of an excess of selling orders and a closure of long positions by the buyers.
These factors indicate a high concentration of a liquidity around these price levels.
How to Draw Supply Zone?
One more thing to note about all these horizontal levels is that they cluster and the distance between them is relatively small .
To find a significant liquidity supply zone, I advise merging them into a single zone.
To draw that properly, its high should be based on the highest high among these levels. Its low should be based on the highest candle close level.
Following this strategy, here are 2 more significant supply zones.
We will assume that selling interest will concentrate within these areas and selling orders will be spread across its price ranges.
How to Find Demand Zones
A liquidity zone that is below current spot price levels will be called a demand zone . We will assume that buying orders will accumulate within.
To find these zones, we will analyze historically important price levels that acted as strong supports in the past.
I found 3 key support levels.
After tests of these levels, buying pressure emerged.
Why It Happened?
A bullish movement could occur because of an excess of buying orders and a closure of short positions by the sellers. Such clues strongly indicate a concentration of liquidity.
How to Draw Demand Zones?
Because these levels are close to each other, we will unify them into a one liquidity demand zone.
To draw a demand zone, I suggest that its low should be the lowest low among these key levels and its high should be the lowest candle close.
Examine 2 more liquidity zones that I found following this method.
Please, note that Demand Zone 2 is based on one single key level.
It is not mandatory for a liquidity zone to be based on multiple significant levels, it can be just one.
We will assume that buying interest will concentrate within these areas and buying orders will be allocated within the hole range.
Broken Liquidity Zones
There is one more liquidity zone that I did not underline.
That is a broken supply zone. After a breakout and a candle close above, it turned into a demand zone. For that reason, I plotted that based on the rules of supply zone drawing.
Start Market Analysis From Liquidity
Liquidity zones are one of the core elements of forex trading.
Your ability to recognize them properly is the key in predicting accurate price reversals.
Identify liquidity zones for:
spotting safe entry points,
use these zones as targets,
set your stop losses taking them into consideration.
They will help you to better understand the psychology of the market participants and their behavior.
I hope that the today's tutorial demonstrated you that it is very easy to find them.
❤️Please, support my work with like, thank you!❤️
I am part of Trade Nation's Influencer program and receive a monthly fee for using their TradingView charts in my analysis.
Futures market
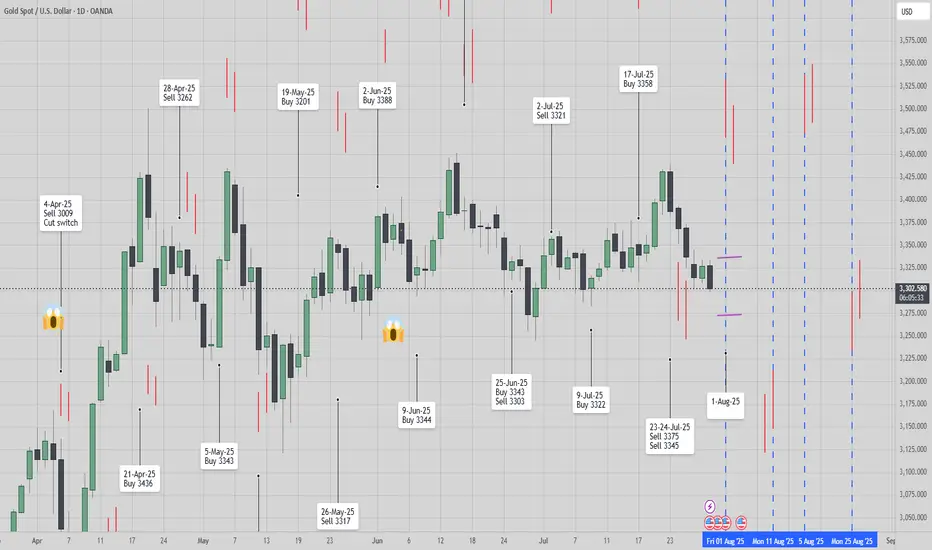
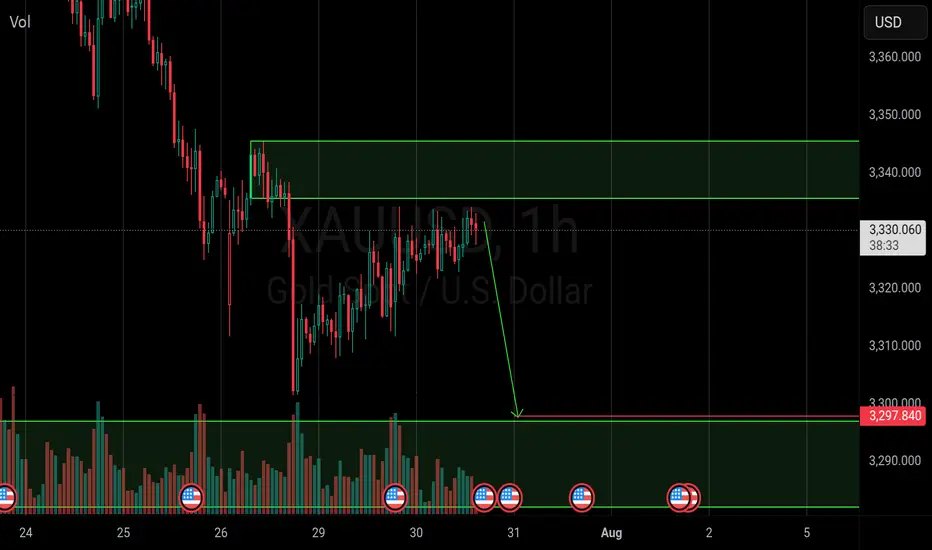
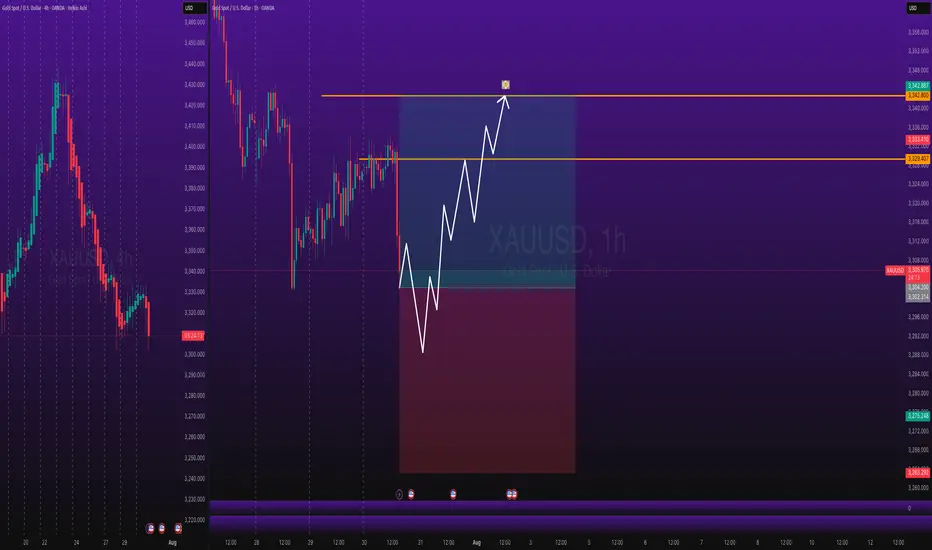
[ TimeLine ] Gold 31 July 2025📆 Today’s Date: Wednesday, July 30, 2025
📌 Upcoming Signal Dates:
• July 31, 2025 (Thursday) — Single-candle setup
• July 31–August 1, 2025 (Thursday–Friday) — Two-candle combined range
🧠 Trading Outlook & Notes
✅ Gold has recently dropped sharply from 3439 to 3298, and current conditions suggest this bearish momentum may continue.
✅ I’ll be actively trading both the July 31 and July 31–August 1 setups as part of my ongoing strategy testing and live analysis.
✅ This method and timing structure can also be applied to other assets like BTC, the US Index, and various commodities.
⚠️ For those taking a more cautious approach, it’s absolutely okay to skip the single-candle setup on July 31 and wait for the more confirmed 2-day range setup (July 31–August 1).
📋 Execution Guidelines
🔹 Range Identification:
• Let the Hi-Lo range of the chosen candle(s) form completely.
• Purple lines will mark these ranges on the chart.
• After the daily close, charts will be updated to include a 60-pip buffer, Fibonacci zones, and relevant indicators.
🔹 Entry Conditions:
• Trades are triggered only if price breaks above/below the full range, including the buffer zone.
🔹 Risk Management – Recovery Logic:
• If the Stop Loss is triggered, the trade is exited or switched, and the next valid breakout setup will use a doubled lot size to attempt recovery.
📉📈 Chart Snapshot
🔗 Paste this in TradingView: TV/x/fykxBG6w/
📌 Stick to the plan, follow the system, and let the chart lead the way.
🛡️ Capital protection comes first — always manage your risk.
How to Trade the Commitment of Traders Report Part 3Hey Traders so today in part 3 final video will explain how to use this data for trend following and as contrarian style.
Enjoy!
Hope This Helps Your Trading 😃
Clifford

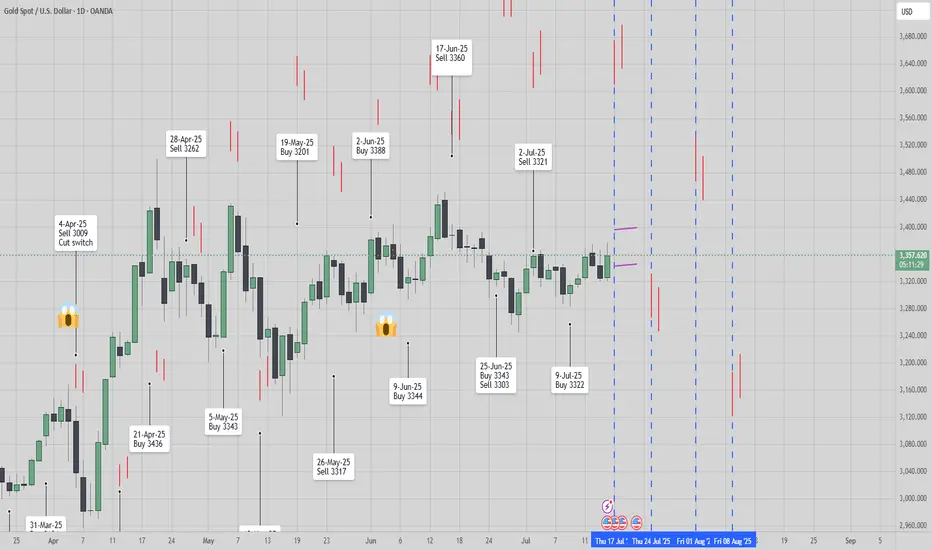
[ TimeLine ] Gold 17 July 2025📆 Today is Wednesday, July 16, 2025
📌 Upcoming Signal Dates:
• July 17, 2025 (Thursday) — Single-candle setup
• July 17–18, 2025 (Thursday–Friday) — Two-candle combined range
🧠 Trading Plan & Notes
✅ Gold recently moved in a wide range between 3365 to 3282, and by the time this signal is published, we’re seeing signs of a strong reversal.
✅ I will be trading both the July 17 and July 17–18 signals as part of my ongoing live research and strategy development.
✅ The same timeframe and signal approach also applies to other instruments such as BTC, US Index, and several commodity pairs.
⚠️ If you’re feeling cautious or risk-averse, it’s perfectly fine to skip the July 17 single-candle setup and wait for the 2-day range (July 17–18) for added confirmation.
📋 Execution Plan
🔹 Range Formation:
• Wait for the Hi-Lo range from the selected candle(s) to fully form.
• Ranges will be marked with purple lines on the chart.
• After market close, the chart will be updated with 60-pip buffer zones, Fibonacci retracement levels, and supporting indicators.
🔹 Entry Trigger Rule:
• Entry only if price breaks out beyond the defined range, including the 60-pip buffer.
🔹 Risk Management – Recovery Strategy:
• If Stop Loss (SL) is hit, the trade will be cut/switch, and position size doubled on the next valid breakout signal to aim for recovery.
📉📈 Chart Reference
🔗 Copy & paste into TradingView: TV/x/6x8VJKs1/
📌 Stay disciplined, trust the process, and let the chart guide your decisions.
🛡️ Manage your risk — protect your capital.
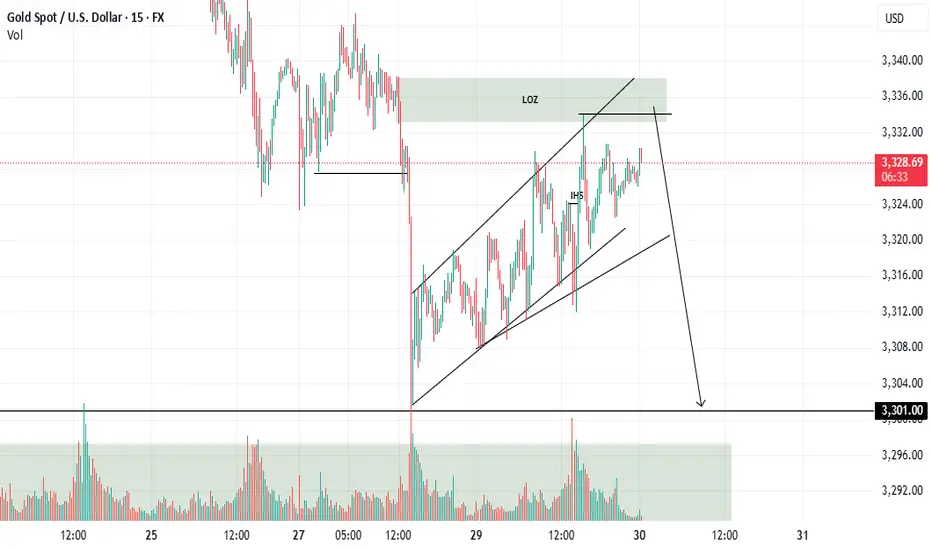
Short idea!Hello all. market needs a new lower low and it reversed from no where. the loz is the best Option here. be happy(wink)
XAUUSD POTENTIAL INTRADAY SELL OPPORTUNITY In today’s trading session, we’re considering shorting Gold from the current price of 3306.65 after the previous pullback completed at the high of 3438.00 our expected target profit is at 3249.56

Implied volatility, one more tool in our arsenalWHAT IS IMPLIED VOLATILITY?
Implied volatility (IV) refers to the market’s expectations of future volatility for a given asset, derived from option prices. Unlike historical volatility, which measures past price fluctuations, IV is forward-looking and reflects what traders believe will happen in the near future, typically over a 1 to 3 month horizon. IV is not directly observable; it is inferred from option prices using models like Black-Scholes. When option premiums rise even though the underlying asset remains flat, this often signals a rise in implied volatility: investors are preparing for more pronounced future price moves.
IMPLIED VOLATILITY IN FX
In FX markets, as in equities or commodities, implied volatility serves as a risk gauge and a proxy for uncertainty. It plays a critical role in portfolio management, hedging, and strategy timing.
High implied volatility on a currency pair indicates market expectations for increased future movement. This can stem from upcoming economic data, central bank decisions, geopolitical risk, or broader market instability. For example, rising IV on EUR/USD ahead of a major Fed or ECB meeting may signal increased demand for options as market participants hedge against potential surprises. Conversely, sustained low IV often reflects calm market conditions or, at times, a strong directional trend.
Implied volatility can act as a market condition filter for trading strategies. To simplify, we can, for example, divide the CVOL level into four distinct categories.
Abnormally low IV (well below average): Reflects extreme complacency or post-event calm.
Moderately low IV (below average): Indicates orderly, technical markets.
Moderately high IV (above average): Suggests elevated uncertainty.
Abnormally high IV (well above average): Signals market stress or panic.
In spot FX, where retail traders rarely engage in options directly, implied volatility serves best as a macro signal, helping inform position sizing, stop placement, or overall risk exposure based on the current volatility regime.
One advanced use of IV is to compare it against realized (historical) volatility. When implied volatility is much higher than realized volatility, it often means options are expensive, and vice versa. This comparison proves especially valuable in FX markets, as it helps traders identify situations where risk premia may be overpriced, revealing potential misalignments between implied and realized volatility. It also offers a forward-looking perspective by highlighting upcoming catalysts that are not yet fully priced into the spot market.
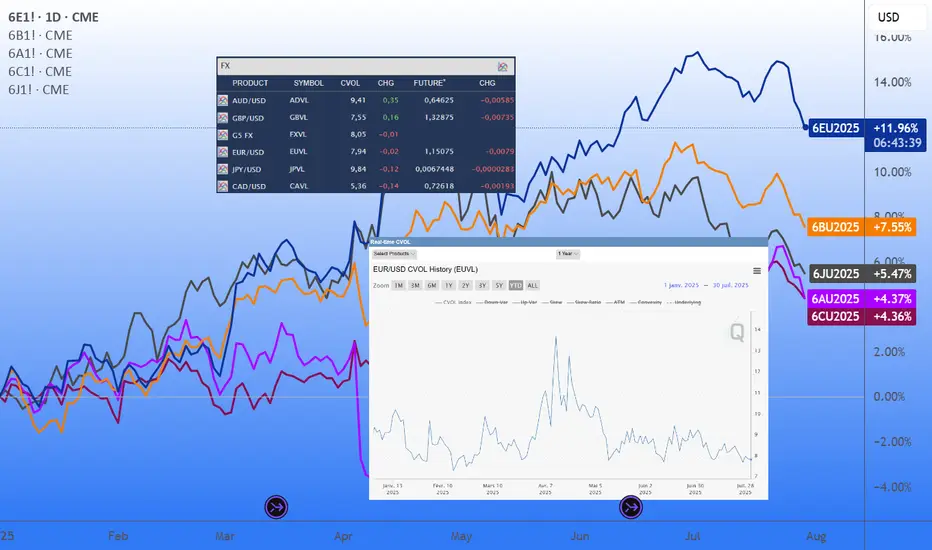
INTRODUCING THE CME CVOL INDEX
To make volatility data more accessible and comparable across asset classes, CME Group introduced the CVOL index family in 2023, a set of standardized implied volatility indexes derived from listed futures options.
How CVOL is calculated?
CVOL indexes are built using vanilla options on futures. They estimate 30-day forward implied volatility, using a basket of out-of-the-money options across various strikes and near-term expirations. The methodology is comparable to that of the VIX in equities, but adapted for the structure of futures markets. Each CVOL index is expressed as an annualized percentage, which can be interpreted as the expected one-standard-deviation move over the next 30 days.
CVOL indexes in FX
Several major currency pairs now have their own dedicated CVOL indexes, offering a real-time measure of implied volatility based on options pricing from CME Group futures contracts. Each index reflects the market’s expectations of future volatility for a given pair:
EUVL for EUR/USD (based on 6E futures)
JPVL for USD/JPY (6J futures)
GBPVL for GBP/USD (6B futures)
CAVL for USD/CAD (6C futures)
ADVL for AUD/USD (6A futures)
In addition to individual pair indexes, the G5 CVOL Index provides a broader view by aggregating the implied volatility of the five major currency pairs, offering a high-level snapshot of volatility across the G5 FX complex. This makes it a valuable tool for macro-focused traders monitoring global risk appetite, cross-asset volatility regimes, or portfolio-level currency exposure.
HOW TO USE CVOL IN PRACTICE
Detecting shifts in risk perception
A sudden spike in CVOL, without a move in the underlying, suggests that institutional players are actively hedging. This can act as an early warning signal for market-moving events or shifts in sentiment. Example: before an ECB decision, a jump in EUVL from 7% to 10% annualized while EUR/USD remains flat may suggest that traders are bracing for a policy surprise.
Adjusting position sizing
When CVOL moves beyond predefined thresholds, traders often respond by reducing leverage, widening stop-loss and take-profit levels, and avoiding overly aggressive directional exposure, in contrast with periods where CVOL fluctuates near its historical average and market conditions appear more stable.
Quant strategy filters
CVOL can also act as a regime filter within systematic trading strategies. For example, when implied volatility on EUR/USD, as measured by EUVL, reaches extreme levels, certain algorithms may shift into breakout mode, anticipating strong directional moves in a high-volatility environment. Conversely, when the index shows no abnormal reading, it may reflect a well-balanced market backdrop, offering more orderly conditions where structured strategies such as range trading tend to perform better.
As historical data on CVOL indexes are available, quant traders can easily backtest and validate ideas that incorporate volatility-based signals or regime filters. More experienced participants often go further, combining FX implied volatility with other volatility indicators, such as CVOL indexes on interest rate futures, to build multi-asset strategies and monitor cross-asset shifts in risk appetite with greater precision.
FINAL THOUGHTS
Implied volatility is a powerful lens into market expectations and potential price swings. In FX, although not always directly accessible to retail traders via options, IV data provides essential context for positioning, timing, and risk management.
With the advent of CME’s CVOL indexes, traders now have a standardized and transparent way to track and compare implied volatility across currencies. Whether you are a macro trader, hedge fund manager, or informed retail participant, monitoring CVOL brings a distinct informational edge, especially when used to anticipate shifts in sentiment and volatility regimes.
And perhaps most importantly: IV doesn’t tell you what happened, but what might happen next, making it an invaluable tool for anyone navigating fast-moving global FX markets.
---
When charting futures, the data provided could be delayed. Traders working with the ticker symbols discussed in this idea may prefer to use CME Group real-time data plan on TradingView: tradingview.com/cme/ .
This consideration is particularly important for shorter-term traders, whereas it may be less critical for those focused on longer-term trading strategies.
General Disclaimer:
The trade ideas presented herein are solely for illustrative purposes forming a part of a case study intended to demonstrate key principles in risk management within the context of the specific market scenarios discussed. These ideas are not to be interpreted as investment recommendations or financial advice. They do not endorse or promote any specific trading strategies, financial products, or services. The information provided is based on data believed to be reliable; however, its accuracy or completeness cannot be guaranteed. Trading in financial markets involves risks, including the potential loss of principal. Each individual should conduct their own research and consult with professional financial advisors before making any investment decisions. The author or publisher of this content bears no responsibility for any actions taken based on the information provided or for any resultant financial or other losses.
GOLD Is ready for a short fallGold is approaching an interesting level and i expect the fall begins soon to beloe marked demand zone
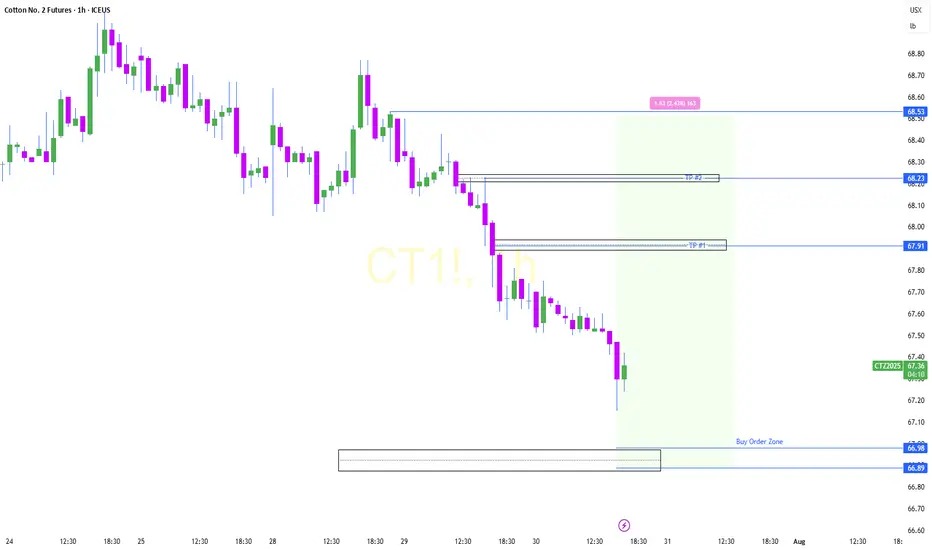
COTON LongCOTON futures have the potential to climb from the 66.9 level within the Fair Value Gap (FVG) zone, aiming to reach a higher FVG zone as the next target.
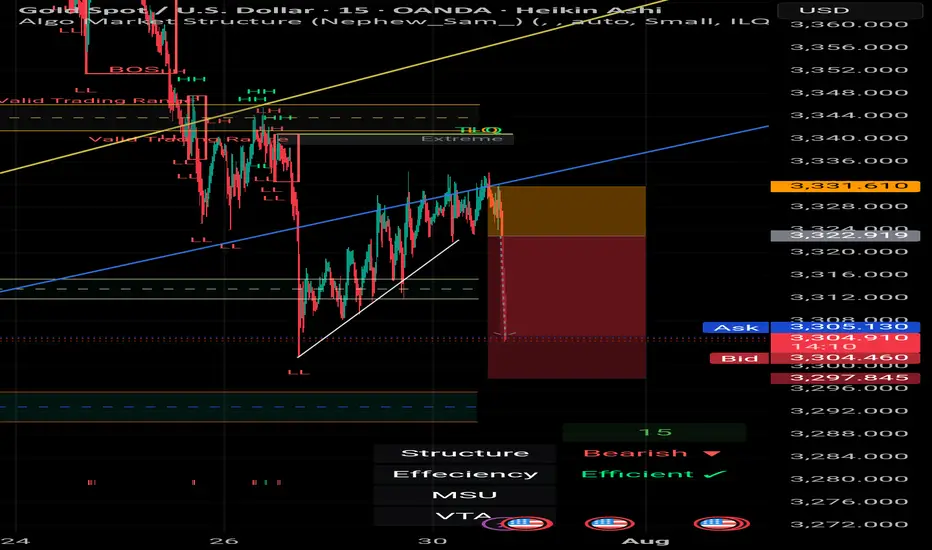
XAUUSSD Possible pullback and shortAll timeframes (1h, 15m, 5m) are in a clear downtrend. The level at 3,329–3,321 was an important support zone that held price up earlier.
Price broke below this support with strong momentum—a sign that sellers are in control.

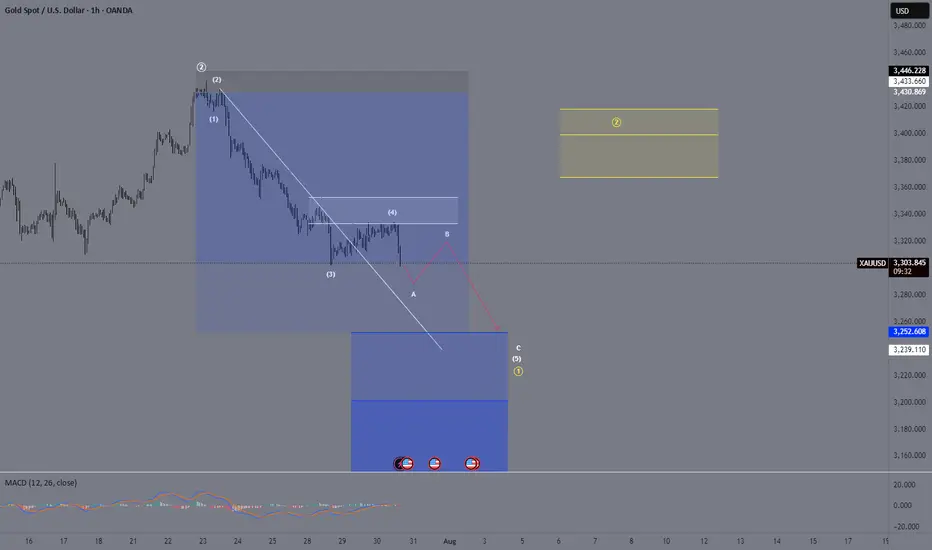
XAU/USD – Endphase der Circle Wave 1 & Vorbereitung auf die KorrOANDA:XAUUSD
We are currently in the final stages of the yellow (Circle) Wave 1 on Gold.
We have just completed wave 4.
How do I identify wave 4? Simple:
📏 I drew a trendline, and once that trendline was broken, the trend of wave 3 was considered complete.
However, we’ve now made a new low, which broke the low of wave 3 — this could very well be our wave A of wave 4 ⚠️.
I’m expecting one more final low, potentially around 3252, or even as low as 3200.
But personally, I lean towards ~3252 as the likely target 🎯.
After that, we should see a move upward into the yellow Fibonacci zone of wave 2 🟡.
The path from Circle 1 to Circle 2 will likely unfold as a corrective A-B-C structure to the upside 🔁.
Following that, we hopefully get a clean five-wave impulse into our (Circle) Wave 3 🚀.
Elliott Wave Analysis – XAUUSD | July 30, 2025📊
🔍 Momentum Analysis
• D1 Timeframe: Momentum has started to reverse upward, but we need to wait for today’s daily candle to close for confirmation. Until then, there is still a risk of another short-term decline.
• H4 Timeframe: Momentum lines are clustering in the overbought zone, signaling a possible weakening of the current upward move. However, this signal alone is not enough to confirm that the uptrend has ended.
________________________________________
🌀 Wave Structure
• Price has reached the projected target for wave e, but there has been no strong bullish reaction. The recent candles are short-bodied and overlapping – typical of corrective structures. Also, this wave has lasted longer than previous corrective upswings, suggesting that the decline may not be over yet and the wave count needs to be reviewed.
Currently, we are facing two equally probable scenarios (50/50), but they suggest opposite outcomes:
➤ Scenario 1: Zigzag (5-3-5) Structure
• The current structure may represent only wave A of a larger zigzag.
• We are now in wave B, which tends to be complex and unpredictable, making it not ideal for wave-based trading.
• The red zones marked on the chart indicate potential target areas for wave B.
➤ Scenario 2: Completed 5-Wave Correction
• The downtrend may have completed at wave (e).
• The current upward movement could be wave 1 forming as a triangle – a potential start of a new bullish cycle.
• However, to confirm this scenario, price must hold above 3309. If it fails to do so and H4 momentum reverses downward, a new low is very likely.
________________________________________
📝 Trading Plan
Given the current market conditions, I only recommend short-term scalp trading based on the predefined support and resistance zones.
Avoid wave-based trading until the structure becomes clearer. Once clarity returns, I will provide an updated trading plan.

Gold (XAUUSD) Breaks Trendline – Potential Downside Ahead?Gold (XAU/USD) has officially broken below a long-term ascending trendline on the 4H chart, indicating a potential shift in market structure. The recent breakout from a bear flag pattern confirms bearish momentum, and price is now approaching a key horizontal support zone around $3,249 and $3,242.
🔹 Trendline support (now resistance) broken
🔹 Bear flag breakdown – strong bearish candle
🔹 Eyes on support levels: $3,249, $3,165, and possibly lower
🔹 Watch for a potential retest of the broken trendline for short opportunities
A clean break and close below $3,249 could open the door for further downside in the coming sessions. Trade cautiously and manage your risk!
Tech Earnings & Fed Meeting - July 30th - ES 100pt drop?I trade ES Futures and have identified an important support shelf that if broken could accelerate lower.
There is lower monthly volume below 6400 area. The monthly Point of Control is currently at 6300. The monthly 61.8% retracement is 6316. We have a fed meeting today and while trapping can happen, my lean is that we lose the 6400 level this week and could reach the 6316 target very quickly. Each level drawn are the more significant levels as to where institutional buyers may step in.

The golden direction in the volatile trend
💡Message Strategy
The market is currently in a wait-and-see phase ahead of major fundamental events. With the Federal Reserve's interest rate decision and key data such as second-quarter GDP and the core PCE price index set to be released, traders are generally cautious. Gold has stabilized slightly after a series of declines, but a meaningful reversal has yet to materialize. The divergence between bulls and bears is intensifying, and the market is on the verge of a breakout. This week's gold market is driven by uncertainty surrounding macroeconomic expectations and the Fed's monetary policy.
After four consecutive trading days of gains, the US dollar index has slowed its gains, temporarily retreating to around 99. Traders are still betting on a September Fed rate cut, with the market placing a 64% probability on a September rate cut. However, this week's release of Q2 GDP and the core PCE price index data will significantly impact this outlook.
If GDP and inflation data are weak, this will reinforce market expectations of easing and potentially attract renewed buying for gold. Conversely, strong data could dampen expectations of a rate cut, supporting a stronger dollar and putting pressure on gold.
Furthermore, the Federal Reserve is about to hold its interest rate meeting. While it's almost certain that interest rates will remain unchanged, Powell's speech will be a key focus for the market. Any signals regarding internal disagreements, adjustments to the inflation path, or adjustments to the policy framework could trigger significant market volatility. From a global perspective, geopolitical risks have been relatively stable recently, providing no sudden support for gold.
📊Technical aspects
Gold is showing signs of a short-term rebound, but the technical structure still indicates a weak rebound, with no confirmed trend reversal. A break above 3350 would be considered a temporary stabilization, while a break below 3300 would reopen the downside. Current market sentiment is in a "wait for a signal" phase.
Gold currently has limited downward space, and data factors are accelerating this week. Gold is likely to undergo a long-short conversion, so our trading strategy uses a small stop loss to counter the larger space for gold's shape conversion.
💰Strategy Package
Long Position:3290-3305,SL:3280,Target: 3340-3360
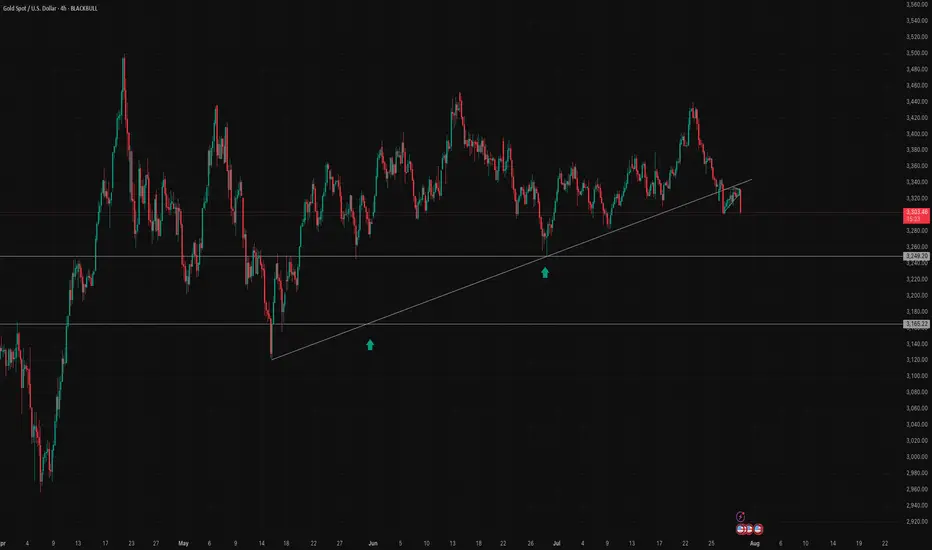
Gold Breakout or Pullback Ahead?Currently, price is in a correction phase within this rising channel after hitting the upper resistance near $3,438. The pullback is moving toward the mid and lower channel zones, which is healthy for a bullish continuation. Gold is in a healthy pullback phase inside a bigger bullish trend. If support at $3,358 – $3,373 holds, expect an upward push back to $3,438 → $3,487 → $3,517 in the coming sessions. Only a clean break below $3,309 would signal a deeper bearish move.
Gold is likely to consolidate or retest the lower channel support ($3,358 – $3,373). If buyers defend this zone, the price is expected to bounce back toward $3,400 – $3,420 and eventually retest $3,438.
Key Price Zones
- Main Resistance: $3,438 (if broken, potential rally toward $3,487 → $3,517)**
- Immediate Support: $3,373 (first reaction level)
- Major Support: $3,358 (key level to protect bullish structure)
- Potential Higher Low Zone: Around $3,342.44
Expected Price Behavior
- If gold holds above $3,373 – $3,358, it is likely to form a new higher low near $3,342 – $3,358 before attempting to push higher.
- A successful breakout above $3,438 would indicate continuation of the bullish momentum targeting $3,487 and $3,517 ).
- Failure to hold above $3,358 may open the door for a deeper correction toward $3,309, but the overall trend remains bullish unless that level is broken.
Trend Outlook
- Short-Term Trend: Consolidation / corrective pullback within a bullish channel
- Medium-Term Trend: Bullish (higher lows and breakout structure intact)
- Long-Term Trend: Bullish as long as the channel holds above $3,309
Gold is currently in a pullback phase after a strong bullish breakout. The market is likely forming a higher low and may resume upward momentum once the $3,373 – $3,358 zone is confirmed as support. A breakout above $3,438 would validate a bullish continuation toward $3,487 - $3,517.
Note
Please risk management in trading is a Key so use your money accordingly. If you like the idea then please like and boost. Thank you and Good Luck!

GOLD Long After Lower Dip - Catching PullbackOANDA:XAUUSD / TVC:GOLD Long Trade, with my back testing of this strategy, it hits multiple tp, here price will pullback up.
Price will bounce in this zone.
I kept SL slight big to be safe because TP levels are good so I don't want to get pushed out because of tight SL.
Note: Manage your risk yourself, its risky trade, see how much your can risk yourself on this trade.
Use proper risk management
Looks like good trade.
Lets monitor.
Use proper risk management.
Disclaimer: only idea, not advice
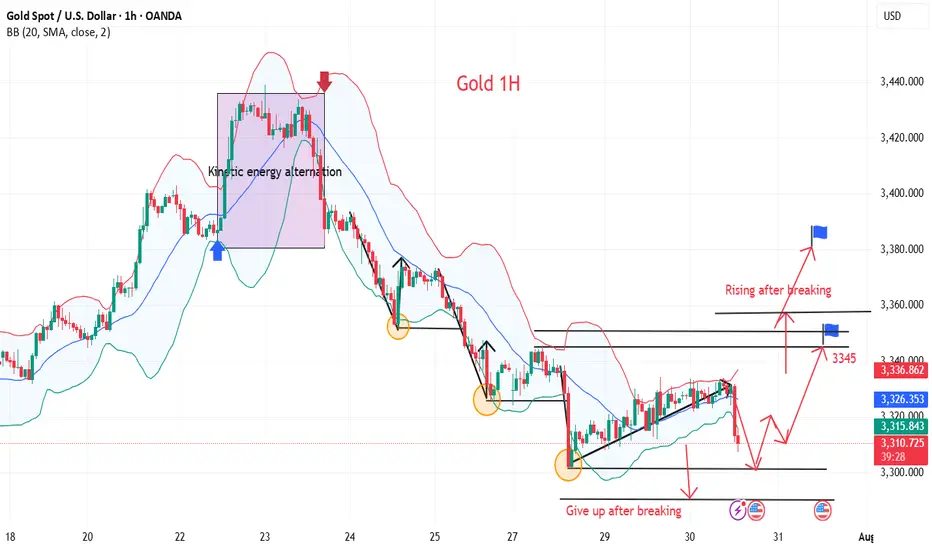
Scalping Sell Setup – Trendline Break & Pullback Confirmation📉 Scalping Sell Setup – Trendline Break & Pullback Confirmation
Posted earlier – trade progressing as planned.
As shared in the previous chart, a Sell scalp position was executed based on the trendline break followed by a pullback retest.
Three Take-Profit levels were marked and the price is moving in line with the forecast. ✅
🟢 TP1 Hit
🟢 TP2 Reached
🔵 TP3 in progress
📌 The setup remains valid, and as long as structure holds below the retested trendline, the bearish bias continues.
We will monitor price action near TP3 zone for final exit or trailing stop update.
> Analysis worked perfectly so far – let’s see if TP3 gets cleared soon. 🔍💥
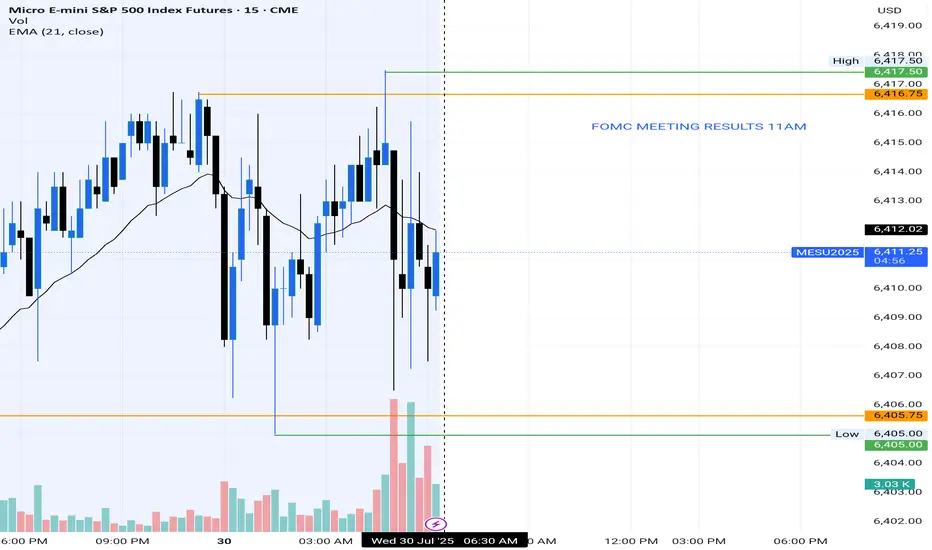
Choppy all day till 11AM PTLooks like it'll be one of those days until 11 :(
What are your thoughts?
Call trade nasdaq? Curious to know how other sectors are. I only track Mes
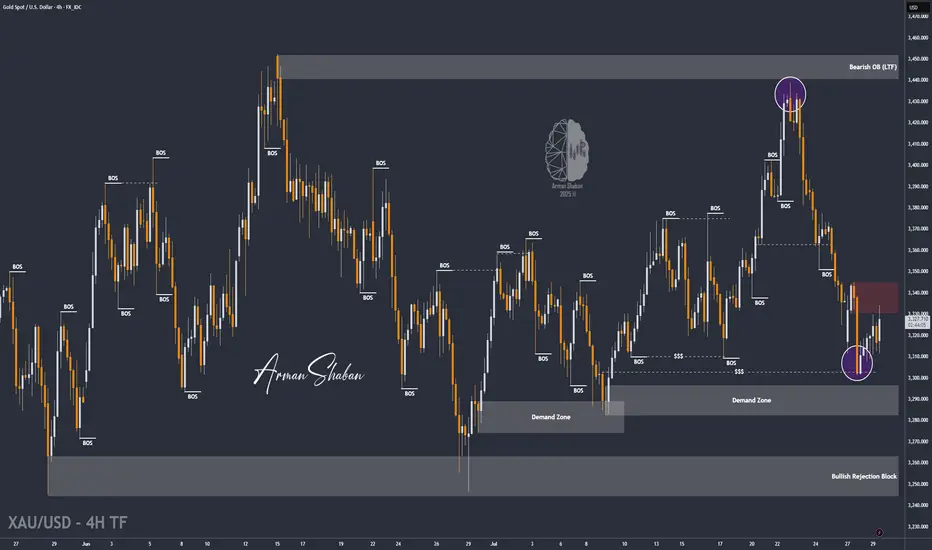
XAU/USD | Gold Below $3345 – Key Demand Awaits at $3282–$3296!By analyzing the gold chart on the 4-hour timeframe, we can see that after dropping to the $3301 area, strong demand came in, helping the price stabilize above $3300 and rally up to over $3334. Currently, gold is trading around $3331. If the price fails to break and hold above $3345 within the next 8 hours, we may see a price correction soon. A key demand zone lies between $3282–$3296, where a strong bullish reaction could occur if price revisits this area. Important supply levels to watch are $3366, $3382, $3393, and $3404.
Please support me with your likes and comments to motivate me to share more analysis with you and share your opinion about the possible trend of this chart with me !
Best Regards , Arman Shaban
Gold VS US 10- year yield Gold pared most of its gains on a strong US dollar. It hits an intraday low of $3307 and is currently trading around $3311.
Any breach below $3305 (365- 4H EMA) confirms trend weakness and a dip to $3245/$3200 is possible. The strong US dollar and surge in US 10-year yield after strong US jobless claims and GDP data.
It is good ot sell below $3305 with an SL around $3330 for a TP of $3245/$3200.

Gold’s Liquidity Hunt Eyes on Bullish FVG Reaction!Gold Analysis – NY Session Outlook
During the New York session, gold created equal highs near recent swing highs, indicating that upside liquidity remains uncollected. Currently, the market is pulling back, targeting liquidity resting below the trendline, along with internal liquidity levels beneath.
If gold continues to move downward and taps into the marked bullish Fair Value Gap (FVG), monitor that zone for any signs of bullish confirmation. If confirmed, there is potential for a further upward move toward the equal highs and beyond, aiming for external liquidity.
Always Do Your Own Research (DYOR).
