Gold Drops After Failing to Hold Above $3322📊 Market Overview:
Gold initially surged above the $3322 resistance, hitting $3329 amid Fed pause expectations. However, a rebound in the US dollar and profit-taking triggered a sharp drop back to $3315, signaling weakening bullish momentum.
📉 Technical Analysis:
• Key resistance: $3322 – $3330
• Nearest support: $3308 – $3300
• EMA09 (H1): Price has fallen below EMA09 → turning short-term trend bearish
• Candlestick / Volume / Momentum:
• Failed breakout above $3322 with strong bearish H1 reversal
• Increasing volume during the drop → rising selling pressure
📌 Outlook:
Gold may continue declining in the short term if it fails to hold above $3312. Bears have taken control after the failed breakout attempt. Risk increases for a move toward $3300–$3295.
💡 Suggested Trade Setup:
🔻 SELL XAU/USD : $3318 – $3321
🎯 TP: 40/80/200 pips
❌ SL: $3325
🔺 BUY XAU/USD: $3295 – $3292 (only with clear bullish signal)
🎯 TP: 40/80/200 pips
❌ SL: $3288
Futures market

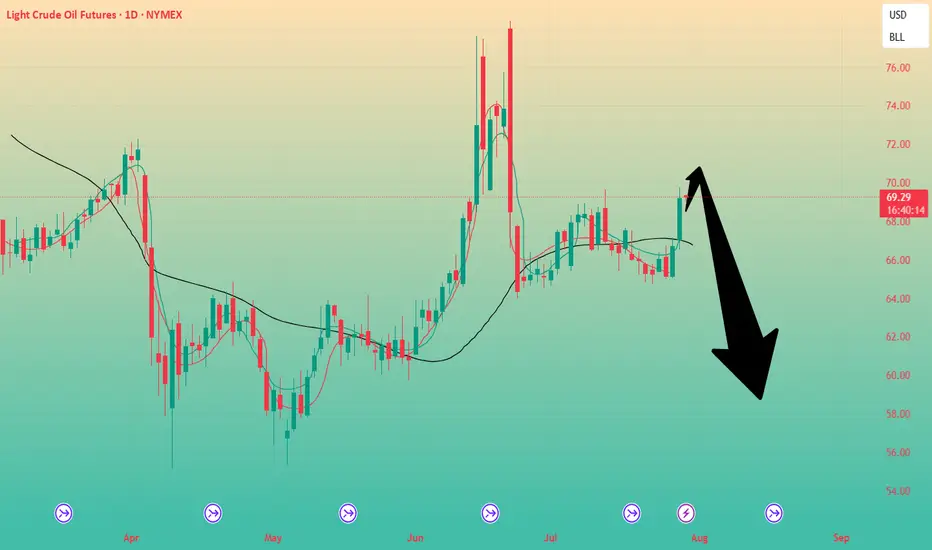
Crude oil: Sell around 70.20, target 65.00-64.00Crude Oil Market Analysis:
Yesterday's crude oil market was very strong, with buying driving the market higher. The daily chart ultimately closed with a clear bullish candlestick. Buying on the daily chart is testing the resistance level between 70.00 and 70.60. After two consecutive days of bullish closes, and with clear bullish candlesticks, I predict another surge today. Let's look at the daily chart. The daily chart shows a significant rebound after a significant drop. Today, focus on selling opportunities between 70.00 and 70.60. A break of this level will change the overall selling trend. The strategy remains to sell high and be bearish.
Fundamental Analysis:
Today, focus on the ADP employment data and the EIA crude oil inventory data. The key news will be the interest rate results during the US trading session, along with speeches.
Trading Recommendations:
Crude oil: Sell around 70.20, target 65.00-64.00
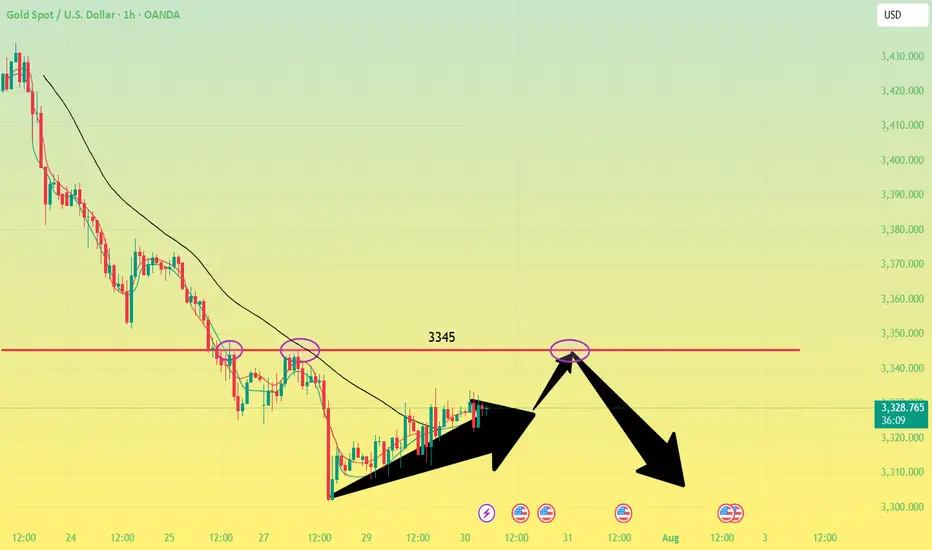
Gold - Sell around 3345, target 3320-3301Gold Market Analysis:
Gold has been in a correction over the past two days, with repeated ups and downs, generally trending towards a low and then a rebound. Yesterday, we insisted on selling at 3320, 3326, and 3328, but the profits weren't significant. The daily chart doesn't clearly indicate stabilization or a reversal of trend. Looking at the longer-term trend, I still insist on buying if 3345 breaks. If it doesn't break, we can hold on to the bearish trend. We previously mentioned that 3300 is support on the daily and weekly charts. A technical rebound and correction after selling below this level is inevitable and a normal technical correction. Furthermore, starting Wednesday, big data will be released one by one, and the market is waiting for the data to guide its direction. The weekly chart is also confused and directionless. We're just small investors; we need to follow, not speculate. The 5-day moving average on the daily chart has dipped below 3335, a level that has been retested multiple times in the Asian session. The current correction range is 3300-3335, with resistance around 3345-3343. The daily chart closed positive again, suggesting that the support below may be difficult to break in the short-term Asian session, and a significant decline is unlikely. We anticipate continued correction pending the ADP results.
Support is 3311 and 3301, resistance is 3345, with minor resistance at 3335. The dividing line between strength and weakness is 3335.
Fundamental Analysis:
Today, focus on the ADP employment data and the EIA crude oil inventory data. The US interest rate results are the highlight, along with the speech.
Trading Recommendation:
Gold - Sell around 3345, target 3320-3301
Gold Key levelsThese are gold key levels for short term or intra day and swing trading. These are on 1h chart.
3290
3325
3350
3372
3402
3452
XAUUSD CAN FLY HIGHXauusd market running in side from last few days now market will touch the support zone so if you to buy gold then you have to good oppourtanity to buy from support level
TRADE AT YOUR OWN RISK
REGARD ALBERT
Clear bearish flows till the next liquidity Gold has been falling for some days now but still we need that liquidity wiped out near 3270 for bigger moves

Gold big data is here! Gold prices are igniting the market!Market News:
Spot gold fluctuated narrowly in early Asian trading on Wednesday (July 30), currently trading around $3,325 per ounce. London gold prices recovered some of their losses on Tuesday after falling for the fourth consecutive day, as the US dollar gave up some of its earlier gains, boosting international demand for gold. Declining US Treasury yields and a weak US labor market report also prompted investors to buy gold. The gold market is currently at a critical turning point. Fundamental buying and selling factors are in fierce competition: on the one hand, easing global trade tensions are suppressing safe-haven demand; on the other hand, falling US Treasury yields and expectations of a possible Federal Reserve shift are providing support. Meanwhile, progress in US-China trade negotiations, Trump's tough stance on Russia and the Middle East, and ongoing geopolitical tensions continue to add further uncertainty to the future of the gold market. Furthermore, attention will be paid to the Bank of Japan and Bank of Canada's interest rate decisions, the US second-quarter GDP data and the July ADP employment data. Second-quarter GDP data from Germany and the Eurozone also warrant attention.
Technical Review:
Gold bottomed out and rebounded, stopping at the 3310 level before rising sharply above the 30 mark. The daily chart closed with a small positive candlestick pattern. The 10/7-day moving averages remain converging, suppressing the 57 level above. The RSI stopped below the 50-day moving average and adjusted downward, with the price trading below the middle Bollinger Band at 40. A four-hour chart golden cross formed and pointed upward. The hourly MACD momentum bar is above zero, while the RSI is flattening, indicating a neutral trend. Gold technically remains in a wide range of fluctuations. The trading strategy is to sell high and buy low. Plan to buy low at 3318/06 and sell high at 3346/58. The release of important data today will affect the original technical trend of gold and silver, increasing volatility. Be aware of market risks.
Today's Analysis:
Although gold rebounded yesterday, the momentum wasn't particularly strong, with the upward trend remaining erratic. Bullish volume remains insufficient. Today's key events will be the non-farm payroll report and the Federal Reserve's interest rate decision. Pre-market activity is unlikely to see a significant upturn, so we'll have to wait for the data to provide direction. Expect volatility before the release! The slope of gold's 1-hour rebound doesn't necessarily indicate a deep V-shaped pattern. Gold hasn't yet reversed, and a second bottom is possible. Only if gold doesn't break a new low during this second bottoming out could a double bottom form. Gold is still expected to decline in the Asian session. If gold rebounds and comes under pressure, continue selling. A deep V-shaped reversal is only possible if gold breaks through and stabilizes at the 3345 level. Until then, continue selling at high prices.
Trading strategy:
Short-term gold: Buy at 3310-3313, stop loss at 3300, target at 3340-3360;
Short-term gold: Sell at 3343-3346, stop loss at 3355, target at 3310-3300;
Key points:
First support level: 3310, Second support level: 3292, Third support level: 3284
First resistance level: 3338, Second resistance level: 3346, Third resistance level: 3358

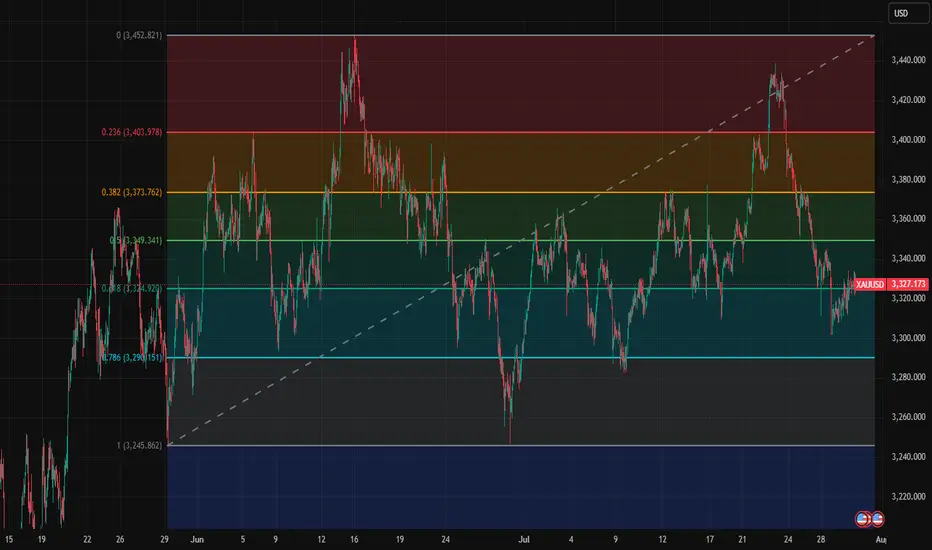
XAUUSD – Weak Rebound, Bearish Bias RemainsYesterday was a quiet and choppy day for Gold.
Although price managed to recover a small portion of last week’s 1400 pip drop, the rebound remains anemic — price barely reached the 23% Fibonacci retracement.
To make things worse for the bulls, the recovery from around $3300 is starting to take the shape of a bearish flag, a continuation pattern that typically signals further downside ahead.
📌 Resistance Zones to Watch:
- Initial resistance: $3345–3350
- Stronger resistance: $3370, a level already proven and well-defined
As long as the price is under those levels, I remain firmly bearish.
📈 Trading Plan:
I already have a short position open, and I'm still waiting to add more, preferably on a push into higher resistance, ideally above $3345.
No need to force entries — I’d rather scale in on strength, not weakness.
Once the correction is complete, I’m targeting:
- $3280 as the first support
- $3250 as a realistic downside objective
Conclusion:
The rebound lacks power. The structure favors the bears.
Still watching for better entries to add short, with eyes on 3280 and 3250 as likely targets.
Let’s stay patient and let the setup come to us. 🎯
Disclosure: I am part of TradeNation's Influencer program and receive a monthly fee for using their TradingView charts in my analyses and educational articles.

XAUUSD M45 Outlook XAUUSD
Liquidity grabbed ✅
Break of Structure & ChoCh confirmed ✅
Price taps into premium OB zone 🧠
Entry from refined supply zone 🎯
Risk:Reward 🔥
SL: 3348
TP: 3290
If this plays out, it's textbook Smart Money 👑
Risk managed. Emotions off. Let the market speak.

Gold Contract Rolled!Now that the contract rolled We might get a bit more movement. Yesterday was nothing but a giant flag. I want to see price go sweep levels before turning full on bullish. We must keep in mind that we are at the end of the month as well. so price can end up stalling till next week. but tomorrow there is a lot of News pending. So that can really shake things up.

XAUUSD – Is gold getting ready to bounce?Right now, gold is reacting around the 3,280 support zone after breaking down from its previous ascending channel. While the broader trend is still under bearish pressure, the recently released JOLTS data came in lower than expected, signaling that the U.S. labor market may be cooling — a mildly positive sign for gold.
From a technical view, price is showing signs of forming a short-term bottom near 3,229 and is starting to rebound. If gold can hold above this support and break through 3,339, a recovery toward the 3,360–3,400 zone could unfold.
That said, this bounce is likely just a technical correction. Without more bearish news for the dollar, gold still risks being rejected around the FVG area and heading lower again.
Trading idea: Consider short-term Buy opportunities if price stays above 3,280 and forms a clear reversal pattern. Stop-loss below 3,229. Short-term targets: 3,339–3,360.
What about you? Leaning towards buying the dip or staying with the downtrend?


Smart money concepts (SMC)1. Market Structure:
• Correctly detected a previous CHoCH and BOS, indicating a potential downward structural change.
• The resistance zone is marked; the price has reacted there several times, showing rejection.
2. Trend Line:
• The dynamic support (trend line) drawn. The ability to wait for a breakout with a possible pullback (retest) before continuing the decline is solid and reduces the risk of false entries.
3. Bearish Confluences:
• The presence of unmitigated FVG on higher timeframes reinforces the bearish projection.
• The entry coincides with the fake-out and resistance zones, which is typical of liquidity traps.
4. TP and SL:
• The target at 3.301–3.317 is realistic because it coincides with previous liquidity zones and the closing of inefficiencies.
• The SL is well-positioned, above the resistance and the wick of the last CHoCH, protecting against potential stop hunts.
5. Trade Management:
• Consider taking partial positions at 3.317 (first target) and letting the rest run to 3.301, securing profits and reducing exposure.
GOOD LUCK TRADERS….;)

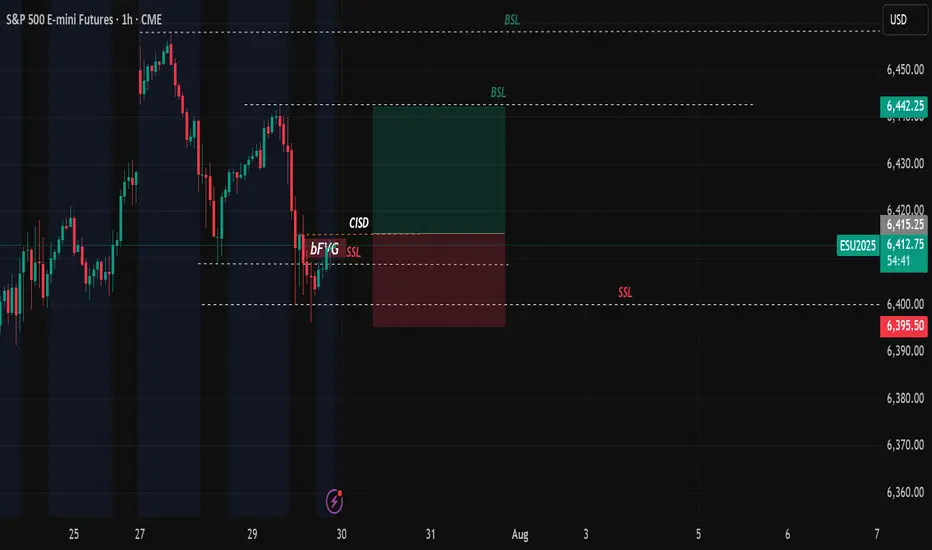
Long ES.. Probably a long in play if we cross/close above CISD as marked.. target the internal BSL as our target.. we sweep to ERL .. If you think i have drawn these incorrectly, i am happy to learn. Thank you
Gold intraday downside
Gold intraday: down trend, short position below 3335 with target 3296 and 3278. Long position 3274-3280.

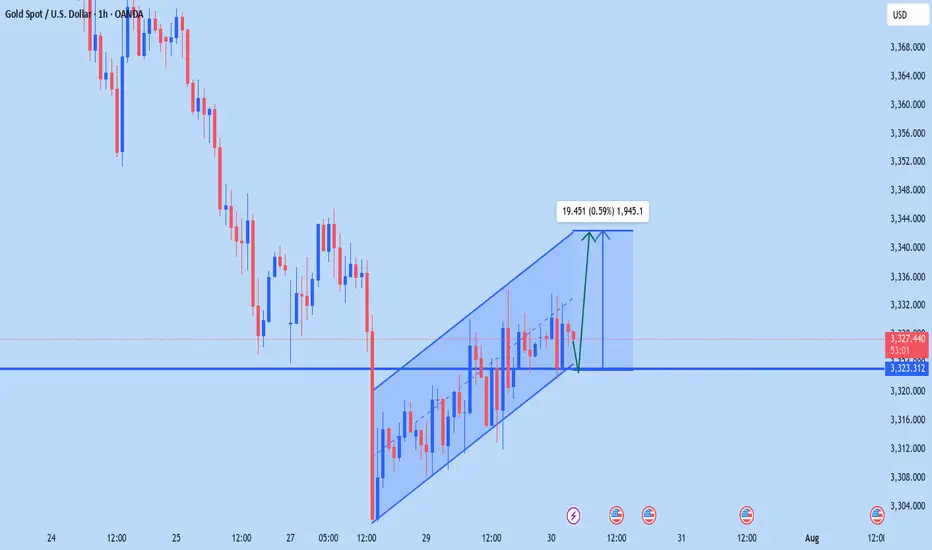
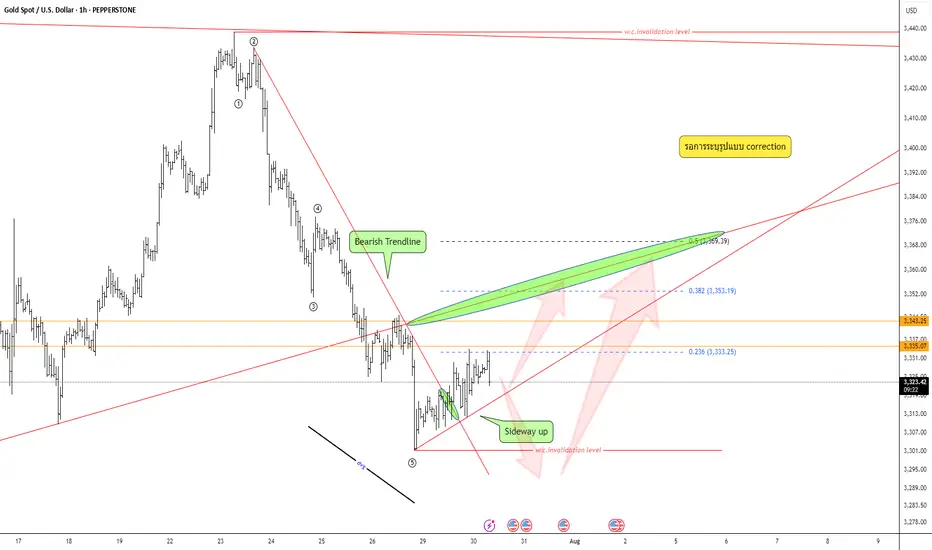
Keep an eye on the correction pattern —Quick Take:
- Strong bearish move, but wave structure still unclear — not a confirmed impulse.
- Bear trendline has broken; market now leaning toward sideways-up.
- Divergence is visible.
Plan:
Wait for correction pattern → confirm with your system → execute only with full data and strict risk management.
XAU/USD(20250730) Today's AnalMarket News:
According to a Reuters/Ipsos poll, Trump's approval rating has fallen to 40%, the lowest level since his second term.
Technical Analysis:
Today's Buy/Sell Levels:
3322
Support and Resistance Levels:
3348
3338
3332
3312
3306
3296
Trading Strategy:
If the market breaks above 3332, consider entering a buy position, with the first target price at 3338. If the market breaks below 3322, consider entering a sell position, with the first target price at 3312.

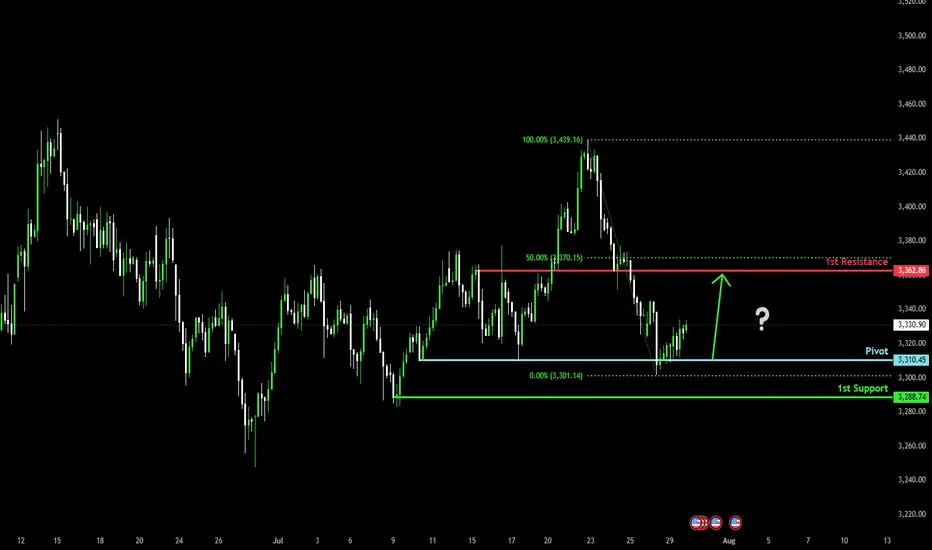
Bullish bounce off?The Gold (XAU/USD) has bounced off the pivot, which acts as a multi-swing low support and could rise to the 1st resistance, which is slightly below the 50% Fibonacci retracement.
Pivot: 3,310.45
1st Support: 3,288.74
1st Resistance: 3,362.86
Risk Warning:
Trading Forex and CFDs carries a high level of risk to your capital and you should only trade with money you can afford to lose. Trading Forex and CFDs may not be suitable for all investors, so please ensure that you fully understand the risks involved and seek independent advice if necessary.
Disclaimer:
The above opinions given constitute general market commentary, and do not constitute the opinion or advice of IC Markets or any form of personal or investment advice.
Any opinions, news, research, analyses, prices, other information, or links to third-party sites contained on this website are provided on an "as-is" basis, are intended only to be informative, is not an advice nor a recommendation, nor research, or a record of our trading prices, or an offer of, or solicitation for a transaction in any financial instrument and thus should not be treated as such. The information provided does not involve any specific investment objectives, financial situation and needs of any specific person who may receive it. Please be aware, that past performance is not a reliable indicator of future performance and/or results. Past Performance or Forward-looking scenarios based upon the reasonable beliefs of the third-party provider are not a guarantee of future performance. Actual results may differ materially from those anticipated in forward-looking or past performance statements. IC Markets makes no representation or warranty and assumes no liability as to the accuracy or completeness of the information provided, nor any loss arising from any investment based on a recommendation, forecast or any information supplied by any third-party.
Daily Analysis- XAUUSD (Wednesday, 30th July 2025)Bias: Bullish
USD News(Red Folder):
-ADP Non-Farm Employment Change
-Advance GDP q/q
-Federal Funds Rate
-FOMC Statement
-FOMC Press Conference
Notes:
- Bullish closure after daily liquidity sweep
- Looking for price to respect 0.618 fib level
- Potential BUY if there's
confirmation on lower timeframe
- Pivot point: -
Disclaimer:
This analysis is from a personal point of view, always conduct on your own research before making any trading decisions as the analysis do not guarantee complete accuracy.

July 30, 2025 - XAUUSD GOLD Analysis and Potential Opportunity🔍 Key Levels to Watch:
• 3384 – Resistance
• 3375 – Key resistance
• 3365 – Resistance
• 3345 – Resistance
• 3336 – Resistance
• 3325 – Key support
• 3310 – Support
• 3300 – Psychological level
• 3283 – Major support
• 3275 – Support
• 3265 – Support
📈 Intraday Strategy:
• SELL if price breaks below 3325 → target 3320, then 3315, 3310, 3300
• BUY if price holds above 3330 → target 3336, then 3345, 3350, 3356
👉 If you find this helpful or traded using this plan, a like would mean a lot and keep me motivated. Thanks for the support!
Disclaimer: This is my personal view, not financial advice. Always use proper risk control.

Gold (XAU/USD) – Technical UpdateDate: July 30, 2025
✅ Market Reaction Confirms the Forecast
In our previous analysis, we highlighted the $3,308–$3,315 region as a high-probability demand zone, reinforced by a deep retracement into the 89% Fibonacci level. We also pointed to a liquidity grab beneath $3,308 and projected a potential bullish reversal toward $3,345 and $3,398.
Today, price action has validated this view with precision.
✅ Price swept liquidity below $3,308 as expected, triggering a sharp rejection from our zone.
✅ A clear bounce followed, pushing price upward and confirming that large buyers stepped in—exactly where we anticipated.
✅ The structure is now shifting bullish, with price currently trading above $3,331, heading confidently toward our first target at $3,345.
📊 Why This Matters
This reaction was not random—it followed the logic laid out in the prior analysis:
-The demand zone was respected.
-The discounted pricing at 89% retracement offered maximum risk-reward.
-The internal imbalance between $3,345–$3,398 continues to act as a magnet, just as we outlined.
This is a textbook move where price hunted stops, tapped into demand, and began its upward drive—exactly as described in advance.
🎯 Targets Remain Valid
Target 1: $3,345 → Currently in progress. Price is gravitating toward this level, which also aligns with the 50% Fib retracement and minor supply.
Target 2: $3,398 → The final destination of this bullish move, completing the fill of the inefficiency left behind by the last drop.
🧠 Final Word
This is a strong confirmation of the original idea. The technical story has unfolded step by step as predicted, proving the reliability of the analysis. For traders following along, this not only reinforces confidence in the setup—but also showcases the power of disciplined, structure-based trading.
🔥 The move is unfolding exactly as projected. Patience, precision, and planning are now paying off.
consider like and follow so you don't miss any next analysis or update of the chart
you can ask me in the comment section

Crude oil starts to rise, are you ready?
💡Message Strategy
Oil prices continued their upward trend amid rising geopolitical risks. US President Trump recently issued a tough statement, demanding Russia end the conflict with Ukraine within 10 to 12 days or face secondary sanctions.
Fears that Russian crude oil exports might be disrupted pushed Brent crude oil prices close to $70 per barrel, marking their largest single-day gain in two weeks at 2.3%. Meanwhile, US West Texas Intermediate (WTI) crude oil prices also remained stable around $67.
The intertwined uncertainties of geopolitics and trade policy have complicated market sentiment. Besides the situation between Russia and Ukraine, investors are closely watching the August 1st trade policy deadline set by the United States and the upcoming OPEC+ meeting in early August, which will determine its September crude oil production increase plan.
The industry generally expects that despite tight crude oil inventories in some parts of the world and strong peak season consumption in the Northern Hemisphere, if OPEC+ continues to increase production, oversupply pressure will gradually emerge by the end of the year.
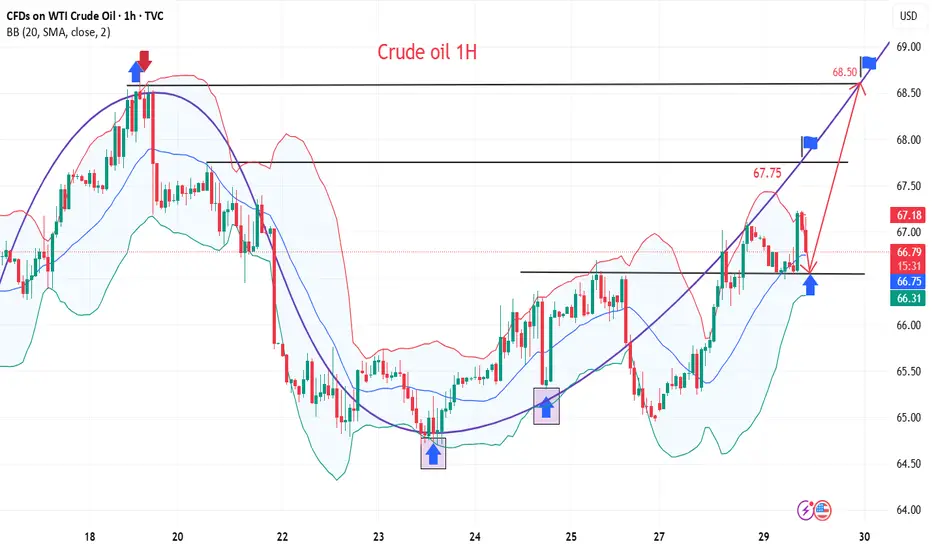
📊Technical aspects
From a technical perspective, the daily chart of US crude oil (WTI) shows a modest upward trend. The current price is trading steadily above its 100-day moving average, indicating continued bullish momentum.
The Relative Strength Index (RSI) remains between 55 and 60, remaining within overbought territory, suggesting further upside potential. A successful break above the key resistance level of $68.50 would open up opportunities towards $70.
💰Strategy Package
Long Position:66.50-67.00,SL:65.50,Target:68.50-69.00
Potential transitionThe S&P 500 daily chart has gotten down to levels that buyers have entered this market previously. This means be cautious on the short side and be aware of the fundamentals that will be released on Wednesday.
