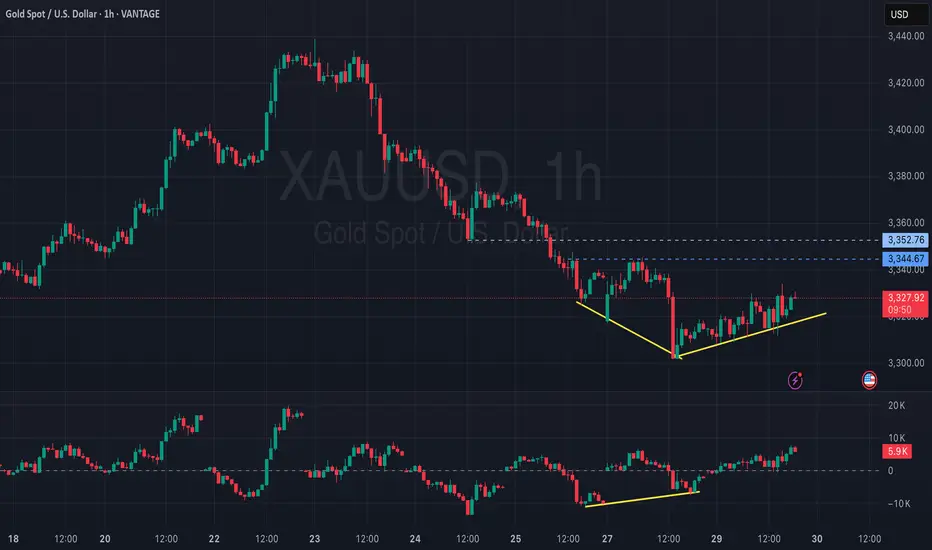
Gold Struggles Near Resistance – Eyes on 3313 for Further DropXAU/USD Slips as Dollar Gains on Trade Deal – Bearish Below Pivot Zone
Gold is under pressure as the U.S. dollar strengthens on optimism around a trade agreement. Risk appetite has returned, weighing on safe-haven demand.
Price failed to hold the pivot zone (3347–3360) and is now slipping below 3327. A 4H close below 3313 will likely trigger further downside.
Until bulls reclaim the pivot, bias stays bearish. Next support sits near 3287 if 3313 breaks clean.
Key Levels:
Resistance: 3388 – 3390 – 3412
Pivot Zone: 3340 – 3347
Support: 3313 – 3263
Futures market

XAUUSD ShortI am a beginner trader! This is just an analysis for educational purposes. I don't provide signals for trading.

GOLD awaiting confirmation of a bullish zone formation.Gold has confirmed support at 3310, with the price rebounding and returning to the buying side. We are now awaiting confirmation of a bullish zone formation.
Gold remains under pressure ahead of key market-moving events, including the US GDP data release and the Federal Reserve’s interest rate decision. However, the pause in Dollar strength is offering some support to the gold price. As long as the price holds above this level, the bullish scenario remains valid. A sustained move above this zone may open the path toward the next resistances: 3360 / 3385 we can expect Growth more.
You May find more Details in the Chart.
Trade wisely best of Luck Buddies.
Ps: Support with like and comments for more insights Thanks for Supporting.

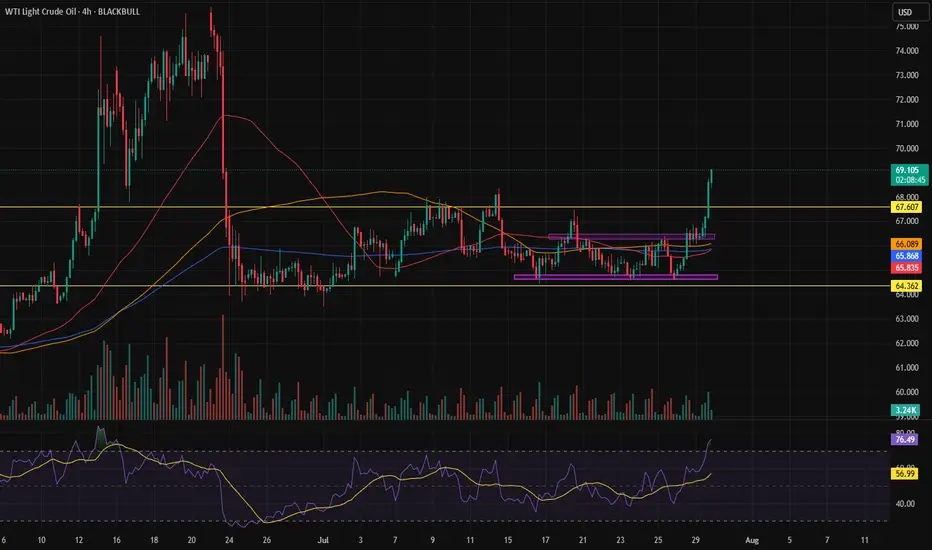
30/7/25 Weak Selling Pressure So Far
Tuesday’s candlestick (Jul 29) was a bull doji bar closing in its upper half with a long tail below.
In our last report, we stated traders would see if the bears could create follow-through selling, or if the pullback phase would be weak and sideways, holding above or around the 20-day EMA instead.
The market opened lower but traded sideways to up for the rest of the day, holding above the 20-day EMA.
The bulls want a retest of the April high.
They want any pullback to lack follow-through selling, similar to the last few pullbacks (July 7, July 11, July 15, and July 22). They want the 20-day EMA to act as support. So far, this appears to be the case.
If there is a deeper pullback lasting more than a week, they want it to be shallow (overlapping candlesticks, bull bars and long tails below candlesticks).
They want another strong leg up to form the wedge pattern, with the first two legs being Jun 20 and July 24.
The bears want a reversal from a large wedge pattern (May 15, Jun 20, and Jul 24) and an embedded wedge (Jul 14, Jul 18, and Jul 24). They want a major lower high vs the April high.
Previously, the bears were unable to create follow-through selling in the last four selloff attempts (July 7, July 11, July 15, and July 22).
They need to create consecutive bear bars closing near their lows and trading below the 20-day EMA to show they are back in control.
If the market trades higher, they want it to stall around the July 24 high area, forming a double top.
Production for July is expected to be around the same level as June or slightly higher. August may be flat or down.
Refineries' appetite to buy looks decent recently.
Export: Down 10% in the first 25 days.
So far, the buying pressure is slightly stronger than the selling pressure, but not in an overwhelming way yet (no strong consecutive bull bars closing near their highs).
However, the move up has lasted a long time. The market may have to form a pullback before it moves higher again. The pullback phase is underway.
Traders will assess the strength of the pullback to determine whether it will be a minor correction or something more significant.
So far, the pullback appears to be minor.
The bears need to create follow-through selling to show they are back in control, something they couldn't do in the last few pullbacks (July 7, July 11, July 15, and Jul 22).
For tomorrow (Wednesday, July 30), traders will see if the bulls can create a retest of the July 24 high and a breakout above.
Or will the market trade slightly higher but stall around or below the July 24 high, forming bear bars instead?
Andrew

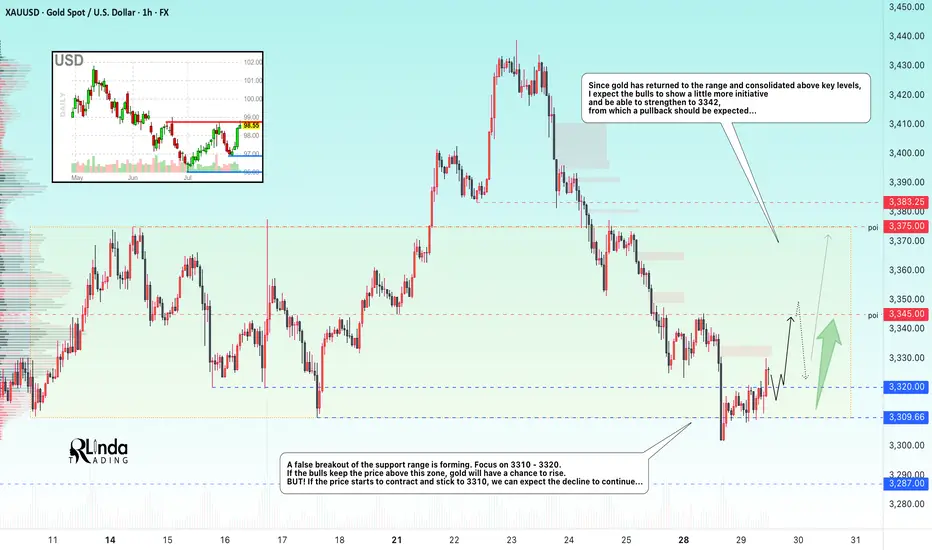
GOLD → Formation of a trading range. 3345?FX:XAUUSD confirms support for the local range. A false breakdown has formed and the price has returned to the buying zone. We are waiting for the bulls to take the initiative...
Gold is trying to recover after falling to $3302, remaining under pressure ahead of key events in the US: the publication of GDP data and the Fed's decision on interest rates. Support is provided by a pause in the dollar's growth, expectations of an extension of the US-China trade truce, and growing demand for safe-haven assets amid a surge in oil prices due to the threat of new sanctions against Russia. However, the sustainability of growth is in question: the dollar may strengthen thanks to optimism about the US economy and progress in negotiations.
A false breakdown of the support range is forming. Focus on 3310-3320. If the bulls keep the price above this zone, gold will have a chance to grow. BUT! If the price starts to contract and stick to 3310, we can expect the decline to continue...
Resistance levels: 3345, 3375
Support levels: 3320, 3310, 3287
The two-day movement has most likely exhausted its potential, or the market has decided to recover slightly due to the unpredictability factor. A false breakdown of support could trigger a pullback to the strong level of 3345, from which a rebound could form (either before growth or before the continuation of the decline; it is necessary to monitor the reaction and the market background...).
Best regards, R. Linda!
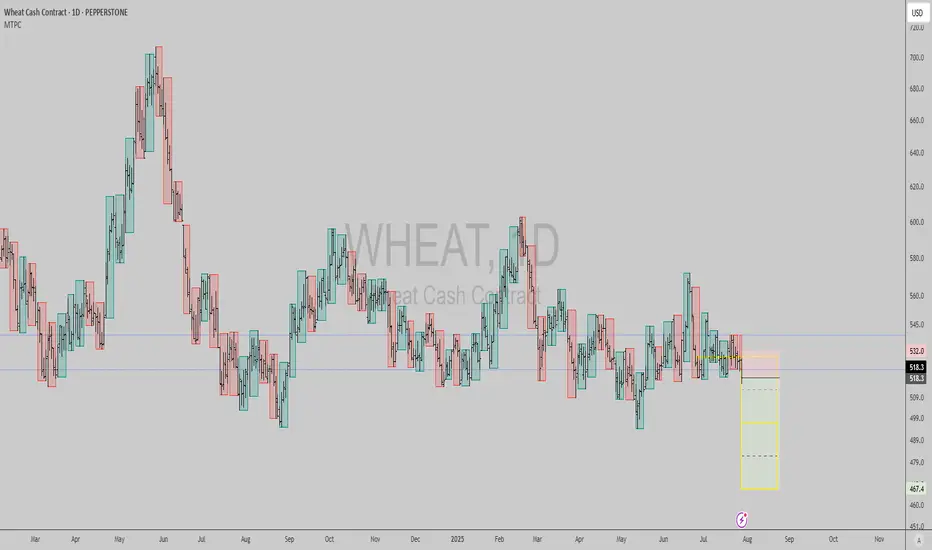
WHEAT: Short signal amidst Russia/Ukraine truce deadlineThe market seems to be pricing in a possible truce between Ukraine and Russia, since Trump gave Russia a 2 week deadline to achieve it or risk further sanctions. The technical chart has a picture perfect short signal in the daily timeframe with good reward to risk here.
Best of luck!
Cheers,
Ivan Labrie.
XAUUSD go for long!Hi all
After hitting the support zone its quite obvious that XAUUSD will increase! and we can go for long!!
Currently its double bottom, but it may go for third!
Note: am new trader and not an expert!! Please stick with your thoughts and analysis if its against mine!
Am sharing my thoughts and all depend on my analysis!
Please let me know if you agree or disagree with me!
ES Scenario 2 29-07Finally, scenario 2 was realized today, touching and perfectly respecting the levels that we had previously indicated, rising upwards to the equilibrium point and then continuing downwards. While the Nasdaq was more bullish at the beginning, it also fell quite a bit.

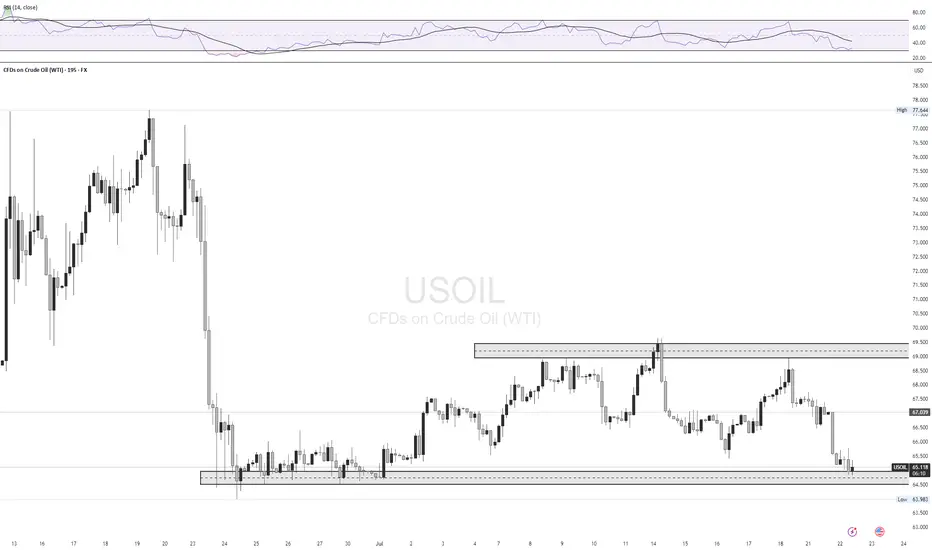
After 35 daysOil finally broke out of the range after 35 days, and now it’s time to wait for a trigger to enter and follow the trend.
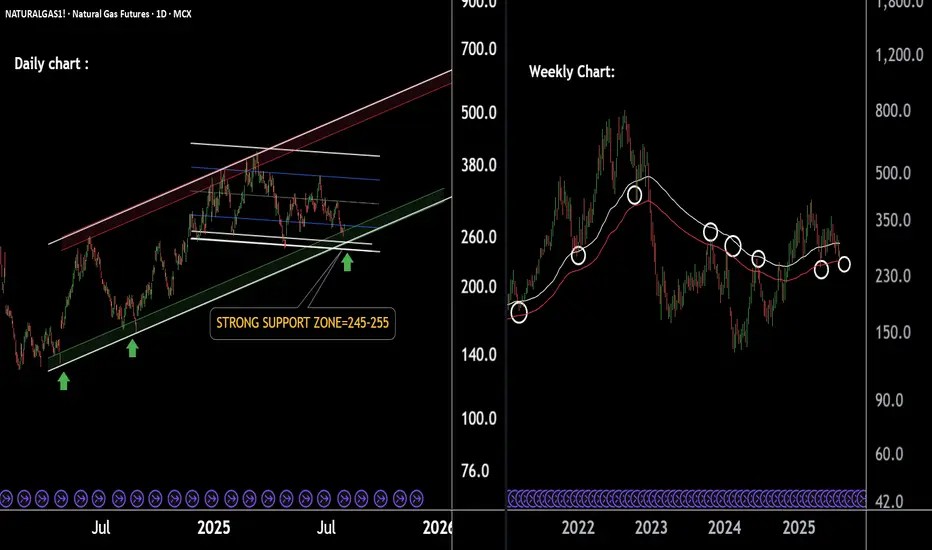
Natural Gas Cooling Near Support Zone – Bounce Ahead!Natural Gas Technical Overview (2-Chart Analysis):
Chart 1 – Parallel Channel Formation:
Natural Gas is moving within a well-defined parallel channel.
The lower support boundary of this channel is observed near 250, indicating a potential bounce zone.
Chart 2 – EMA-Based Support Structure:
Price is currently sustaining above key EMAs, reflecting short-term strength.
The last EMA support lies around 252, acting as an additional support confluence.
If this level is sustain then we may see higher prices in Natural gas futures.
Thank you !!
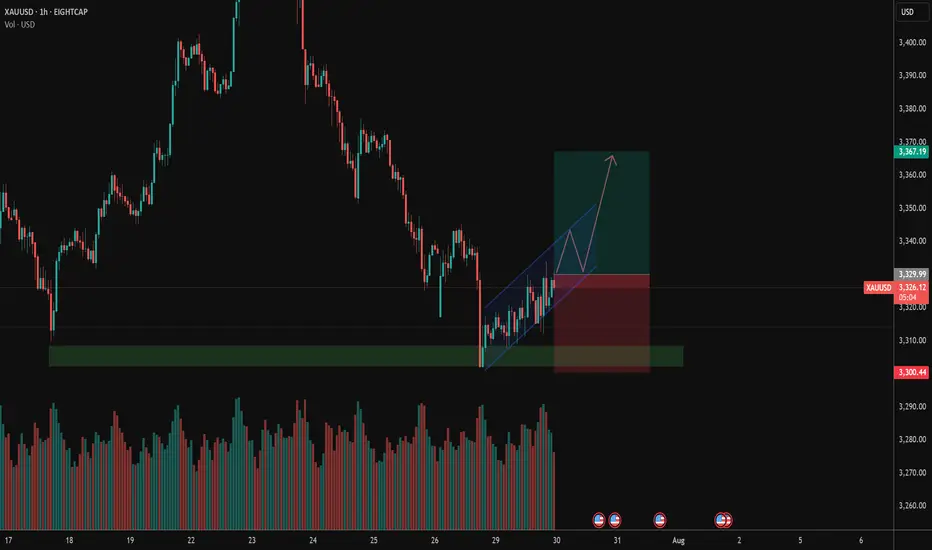
Gold 3H Bullish Reversal SetupGold (XAU/USD) 3H Chart Setup:
Price has bounced from a key support zone around 3315, triggering a potential bullish reversal. The target is set near 3360, with a stop loss below the support zone. The projected price path shows possible consolidation before an upward breakout.

Gold Eyes Rebound Toward $3,438 TargetGold (XAU/USD) is trading near $3,314, approaching support along the rising trend line. A potential bounce could target the $3,438 resistance area, as marked in the chart.

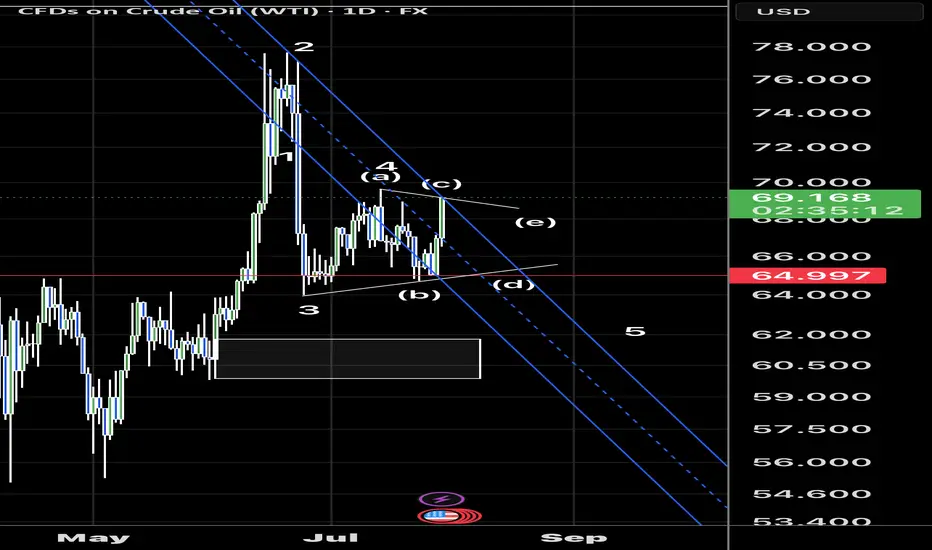
Crude hit the c wave finish of a triangle ? Crude finishing up the c wave of a triangle? Let’s see if we turn this lower in a d wave of a possible 4th wave triangle
NQ: 226th trading session - recapVery interesting price action today. It was really a setup that I look out for: I call it the "push & pull" situation. It basically means that we get a (bullish) push, we see loss of momentum and then we try to look out for the reversal (=pull). This basically just goes off of market theory and fundamental price action: One side gets really excited and buys/ sells a lot, then after the push happened they lack buyers/ sellers - so then the other side takes over.
It's a bit more complicated that that (+ all the technical factors like all time highs and POI's etc.) but it is a cool setup to look out for.
And obviously, I only look for a bullish push followed by a bearish pull - I only sell short.

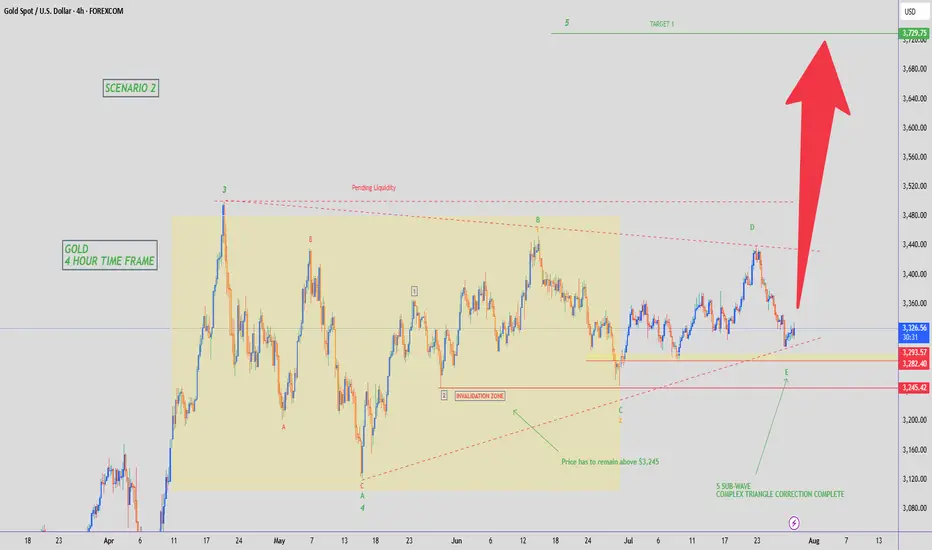
GOLD - WAVE 5 BULLISH TO $3,734 (UPDATE)Quick & simple ‘Elliott Wave Theory’ analysis for our Gold ALTERNATIVE SCENARIO.
⭕️Complex 5 Sub-Wave Correction.
⭕️Buyers Remain Above $3,245.
⭕️Pending LQ at $3,500.
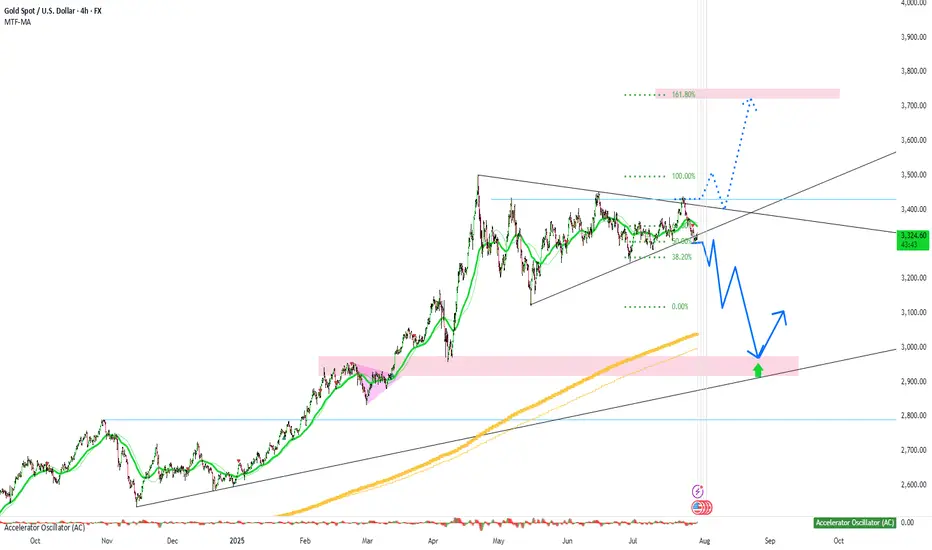
gold 4hour say: put sellstop in lowpersonaly i predict mini crash on gold and waiting for it , now we have powerfull 3angel pattern we must put sellstop in last low , buystop on last high
sellstop stoploss = last high
if sellstop open like new traders , dont close it soon , wait minimum 2 week ,understand?
ALERT= if gold can break last high , it can start new up trend, wave , so if you have old sells ,you must put SL or hedge buystop in last low
if sell
wishhhhhhhhhhhhhh youuuuuuuuuuuuuuuu win
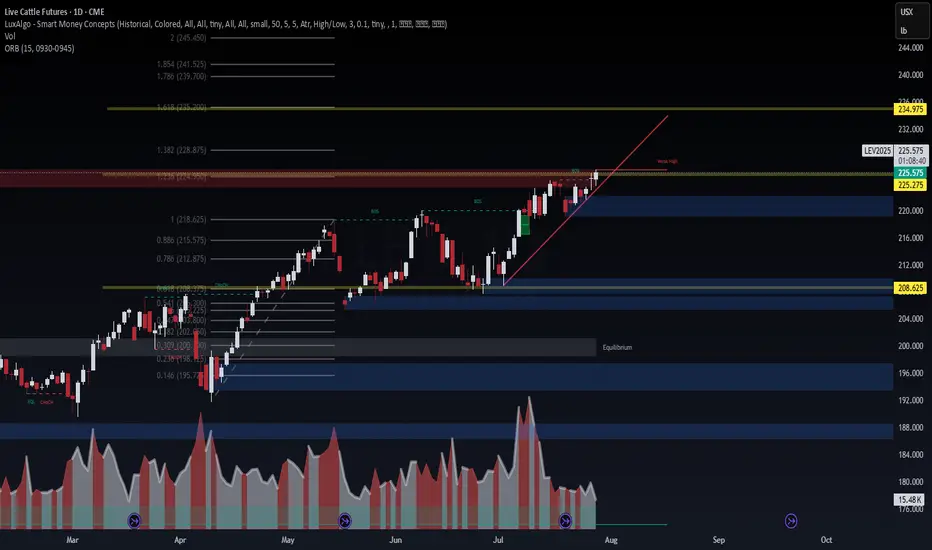
Live Cattle Futures (LEV2025) – Approaching Breakout Zone🐄 Live Cattle Futures (LEV2025) – Approaching Breakout Zone
WaverVanir DSS models show LEV2025 pushing into a key resistance band near 225.65–228.87 — the "weak high" zone where institutional sellers previously stepped in. Price remains in a clear bullish structure with clean BOS and rising demand.
🔍 Chart Structure Highlights:
📈 Trendline support holding since early June
🟨 Price sitting just below 1.382 Fib (228.87) – strong resistance
🟩 If broken, next fib extensions align at:
TP1: 234.97
TP2: 239.70
TP3: 245.45
🟦 Key downside structure support = 208.62 (CHoCH zone)
🧠 Options Flow (Aug–Dec 2025)
🟢 Call Buying: 224C, 225C, 226C, 242C – strong bullish pressure
🔴 Put Selling: 224P, 222P, 210P – income strategies defending downside
💡 Flow favors continuation higher, but many traders capping profits → suggests grind higher, not a parabolic run yet
📈 Strategy Insight
VolanX DSS bias: Bullish with caution
Break above 228.87 confirms squeeze toward 234–240 range
Failure to break = short-term fade back to 218–212 support band
🎯 Watch Levels
Breakout Confirm: Close above 229.00
Invalidation: Daily close below 218.62
Next Target Zone: 234.97 – 239.70 (1.618–1.786 extension)
#LEV2025 #LiveCattle #SMC #VolanXProtocol #CommodityFutures #OptionsFlow #FibStrategy #WaverVanir #DSS #Agriculture #MacroTrading #CMEFutures
Corn Futures (ZCU2025) – Heavy Structure, Heavy Pressure📉 Corn Futures (ZCU2025) – Heavy Structure, Heavy Pressure
WaverVanir DSS shows continued downside probability in Corn as price compresses below the 0.786–1.272 fib zone and forms a supply rejection cluster near 4.10–4.27.
🧠 Macro Snapshot:
🌽 USDA WASDE (Aug 12) may revise yield upward amid favorable Midwest weather → bearish catalyst
🇧🇷 Brazil exports peaking + weak BRL = added global pressure
💵 Strong USD + elevated carry costs reduce long-side incentive
🏦 Fed tone remains hawkish → commodity bearish bias holding
🔍 Technical Breakdown:
✅ Confirmed BOS → CHoCH → Lower High confirms bearish control
📐 Fibonacci clusters align at:
🔻 TP1: 3750–3640 (1.236–200% ext)
🔻 TP2: 3480–3400 (2.27–2.41 ext + strong low confluence)
🛑 Invalidation above 4110–4140 (structural break + 1.272 retrace buffer)
🎯 Trade Setup (Short Bias)
Criteria Details
Entry Zone 3890–3880 (confirmed rejection candle)
TP1 3640 (volume/imbalance cluster)
TP2 3480 (fib confluence)
TP3 3270 (final extension)
Stop-Loss Close above 4110
Risk/Reward Targeting 3.2R at TP2
⚠️ What to Watch
📆 WASDE Aug 12
💬 CFTC Net Positioning (Fri)
🌡️ Weather swings (Corn Belt)
🧮 ZCU25 calendar spreads (ZCU25-ZCZ25)
🚀 The rocket is reserved for when fundamentals flip (e.g., yield shock, China buying). Until then, structure says one thing:
Smart money is hunting liquidity below 3640.
#ZCU2025 #CornFutures #FibStrategy #WaverVanir #VolanXProtocol #SmartMoneyConcepts #DSS #CommodityTrading #MacroAnalysis #ProbabilisticSignals #HawkishFed #SupplyChainPressure

XAUUSD idea 29/07/25We are waiting for our asset to reach our action zone, and based on the reaction, we’ll decide on our next moves.ALWAYS WAIT FOR A CONFIRMATION TO SEE IF THE PRICE VALIDATES THE ZONE.and you what is your vision of the EURUSD its interests me! i wait you in the commentary

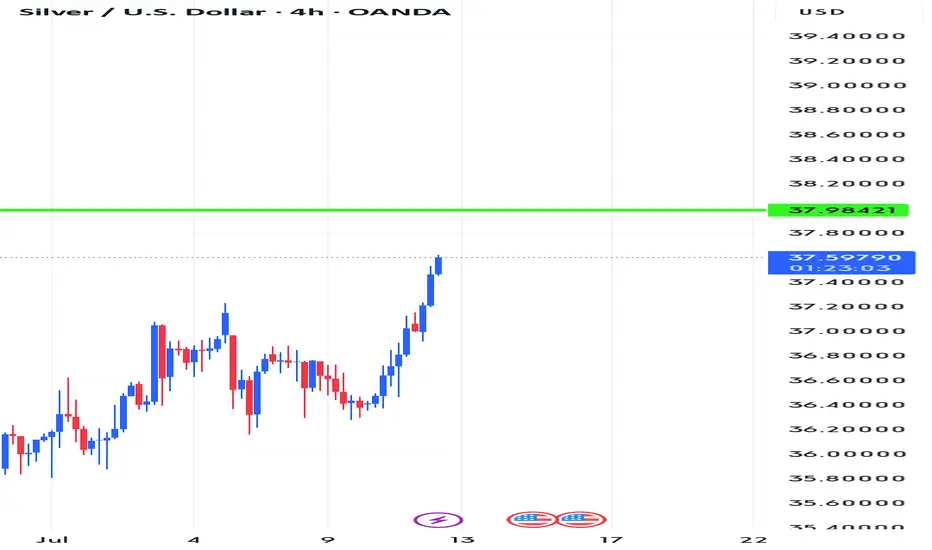
Do you agree with me for XAGUSD?
Hi my friends
Do you think silver is still bullish?
I think it is bullish for now. Shall we go buy together?
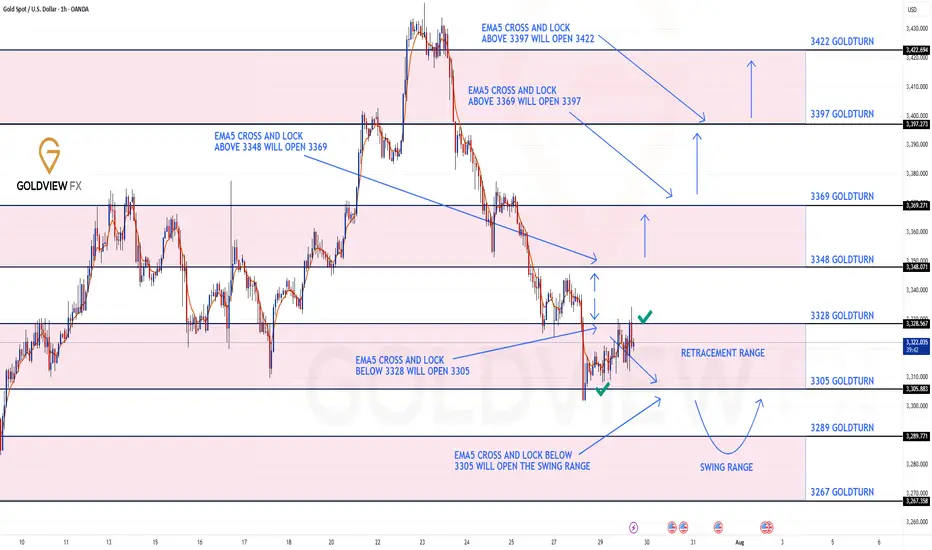
GOLD ROUTE MAP UPDATEHey Everyone,
Following yesterday’s move into the 3305 retracement range, we got the expected reaction without an EMA5 lock, which further confirmed the rejection from that level and led to a clean bounce into 3228 just like we analysed.
From here, we anticipate price to range between 3328 and 3305. EMA5 cross and lock above 3328 or below 3305 will be key to confirming the next directional move.
We’ll continue to monitor for that confirmation and adjust accordingly.
We will keep the above in mind when taking buys from dips. Our updated levels and weighted levels will allow us to track the movement down and then catch bounces up.
We will continue to buy dips using our support levels taking 20 to 40 pips. As stated before each of our level structures give 20 to 40 pip bounces, which is enough for a nice entry and exit. If you back test the levels we shared every week for the past 24 months, you can see how effectively they were used to trade with or against short/mid term swings and trends.
The swing range give bigger bounces then our weighted levels that's the difference between weighted levels and swing ranges.
BULLISH TARGET
3348
EMA5 CROSS AND LOCK ABOVE 3348 WILL OPEN THE FOLLOWING BULLISH TARGETS
3369
EMA5 CROSS AND LOCK ABOVE 3369 WILL OPEN THE FOLLOWING BULLISH TARGET
3397
EMA5 CROSS AND LOCK ABOVE 3397 WILL OPEN THE FOLLOWING BULLISH TARGET
3422
BEARISH TARGETS
3328 - DONE
EMA5 CROSS AND LOCK BELOW 3328 WILL OPEN THE FOLLOWING BEARISH TARGET
3305 - DONE
EMA5 CROSS AND LOCK BELOW 3305 WILL OPEN THE SWING RANGE
3289
3267
As always, we will keep you all updated with regular updates throughout the week and how we manage the active ideas and setups. Thank you all for your likes, comments and follows, we really appreciate it!
Mr Gold
GoldViewFX