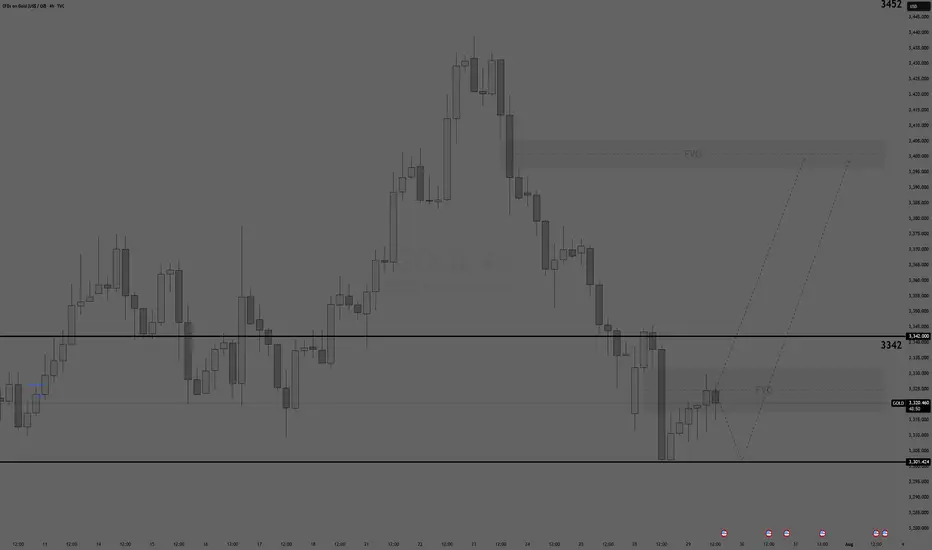
Gold Market Outlook – 1H ChartGold (XAU/USD) continues to show bearish momentum with lower highs and consistent structural breakdowns. Price is currently consolidating just above a key support zone (~3315), forming a descending triangle pattern — often a bearish continuation signal.
If the support breaks, the next liquidity zones lie around 3270–3250, with a deeper target near 3225, as highlighted by the green demand areas. Fundamental catalysts ahead (as shown by US economic events) could act as triggers.
Futures market

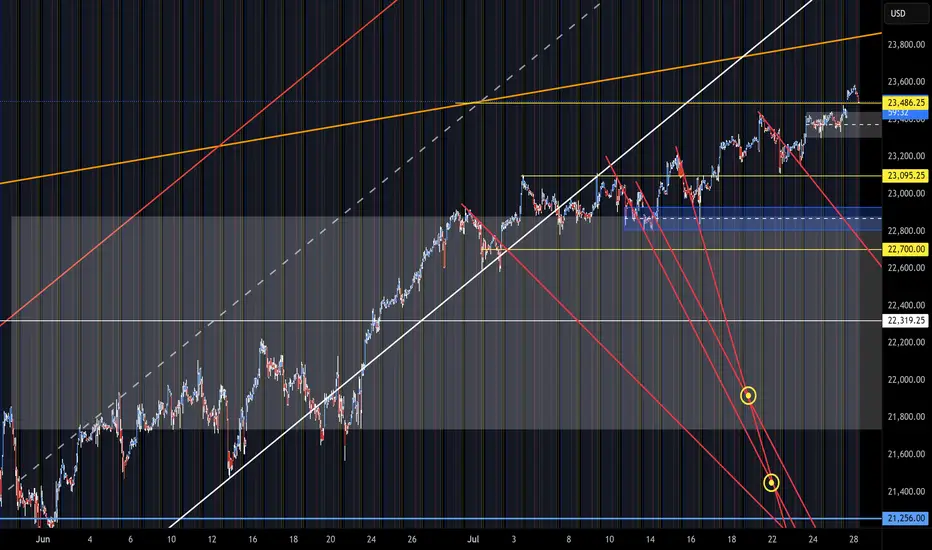
NQ Short (07-28-25)The F-M Long Rig is active with a Gap Up and Pump/Dump play. Just notice KL 486 and how/when the NAZ gets above. In O/N, the Reg Session and previous hits at 23,440 got rejected and is why you are seeing the move in the off session. The BTD/FOMO chase is active, Pump/Dump near Open today for next move.
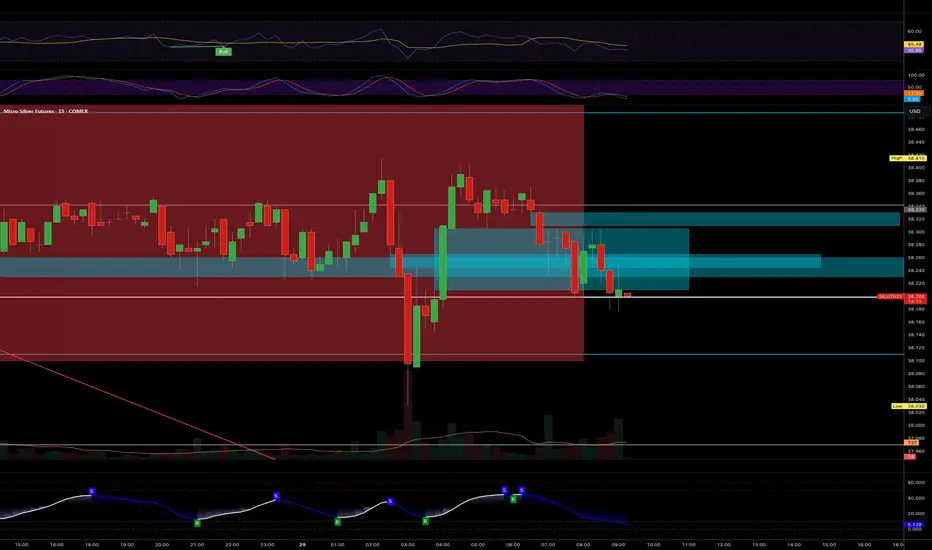
Silver market's ambiguityFollowing up my last idea - you can see short term time frame (15m) shows alot of ambiguity in the direction it wants to go... Again, just watching for now - but a breakdown could mean low $37s briefly, imo.
Is Gold having Correction before dumping?It's a pretty hot topic at the moment where the Gold is moving toward and what it will eventually become... Side way wedge like this. what do you think?

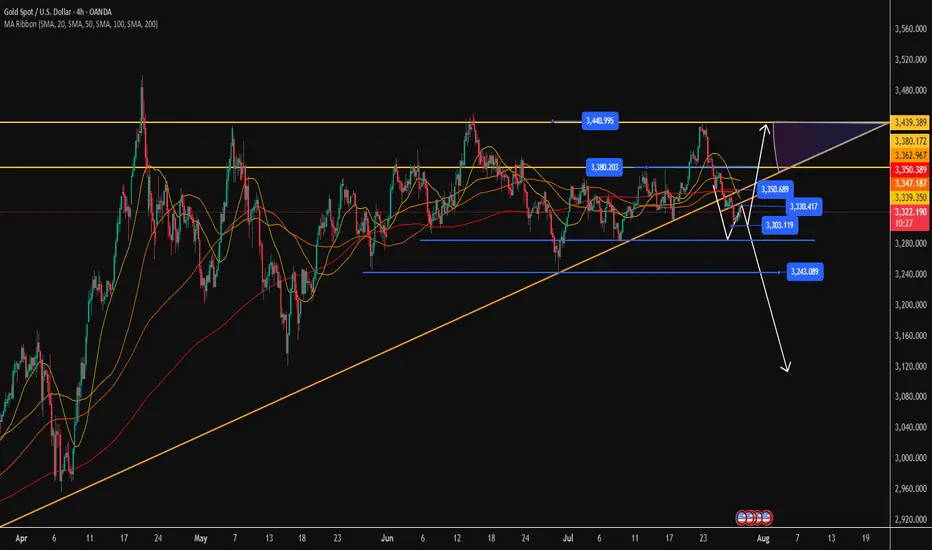
GOLD: Time for massive drop? +3000 pips move! Gold has failed to breakthrough the previous resistance indicating a strong sellers hold around $3440 region. Now since the price has stared dropping we can see it dropping around $2800 in long term. In order for this to happen we need strong confirmation, which will help us understand the possible volume.
Agree with our idea?
Like and comment!

XAUUSDDaily still on a uptrend.
Major player are on vacations ...
H4 its on a consolidation
Advice: Wait

POC Pressure Cooker – MES Prepares for VolatilityWe’re heading into the NY session with MES balancing between key levels. The 50% retracement of the recent range (6436) is acting as a pivot, while the POC at 6428 is the immediate area of interest. The structure is tight here’s both sides of the play:
Key Levels to Watch:
- Upper Range: 6457–6460 (recent swing high)
- Mid-Range Pivot: 6436 (Fib 50%)
- POC & Support Zone: 6428 (volume shelf)
- Lower Range: 6415 → 6400
🟩 Bullish Scenario
A breakout and hold above 6440–6445 could lead to a retest of 6457–6460, with potential continuation to 6470+ if momentum accelerates.
- Confluence: Higher low structure above 6428, EMAs curling up, and price reacting positively to POC.
- Invalidation: Clean break and close below 6428.
🟥 Bearish Scenario
A failure to hold 6430 and a push through 6428 (POC) could see sellers target 6415, then possibly 6400.
- Confluence: Descending red trend line still capping price, and VWAP rejections could support a downside move.
- Invalidation: Break above 6457 with strong buyer aggression.
Staakd Notes:
This is a range-play environment. The real edge is in waiting for a break + retest of 6440 or 6428 to confirm direction. NY open volatility is likely to provide a fake out before the true move. Give it 30 mins from open.
Closing Line:
“Price is coiled between POC and the 50% mark. We’ll let NY open show its hand then react, not predict.”

gold in retracement gold in retracement and will find a strong resistance to continue its downtrend there after.

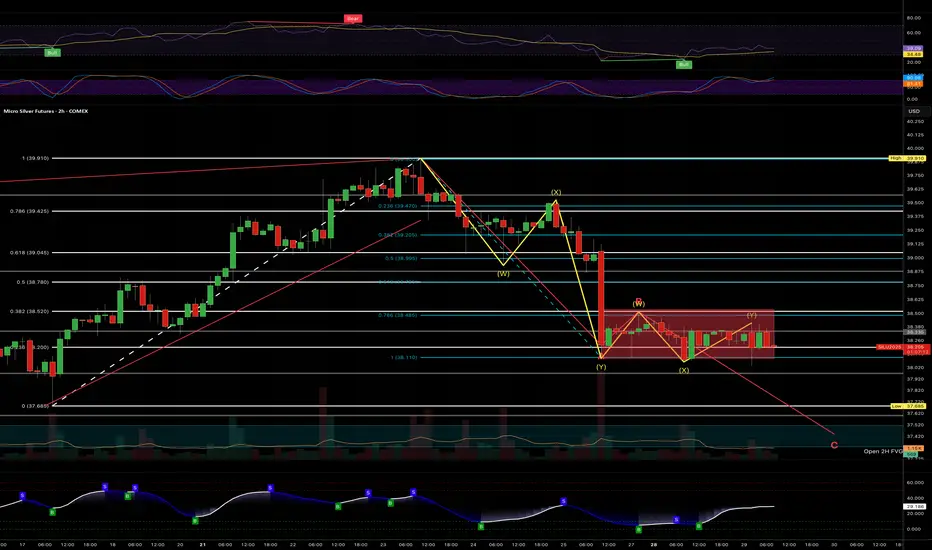
Silver - failure to break highs yesterday...This week is news packed... I was hoping to see Silver break above recently lower highs.
I am out of all positions - but I would not be surprised to see further breakdown in a second corrective leg, finding support at the FVG above next fib retracement.
Like I said, though, this week has alot of material news - so its all games... Will have to watch price action to make a determination of which direction I'll play.
I am very bullish on Silver over next 12 months - but next 12 days??? We'll see.
Today's Gold Price: Short at HighsToday's Gold Price: Short at Highs
As shown in the chart:
Rebound Short Strategy
Resistance: 3330-3350
Support: 3310
Technical Analysis:
1: As long as the gold price is below 3330, the market is bearish.
2: As long as the gold price is below 3350, the market is short.
3: As long as the gold price is above 3300, the long position is to buy on dips.
Specific Strategy:
Aggressive Strategy:
Sell: 3325-3330
Stop Loss: 3335
Target Price: 3310
Conservative Strategy:
Sell: 3340-3350
Stop Loss: 3355
Target Price: 3330-3310
Bottom Picking Strategy:
Buy: 3300-3310
Stop Loss: 3290
Target Price: 3350+/3400+
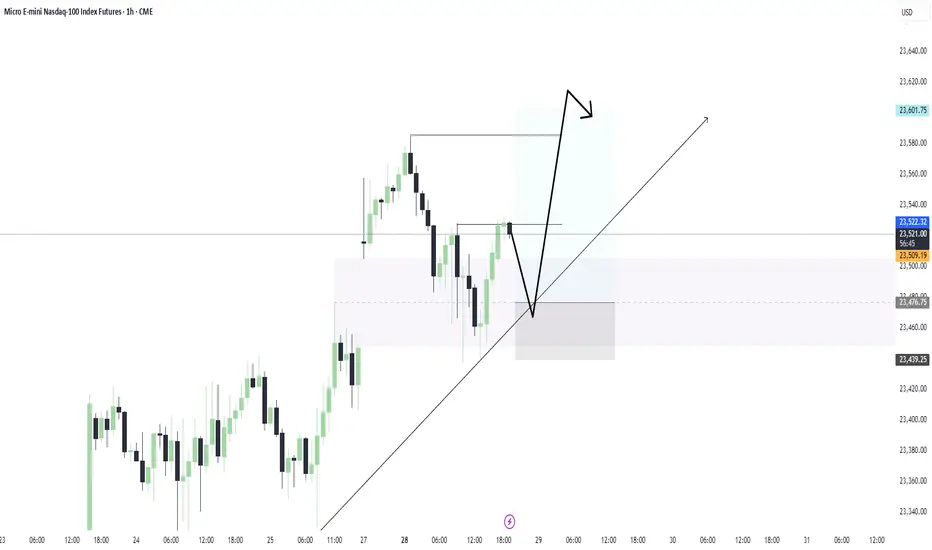
Tuesday Long Trade for the NASDAQ 7/29I'm feeling ultra bullish on NQ right now. Ideally, I want to see price carve out an inverse head and shoulders or a double bottom—either could serve as a springboard to new highs. I took two longs this morning and captured solid gains off the weekly opening gap. Would love to see one final wick into that zone before we blast off.
Long Entry:23,476.75
Target: Break of the Highs | Trailing SL
Today's trades:
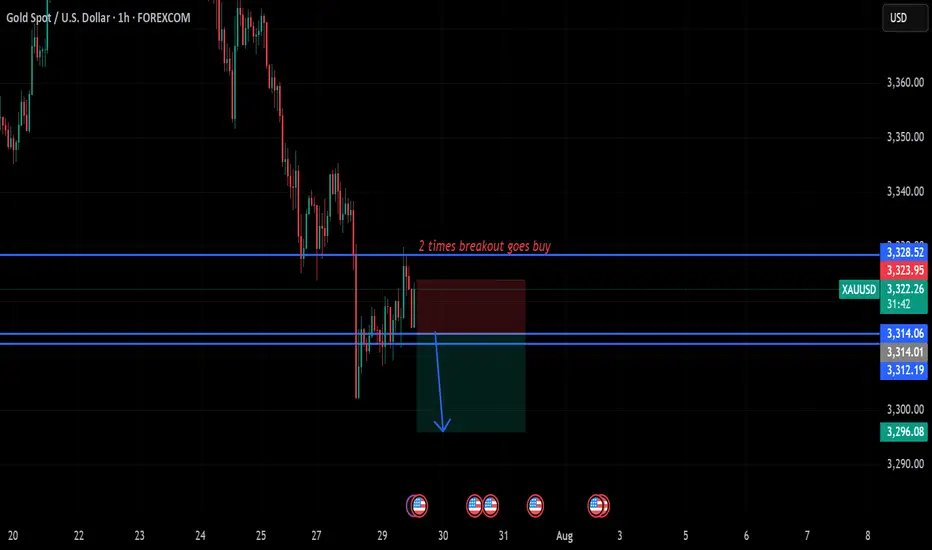
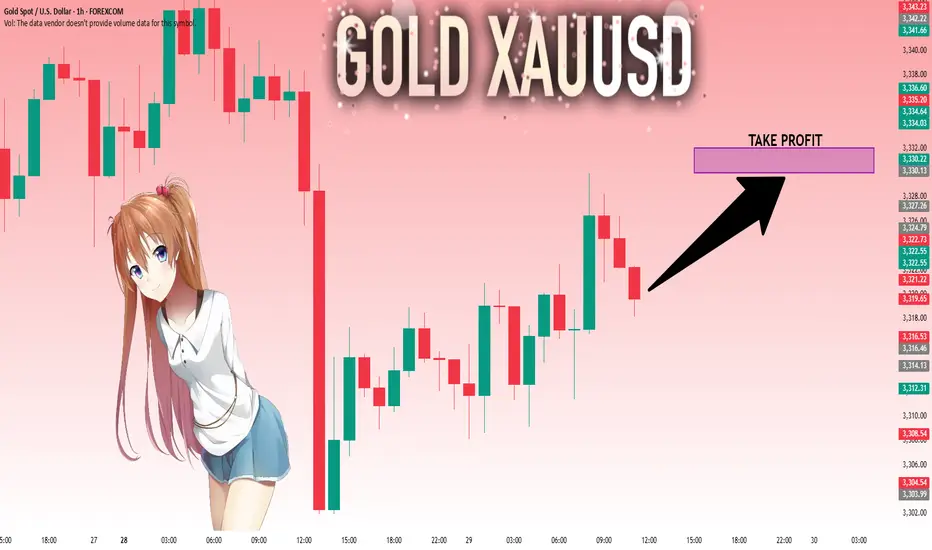
gold on sideways#XAUUSD price await double breakout above 3328.6 for bullish to take place. But now we await for any breakout to take trade.
Below 3314 holds sell continuation, target 3296, stop loss 3324.
Above 3328.6 on 2 times breakout will start bullish till 3340.
29 july 2025Possible short on ES. NY took out the previous day's high while ES did not, thus forming an SMT. There is a 4 hour poor low from the previous week's wednesday and relative equal lows on friday.
As we are approaching the end of the month there could very well be a sell off to put in the month's wick before continuing higher next week.

XAUAUSD ideaWe are waiting for our asset to reach our action zone, and based on the reaction, we’ll decide on our next moves.ALWAYS WAIT FOR A CONFIRMATION TO SEE IF THE PRICE VALIDATES THE ZONE.and you what is your vision of the EURUSD its interests me! i wait you in the commentary

Gold Break of channel resistance next target is 3360-3375Gold was trending in down trend but now it has broken the resistance and is likely to go up.

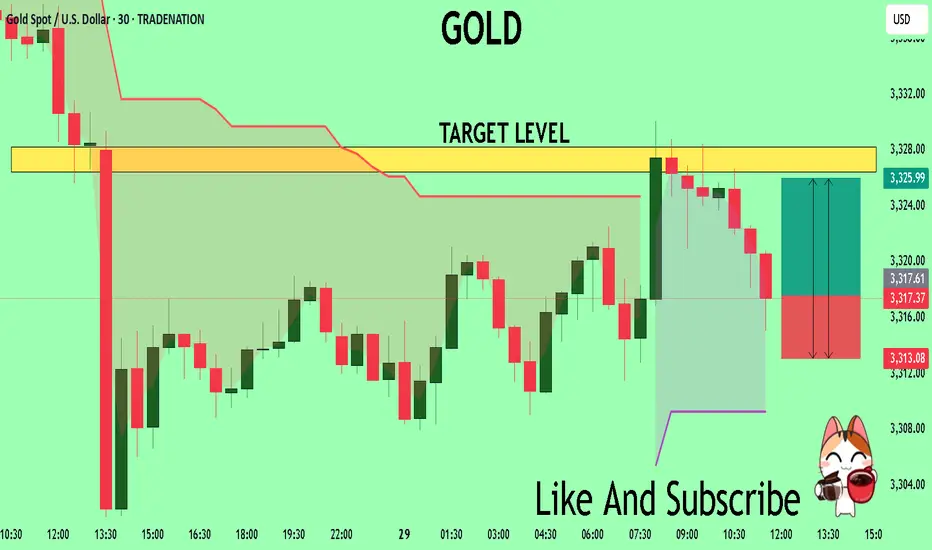
GOLD The Target Is UP! BUY!
My dear subscribers,
This is my opinion on the GOLD next move:
The instrument tests an important psychological level 3317.7
Bias - Bullish
Technical Indicators: Supper Trend gives a precise Bullish signal, while Pivot Point HL predicts price changes and potential reversals in the market.
Target - 3326.4
My Stop Loss - 3313.0
About Used Indicators:
On the subsequent day, trading above the pivot point is thought to indicate ongoing bullish sentiment, while trading below the pivot point indicates bearish sentiment.
Disclosure: I am part of Trade Nation's Influencer program and receive a monthly fee for using their TradingView charts in my analysis.
———————————
WISH YOU ALL LUCK
GOLD trades in narrow range after 4 sessions of sharp declineOn Tuesday (July 29), in the Asian market, the spot OANDA:XAUUSD traded in a narrow range after yesterday's sharp decline, and the current gold price is around 3,315 USD/ounce.
The OANDA:XAUUSD fell to its lowest level in nearly 3 weeks on Monday, mainly due to the trade agreement reached between the United States and the European Union over the weekend, which boosted the Dollar and risk sentiment.
The previous report released by the US Bureau of Labor Statistics showed that the number of US JOLTS jobs unexpectedly increased in May, reaching the highest level since November last year.
The number of JOLTS job vacancies in the US in May was 7.769 million, far exceeding the forecast of all economists surveyed.
Looking back at the data in April, the number of JOLTS job vacancies also showed an unexpected increase.
The JOLTS jobs report is a closely watched labor market data by the Federal Reserve.
In addition, the Conference Board of America's Consumer Confidence Index for July is scheduled to be released on the same day and is expected to be 95.8, compared to the previous value of 93.0.
The fundamental pressure that gold is under
OANDA:XAUUSD came under pressure yesterday and fell to a near three-week low, mainly due to the trade deal between the United States and the European Union (EU) over the weekend, which boosted the Dollar and risk sentiment. Moreover, US President Trump announced “global tariffs” of 15% to 20% on most countries, a change from his previous statement last week.
The deal reached by U.S. President Donald Trump and the European Union late last week will impose a 15% tariff on EU goods, half the rate Trump had threatened, easing fears of a wider trade war.
The U.S. and Japan also reached a deal last week, and U.S. and Chinese officials resumed talks in Stockholm, Sweden, this week with the goal of extending the tariff deadline by 90 days.
Technical Outlook Analysis OANDA:XAUUSD
Gold has been on a four-day losing streak, a decline that threatens bullish expectations as its current position gradually deprives it of any room for further upside.
Specifically, gold has recovered from the psychological level of $3,300 but the actual recovery is not significant, while it is under pressure from the EMA21 which is currently the closest resistance.
On the other hand, gold has fallen below both the long-term and short-term trend channels. If it continues to sell below the 0.382% Fibonacci retracement level, this will confirm a break below the psychological level of $3,300, then the downside target will be around $3,246 in the short term, rather than $3,228.
RSI is pointing down, below 50 and still far from the 20-0 area, also showing that in terms of momentum, gold is also under pressure and there is still a lot of room for decline ahead.
For gold to be eligible for an increase, it needs to at least bring price activity back above the EMA21, back inside the price channels. On the current daily chart, the technical conditions are more inclined towards the possibility of a decrease.
Notable positions will be listed as follows.
Support: 3,310 - 3,300 - 3,292 USD
Resistance: 3,340 - 3,350 - 3,371 USD
SELL XAUUSD PRICE 3355 - 3353⚡️
↠↠ Stop Loss 3359
→Take Profit 1 3347
↨
→Take Profit 2 3341
BUY XAUUSD PRICE 3285 - 3287⚡️
↠↠ Stop Loss 3281
→Take Profit 1 3293
↨
→Take Profit 2 3299

NQ & ES Key Levels 29-07-2025These are the most sensitive points today and only these two scenarios can exist. Take advantage of these key levels for short term trades, scalps or swing trades

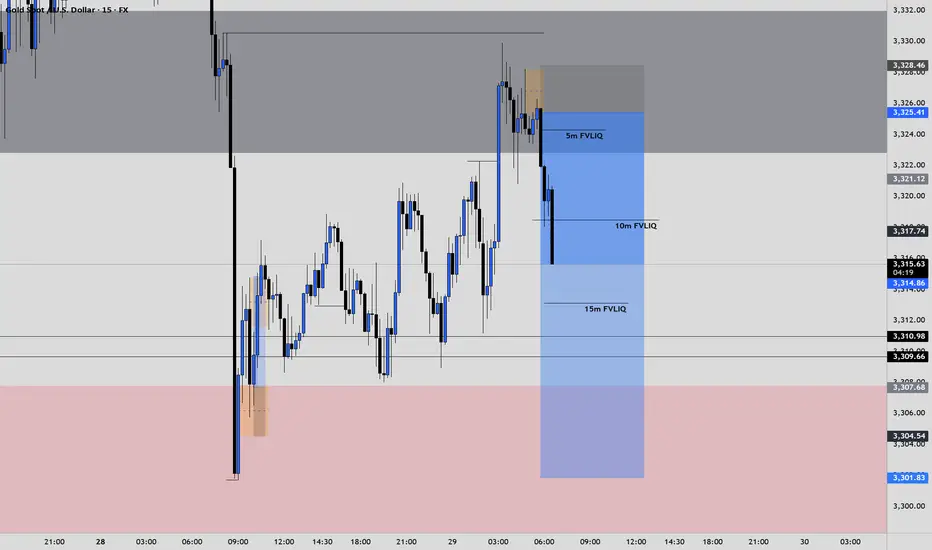
XAUUSD ShortElite Analysis
Noticed price came to structural liquidity
Obtain confirmations to short
Executed from 3m OB
Targeting Lower liquidity pools, main target London low
GOLD: Strong Growth Ahead! Long!
My dear friends,
Today we will analyse GOLD together☺️
The market is at an inflection zone and price has now reached an area around 3,321.22 where previous reversals or breakouts have occurred.And a price reaction that we are seeing on multiple timeframes here could signal the next move up so we can enter on confirmation, and target the next key level of 3,329.97.Stop-loss is recommended beyond the inflection zone.
❤️Sending you lots of Love and Hugs❤️
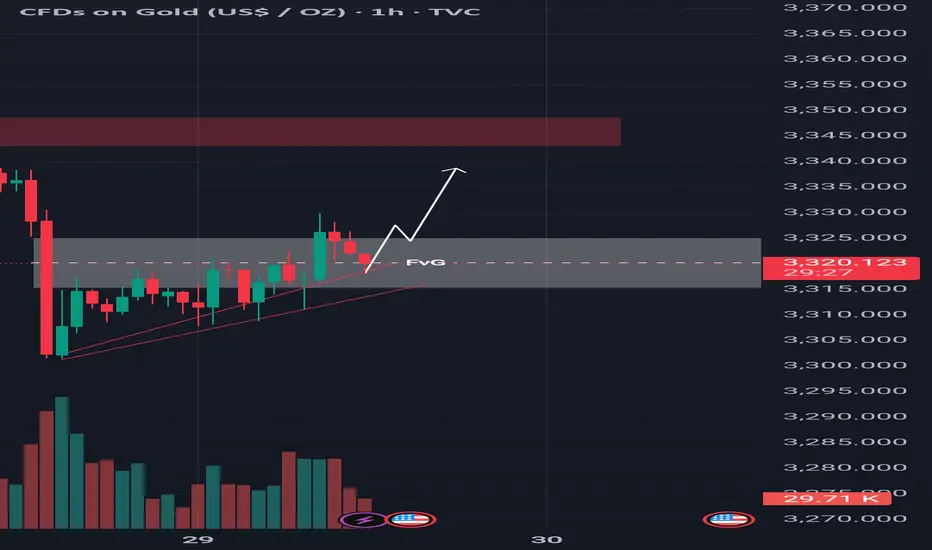
Technical Shift FVG Break and Retest Hints at Further Upside!Gold is currently showing strength after taking support from the trendline, indicating buyers are stepping in around that level. Moreover the price has successfully broken above the 4-hour bearish Fair Value Gap (FVG), which suggests a shift in market sentiment. This FVG zone has now transitioned into an inversion level meaning what was once a resistance area could now act as support. At the moment, the market is pulling back, likely to retest this newly flipped zone. If buyers defend this area on the retest, it could provide the base for a potential bullish continuation. From this zone, we may witness a strong upward move, with the next target likely being the liquidity resting above key resistance levels. As always, it’s important to conduct your own analysis and manage risk accordingly (DYOR).
GOLD / XAUUSD TodaySSM Struckture is bearish
I have two scenario to sell setup
Now I open first if hit Sl and still rules to entry I will open next one
