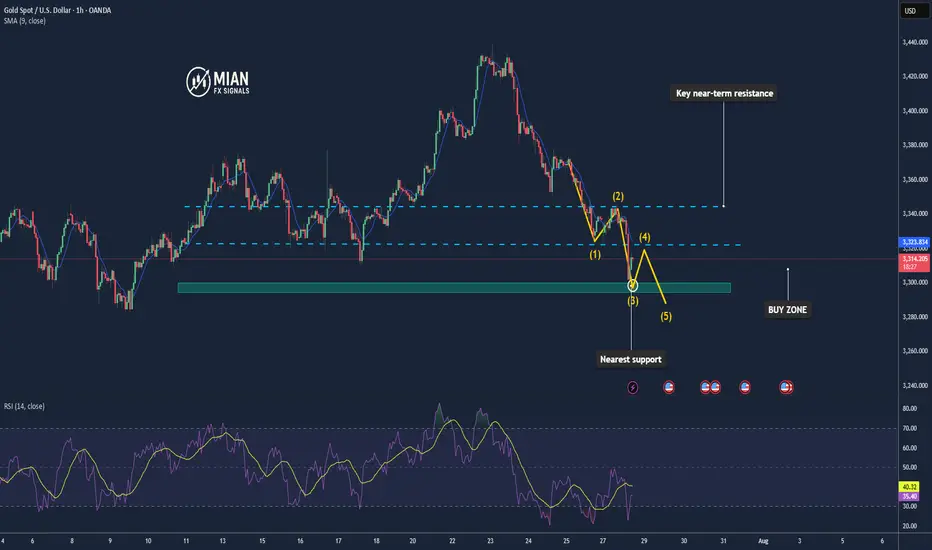
XAUUSD under pressure – Is the downtrend just beginning?Hello everyone! What do you think about XAUUSD right now?
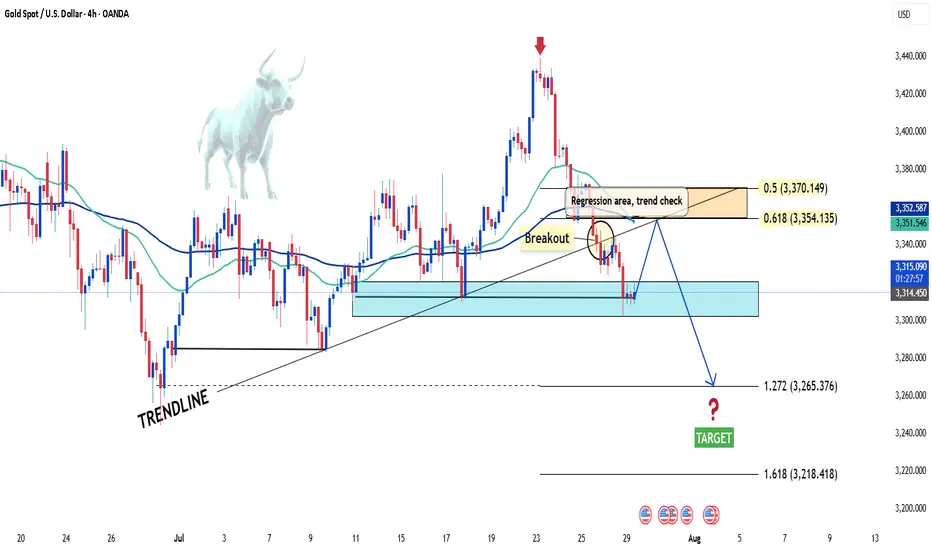
Yesterday, XAUUSD extended its decline and is currently trading around 3,315 USD.
The recent drop in gold prices was mainly triggered by a stronger US dollar, following a trade agreement between the US and the European Union (EU).
From a technical perspective, the short-term outlook shows the beginning of a new downtrend. Notably, we see a bearish crossover in the EMA 34 and 89, along with a break of the previous upward trendline—both reinforcing the current bearish momentum.
If there’s a pullback before the next leg down, the 0.5–0.618 Fibonacci retracement zone (which also aligns with resistance and the EMAs) will be a key area to watch. This could be an ideal level for potential trade setups.
Looking ahead, the next support target is around 3,300 USD. If that level breaks, gold might aim for the 32XX region.
Do you think XAUUSD will continue to fall? Drop your thoughts in the comments!
Wishing you successful and profitable trades!
Futures market
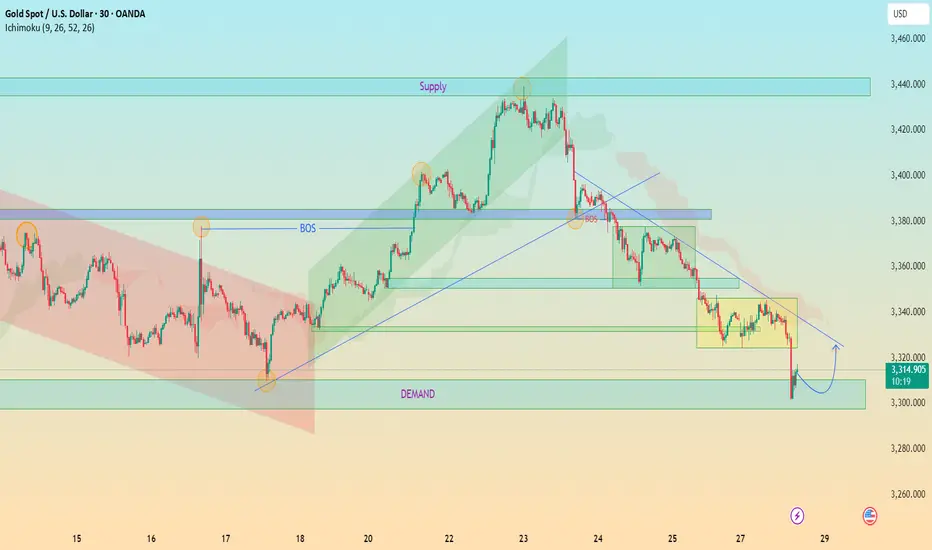
XAUUSD: Demand Rejection or Breakdown? All Eyes on 3,300 ZoneChart Analysis Breakdown (30m TF – Gold/USD)
1. Market Structure Overview
Bearish Trend Dominance:
The price has shifted into a bearish structure after a Break of Structure (BOS) to the downside, indicating bearish control after failing to sustain higher highs.
Lower Highs & Lower Lows:
A consistent formation of LHs and LLs confirms bearish momentum.
2. Key Zones & Reactions
🟩 Demand Zone (~3,300–3,310):
Current price is reacting from a clearly defined demand zone.
Strong buying wick indicates interest and potential short-term bounce.
This zone has historical significance — previous reversal point.
🟥 Supply Zone (~3,420–3,445):
Price reversed sharply from here.
This is a key liquidity zone; expect heavy resistance if price retraces.
🔵 BOS Areas Marked:
Confirmed transitions in structure:
Bullish BOS followed by a bearish BOS — great illustration of shift in control.
🟨 Consolidation Blocks:
Highlighted ranging periods show distribution/accumulation phases before breakouts.
3. Trendlines & Channel Patterns
📉 Descending Trendline:
Acts as dynamic resistance.
If price retraces to this level (around 3,330–3,340), expect potential rejection unless broken cleanly.
📈 Previous Bullish Channel (Broken):
Price moved out of a bullish ascending channel, confirming bearish intent.
4. Ichimoku Cloud Context
Price is below the Kumo cloud, suggesting bearish bias remains intact.
Future cloud is bearish.
However, short-term pullback into cloud possible (especially if demand zone holds).
📊 Forecast & Trade Idea
Scenario 1: Bullish Rejection from Demand
Price may bounce towards 3,340 (previous S/R + trendline retest).
Watch for reaction at this level.
Scenario 2: Clean Break of Demand Zone
Opens path toward deeper downside (e.g., 3,280 or even lower).
Could trigger liquidity grab before reversal.
GOLD: Bottoming Out or Just the Calm Before the Storm? – GOLD: Bottoming Out or Just the Calm Before the Storm?
Gold has dropped nearly $50 over the last 4 sessions, showing clear bearish momentum. But is this just a liquidity grab before a reversal — or are we simply pausing before another leg down?
🔍 Market Context:
Recent US–EU defence and trade agreements may have weakened gold’s short-term appeal as a safe haven.
The US dollar and equities have both gained on strong macroeconomic data, redirecting capital flows away from metals.
Overall market sentiment has tilted risk-on, putting additional pressure on gold prices.
📊 Technical Overview (12H Chart):
Price has broken below the 3342 key support zone and rejected the retest — turning it into short-term resistance.
Current range sits between:
Sell-side liquidity zone: 3301–3292
Major demand/FVG zone: 3272–3270
Above price:
Resistance at 3342, and a broader sell zone at 3370–3388 (OB + FVG + Fib 0.5–0.618)
🔧 Trade Plan (Reaction-Based — Not Predictive):
🟢 Scenario 1 – Buy (Scalp Reaction)
Entry: 3292 – 3290
Stop Loss: 3285
Targets: 3296 → 3300 → 3305 → 3310 → 3315 → 3320 → 3325 → 3330
📍 Intraday bounce play from a high-liquidity zone
🟢 Scenario 2 – Buy (Deeper Reversal Swing)
Entry: 3272 – 3270
Stop Loss: 3265
Targets: 3276 → 3280 → 3284 → 3288 → 3292 → 3294 → 3300 → Trail
📍 Potential mid-term bottom setup if liquidity is fully swept
🔴 Scenario 3 – Sell (Short-Term Rejection)
Entry: 3340 – 3342
Stop Loss: 3346
Targets: 3335 → 3330 → 3325 → 3320 → 3310
📍 Clean rejection setup if price fails to reclaim key resistance
🔴 Scenario 4 – Sell (Higher Supply Zone)
Entry: 3370 – 3372
Stop Loss: 3376
Targets: 3365 → 3360 → 3355 → 3350 → 3345 → 3340 → 3330 → 3320
⚠️ Higher risk; only valid with strong confirmation
⚠️ Risk Notes:
Be mindful of fakeouts around London and NY opens, as liquidity sweeps are common.
Wait for price to enter your zone, then react — don’t anticipate.
Strict risk management is key in a volatile environment like this.
🧭 I’ll continue monitoring how price reacts around these zones.
If this kind of structured planning resonates with your approach,
feel free to stay connected — or share your perspective in the comments.

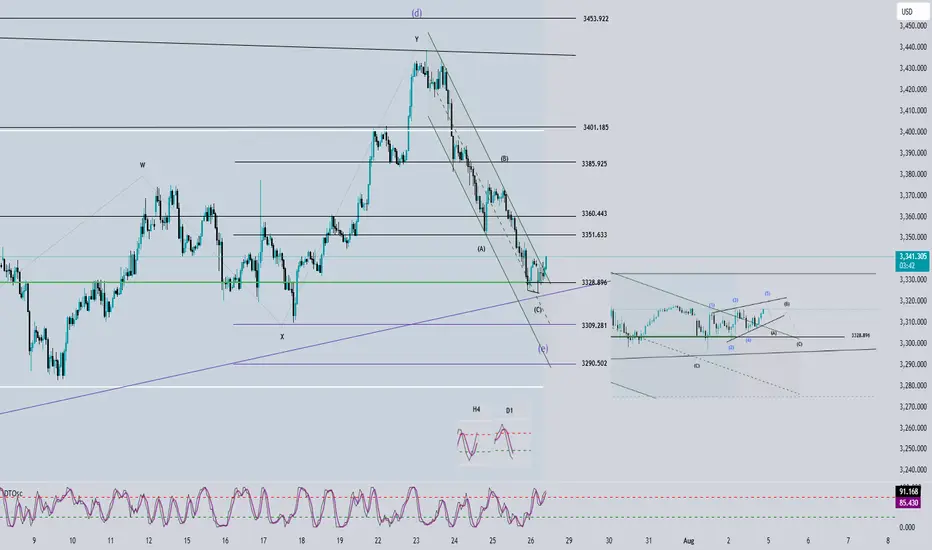
Elliott Wave Analysis – XAUUSD – July 28, 2025📊
________________________________________
🔍 Momentum Analysis:
• D1 Timeframe: Momentum has entered the oversold zone. This strongly suggests a potential bullish reversal today, which could lead to a rally or sideways movement lasting around 4–5 days.
• H4 Timeframe: Momentum is reversing upward. This indicates a likely bullish or sideways move in the short term, at least until momentum reaches the overbought zone (estimated within the next 2 H4 candles).
• H1 Timeframe: Momentum is currently overbought, so we may first see a pullback or sideways movement until a clearer reversal signal appears.
________________________________________
🌀 Wave Structure Analysis:
• On the H4 chart, as noted in previous plans, the assumption that price is forming a contracting triangle (abcde) is still valid. Price is currently in the final leg (wave e) of this triangle.
• On the H1 chart, we can observe a channel structure, within which an abc corrective pattern is unfolding.
• The lower boundary of the triangle (marked by the green trendline) combined with support zones will be critical areas to monitor for the end of wave e.
🔺 Note: Wave e does not necessarily end precisely at the triangle boundary – it can slightly overshoot. Hence, we’ll rely on smaller wave structures to identify potential reversal zones.
________________________________________
🎯 Key Price Zones to Watch:
• Target 1: 3329
• Target 2: 3309
• Target 3: 3290
________________________________________
🔎 Lower Timeframe Structure (M10):
From the current price action (as shown in the chart), we can see a leading diagonal triangle structure forming. This is a pattern commonly seen in wave 1. If this pattern is confirmed, a sharp and steep decline toward the 3329 zone is likely.
________________________________________
⚖️ Combining Momentum & Wave Structure:
• D1: Signals a potential reversal → favors Buy setups.
• H4: Momentum is rising, but price hasn’t confirmed a new bullish trend → need to stay alert and tighten Stop Loss.
• H1: Overbought + possible leading diagonal → Expecting a pullback for wave 2 toward 3329 → this would be the optimal Buy zone.
________________________________________
🧭 Trade Plan:
• For experienced traders:
→ Wait for price to reach key levels and watch for reversal signals before entering.
• For beginners:
→ Use the following Limit Buy setup:
✅ Setup 1:
• Buy zone: 3330 – 3328
• Stop Loss: 3320
• TP1: 3351
• TP2: 3370
• TP3: 3385
✅ Setup 2:
• Buy zone: 3310 – 3308
• Stop Loss: 3300
• TP1: 3328
• TP2: 3351
• TP3: 3370
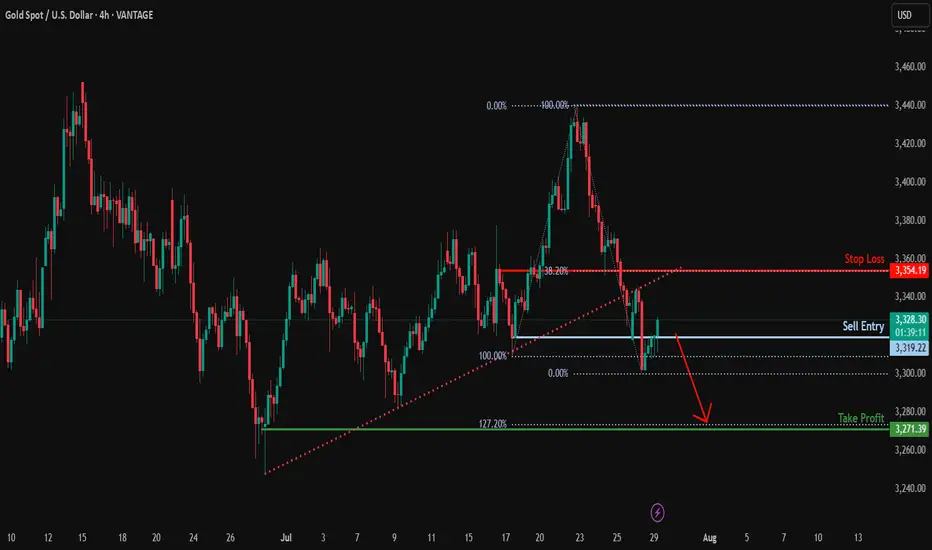
XAUUSD-Bearish reversal?XAU/USD is rising towards the resistance level, which serves as a pullback resistance and could drop from this level to our take-profit target.
Entry: 3,319.22
Why we like it:
There is a pullback resistance.
Stop loss: 3,354.19
Why we like it:
There is a pullback resistance that aligns with the 38.2% Fibonacci retracement.
Take profit: 3,271.39
Why we like it:
There is a swing low support that lines up with the 127.2% Fibonacci extension.
XAUUSD - BUY to SELL CONT.DI'm in on the BUY, waiting patiently to take the SELL only with confirmation
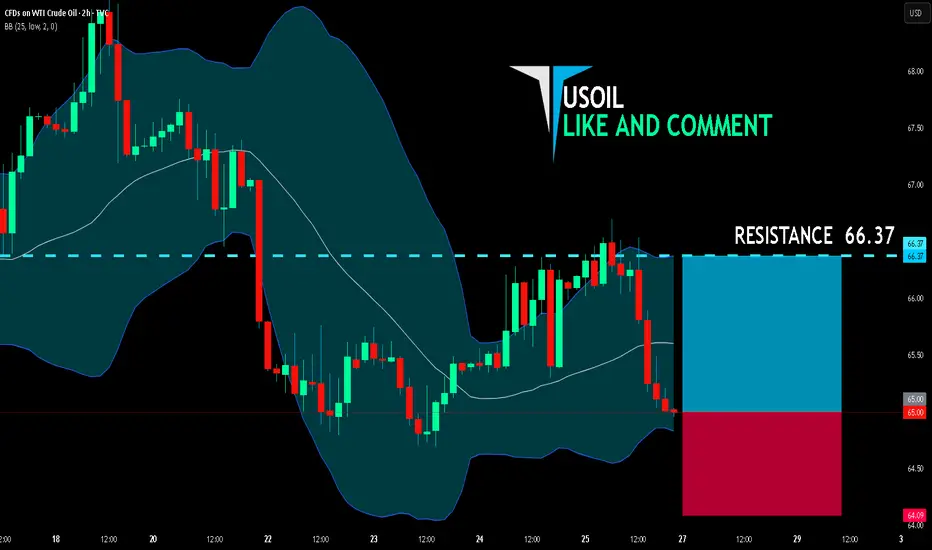
USOIL LONG FROM SUPPORT
USOIL SIGNAL
Trade Direction: long
Entry Level: 65.00
Target Level: 66.37
Stop Loss: 64.09
RISK PROFILE
Risk level: medium
Suggested risk: 1%
Timeframe: 2h
Disclosure: I am part of Trade Nation's Influencer program and receive a monthly fee for using their TradingView charts in my analysis.
✅LIKE AND COMMENT MY IDEAS✅
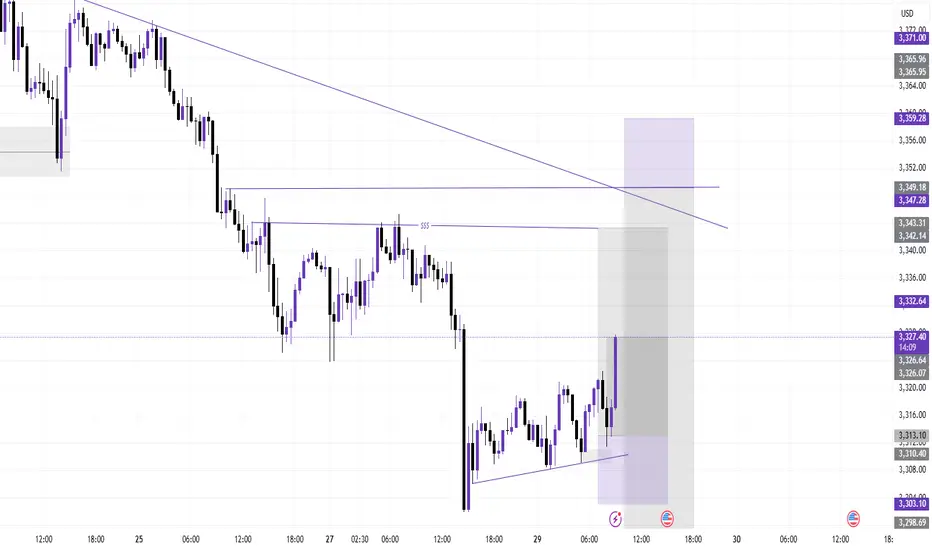
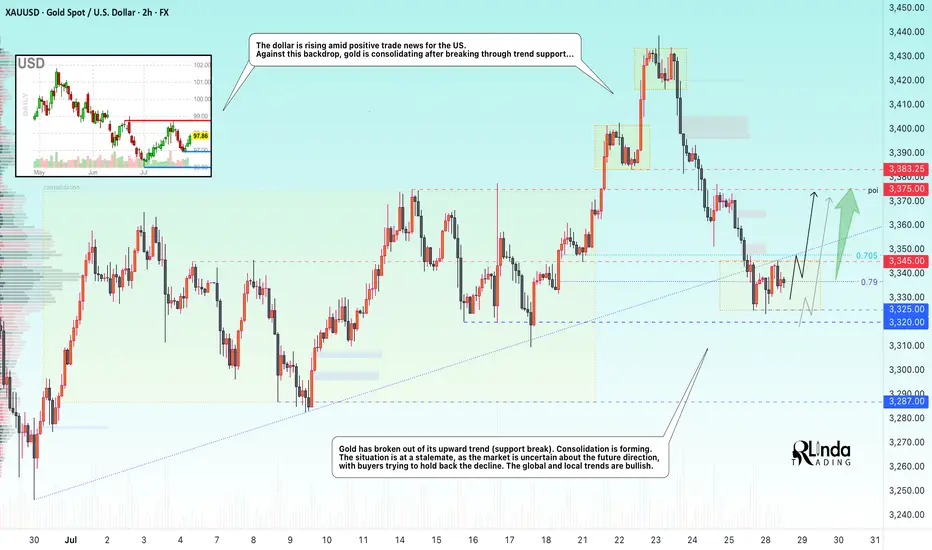
GOLD → Retest of trend support. Consolidation...GOLD is consolidating below the previously broken trend support. On Sunday, Trump announced a trade deal with the EU, which is putting pressure on the market along with the rising dollar...
Gold rebounded from support at $3310 after a week-long low, interrupting a three-day decline amid profit-taking. However, the overall downtrend remains intact as markets brace for a busy week with the release of US GDP data and the Fed's decision. Optimism surrounding US-China trade talks and the US-EU framework agreement is reducing demand for safe-haven assets. Additional pressure on gold is coming from easing geopolitical tensions: Thailand and Cambodia have agreed to ceasefire talks. The metal's recovery may be short-lived.
Technically, we have global and local bullish trends, against which gold is testing support, but as we can see, buyers are trying to hold back the decline due to uncertainty over interest rates. There is a chance that we will see active action by the Fed, behind which lies a rate cut, this week...
Resistance levels: 3345, 3375
Support levels: 3320, 3287
At the moment, I do not see a proper reaction to the support breakout. The price is consolidating after confirming the key trigger at 3345. Thus, if the price starts to return to 3345, test and consolidate above the level, we will have a chance for growth. I do not rule out a liquidity grab from 3325 (false breakout) before the rise.
BUT! The structure will be broken if the price breaks 3325 - 3320 and begins to consolidate below this zone. In this case, gold may fall to 3287
Best regards, R. Linda!
XAUUSD after correction or pullback will fall again 3280GOLD had broken the resistance and fell down recently and is currently in a correction or pullback and is likely go down again in the support area of 3280-3285
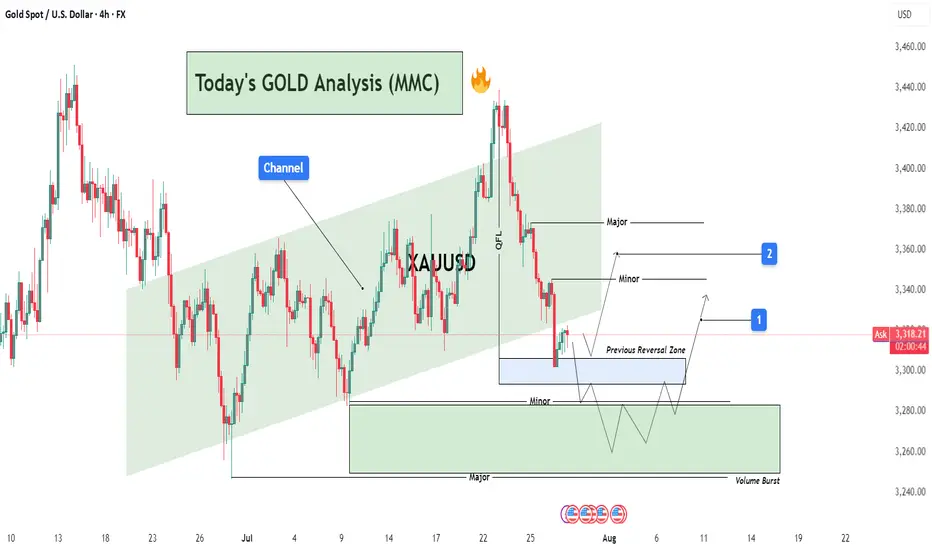
GOLD Analysis : XAUUSD Major Bullish Demand Zone🧠 Market Structure Context (MMC Framework)
Gold has recently shown a clean structural decline from its local highs within a well-defined ascending channel. This analysis highlights a reaction zone-based playbook, focusing on high-probability reversal scenarios guided by institutional footprints, volume reaction points, and MMC logic.
We’re currently trading near a previous reversal zone, where history tells us the market tends to shift behavior. Let’s dissect the key components.
📊 Key Technical Components
🔸 1. Ascending Channel Breakdown
The entire uptrend was respecting a well-established bullish channel until the recent drop violated the midline structure. This breakdown confirms a temporary bearish phase, with price breaking cleanly below a QFL base (Quick Flip Level)—a level where price reversed sharply before, which now acts as a major supply zone.
Psychological Insight: Channels give clues about momentum. Breaking below the lower band shows the market is preparing for a retest or a deeper liquidity hunt.
QFL Breakdown: Once broken, previous buyer confidence is shaken—inviting sellers to test demand zones.
🔸 2. Previous Reversal Zone (PRZ) Reaction
Currently, price is hovering inside the blue shaded Previous Reversal Zone, where bullish pressure previously kicked in. It’s a minor demand zone, but critical due to historical reaction. The projected structure shows a bounce from this area before deciding next direction.
MMC Insight: The first test of PRZ often leads to an initial reaction. But deeper liquidity lies just below in the major green demand zone.
🔸 3. Major Demand Zone + Volume Burst Area (The Real Magnet)
Below the PRZ lies the major reversal block—highlighted in green. This zone is significant because:
It aligns with a high-volume burst in the past, confirming institutional orders.
It's a cleaner structure level for smart money re-entry.
It also provides room for the “liquidity sweep” (stop hunt), collecting sell stops before a proper reversal.
💡 Expected Play: Price may fake out below PRZ, enter the major demand, and then initiate a multiple-leg bullish rally. Patience is key here.
🛠️ Trade Structure Outlook
✅ Scenario 1 – Aggressive Buyers (Marked "1"):
Buy from the current PRZ zone around $3,305–$3,315
Target: $3,340 (Minor Resistance)
Risk: Slippage into deeper demand zone
Stop-loss: Below $3,295
✅ Scenario 2 – Safer Entry from Major Demand (Marked "2"):
Let price dip into $3,270–$3,280 zone (green box)
Look for reversal candles or liquidity sweeps on lower timeframes
TP1: $3,330
TP2: $3,365 (Major Resistance)
📈 Resistance Levels to Watch:
Minor Resistance: $3,340 – Expect short-term pullbacks or hesitation.
Major Resistance: $3,365 – Key target for swing traders and potential reversal zone.
🔍 MMC Concepts in Action
✅ Channel Logic: Breakdown implies momentum shift—watch for retests.
✅ QFL: Previous bounce zone broken = supply now overhead.
✅ Volume Burst Zone: Strong historical reaction = institutional interest.
✅ Zone-to-Zone Trading: Instead of random entries, focus on logical zone interactions.
🧭 Conclusion – Path of Probability
Gold is currently in a transitional phase—shifting from bearish correction to potential bullish revival. Patience will reward those who wait for PRZ rejections or deeper liquidity taps. The MMC framework helps frame this market not as chaos, but a map of strategic reaction points.
Silver Reload: Short-Term Pop or Just Noise?Our last Silver idea played out perfectly
Price wicked into support near 37.93 and bounced.
Short-term bias shifts bullish if we can reclaim 38.30, with next upside target around 38.51.
Still below the 200 MA, so we treat this as a corrective move, not a full trend shift (yet).

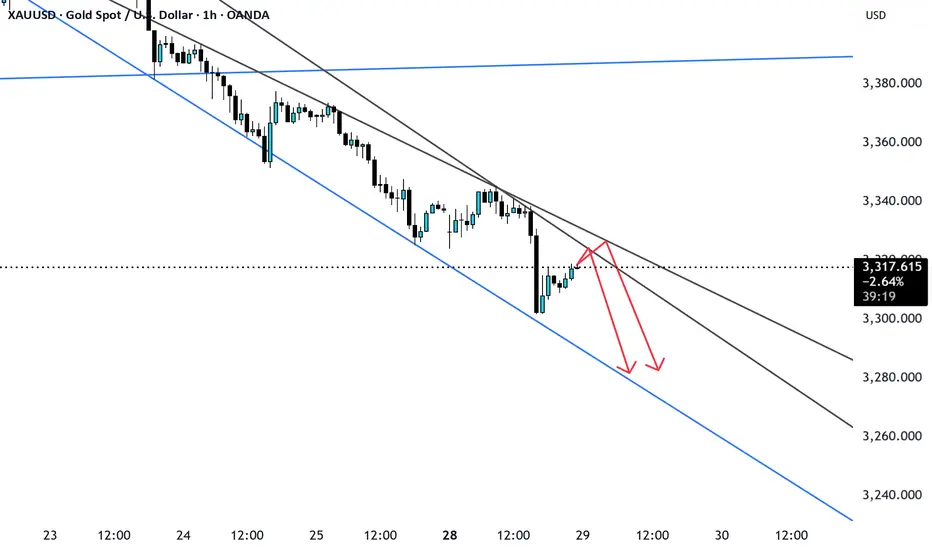
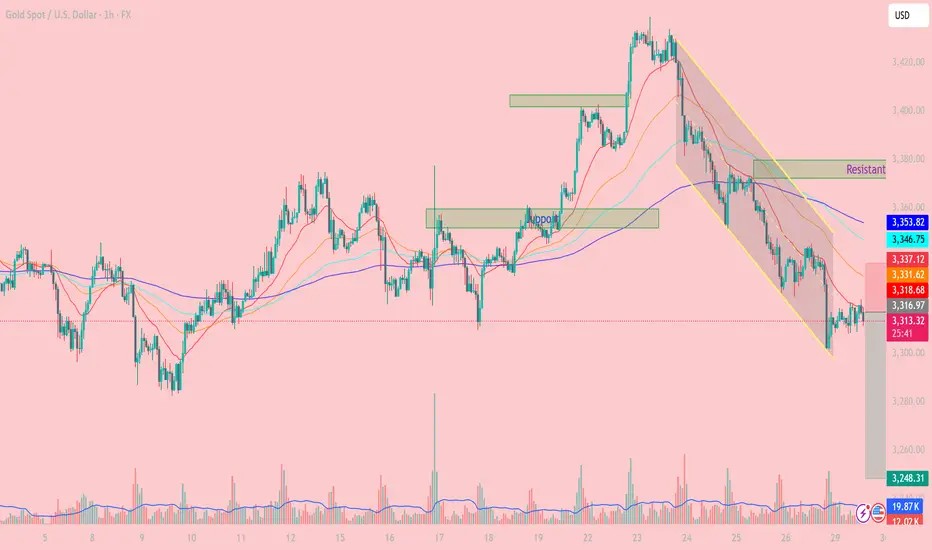
Downward Pressure Resumes After Channel BreakdownXAUUSD OANDA:XAUUSD – Downward Pressure Resumes After Channel Breakdown: Key Levels and Strategy for Today
As of the July 29 session, gold (XAUUSD) remains under short-term bearish pressure, having broken below the descending price channel on the 1H timeframe. The market structure confirms a dominant bearish trend as price continues to trade below the EMAs cluster.
1. Price Action and Market Behavior
XAUUSD is forming a clear sequence of lower highs and lower lows, confirming a short-term downtrend.
Price is currently hovering around $3,316 after breaking below the lower boundary of the channel, signaling potential continuation of the sell-off.
2. Key Resistance and Support Levels
Immediate resistance: 3,337 – 3,346 USD (aligned with EMA20, EMA50 and prior channel resistance).
Major resistance: 3,378 – 3,385 USD (confluence of Fibo and former high).
Near-term support: 3,300 USD (psychological level).
Major support: 3,248 USD (projected target based on measured move from channel height).
3. Technical Indicators
EMA20 and EMA50 are both below EMA200, forming a classic “death cross” – a strong bearish signal.
Volume increased on the breakdown, reinforcing the strength of bearish momentum.
RSI remains below 50, indicating weak bullish retracements and room for further downside.
4. Trading Strategy
Primary Strategy: Sell on Rally
Ideal entry zone: 3,331 – 3,346 USD.
Stop Loss: Above 3,353 USD (above key resistance zone).
TP1: 3,300 USD.
TP2: 3,248 USD (extended target based on breakout structure).
Alternative Strategy: Countertrend Long
Only consider buy setups if strong reversal candles and bullish RSI divergence appear near 3,248 USD.
XAUUSD continues to face downside risk after the channel breakdown. Unless bulls reclaim the 3,337 – 3,346 zone, price is more likely to drift lower toward 3,300 and potentially 3,248. Traders should remain patient and wait for clean setups around these key zones.
Follow for more strategies and remember to save this post if you found it helpful.
Let me know if you'd like a short version for the TradingView caption or hashtags suggestion.
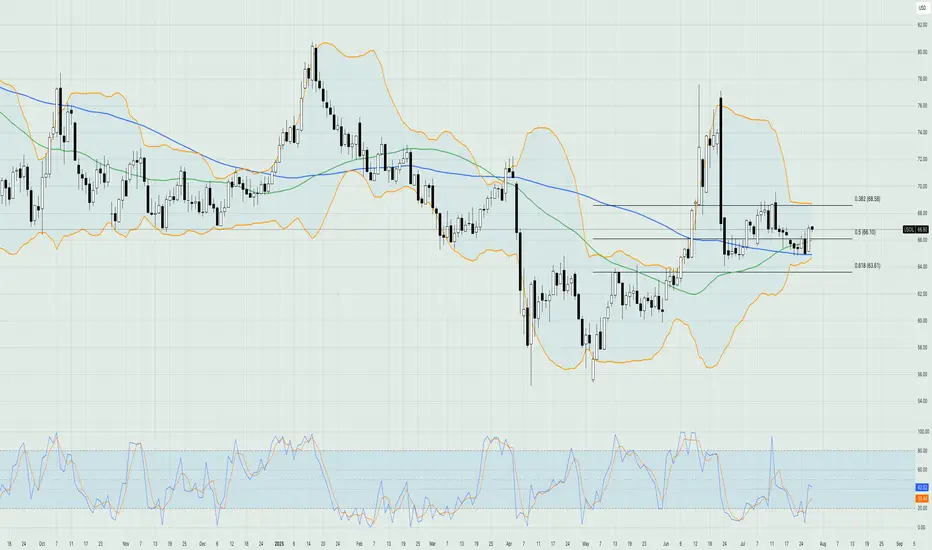
Oil Steady as Sanction Threat LoomsOil prices held steady near recent highs after Trump threatened Russia with economic penalties if it doesn’t reach a ceasefire with Ukraine within 10–12 days. Traders are watching closely, as potential secondary sanctions on Russia could disrupt crude supply. However, skepticism remains over whether Trump will follow through, given his push for lower oil prices. The threat comes amid ongoing EU sanctions and ahead of key US trade deadlines and an OPEC+ meeting. Despite current tightness and summer demand, concerns of oversupply remain for later in the year.
On the technical side, the price of crude oil is still trading in a sideways range between $64 and $68. The moving averages are confirming a bullish trend in the market, while the Stochastic oscillator is at neutral levels, hinting that the short-term outlook for pricing could go either way. The Bollinger bands have contracted quite excessively, meaning that volatility is low; therefore, it could take some time for any significant moves. Currently, the price is testing the resistance of the 50-day simple moving average, while the first area of technical resistance lies around the $68 level, which is the upper boundary of the current sideways channel.
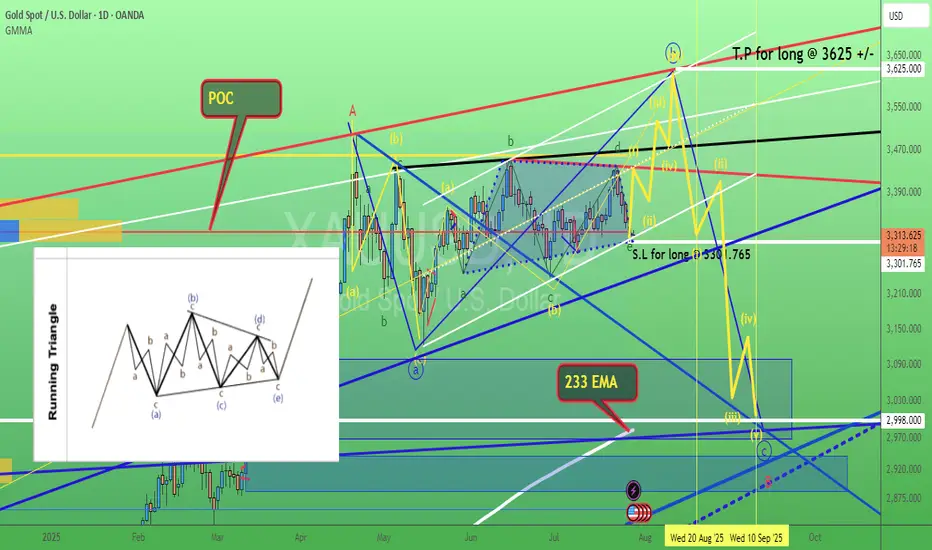
Gold. wave e (green) of triangle possible reached. 29/July/25XAUUSD based on speed of chart + confluence zone 1) Channel Support 2) POC of volume profile 3) Trendline support. Gold probably completed its wave e (green) of triangle.
Gold Tests Key Support Near $3,300Gold held near $3,315 an ounce after a 0.7% drop, as investors awaited the Fed's rate decision, key US economic data, and developments in trade talks. A stronger dollar pressured the bullion, while the market remains on edge ahead of Trump's Aug. 1 tariff deadline. A possible 90-day extension in the US-China trade truce and upcoming jobs and inflation figures could drive volatility. Although gold is up over 25% this year due to geopolitical risks and trade uncertainty, prices have been rangebound since peaking above $3,500 in April.
From a technical point of view, the price of gold is currently testing the support level of the 100-day simple moving average just above the psychological level of $3,300. Even though the Bollinger bands are contracted, they started expanding slightly recently, showing volatility might be picking up, while the moving averages are validating the overall bullish trend in the market. The Stochastic oscillator is in the extreme oversold level, hinting that a bullish resumption of the trend might be seen in the upcoming sessions. Overall, the majority of the technical indicators are hinting at a bullish image in the near short term, so probably it might be a good idea to watch out for any candlestick formations this week that might give you the entry for a long position.
Disclaimer: The opinions in this article are personal to the writer and do not reflect those of Exness

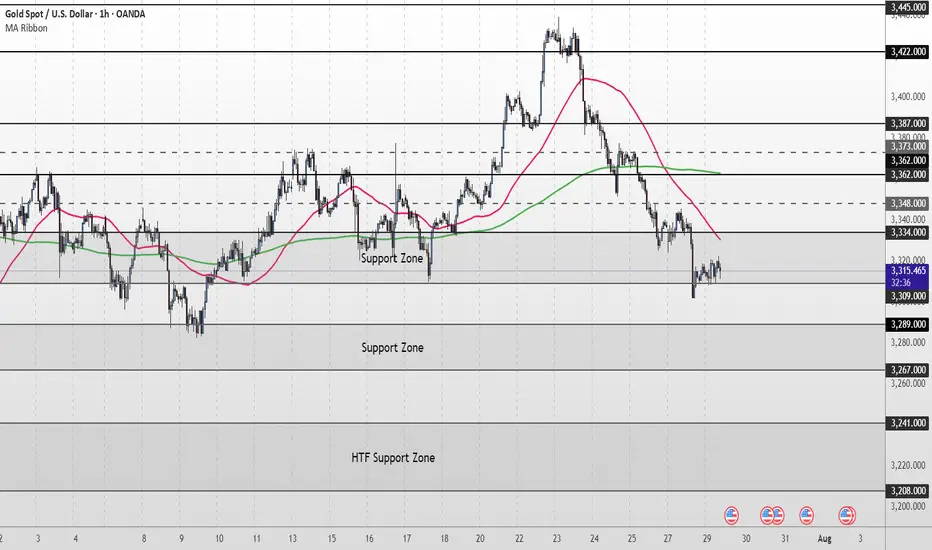
XAU/USD Intraday Plan | Support & Resistance to WatchGold remains under pressure, currently trading around 3,312. Price is holding just above the 3,309–3,289 Support Zone, but remains below both the 50MA and 200MA, which continue to slope downward—indicating short-term bearish pressure.
As long as price remains below the 3,334–3,348 resistance zone, the bearish momentum is intact. A clean break above this area would be the first sign of recovery, opening the path toward 3,362 and 3,373, where the next round of supply may emerge.
If price fails to reclaim 3,334 and breaks below 3,309, the 3,289–3,267 Support Zone becomes the next key downside target. Failure to hold that level would expose the HTF Support Zone (3,241–3,208).
📌 Key Levels to Watch
Resistance:
‣ 3,334
‣ 3,348
‣ 3,362
‣ 3,373
Support:
‣ 3,309
‣ 3,289
‣ 3,267
‣ 3,241
🔍 Fundamental Focus – Tuesday, July 29
Heads up — today’s focus is on 4:00pm, when we get JOLTS Job Openings 🟥 and CB Consumer Confidence 🟡
⚠️ Stay light and nimble — bigger moves may come tomorrow with red-folder data stacking up.
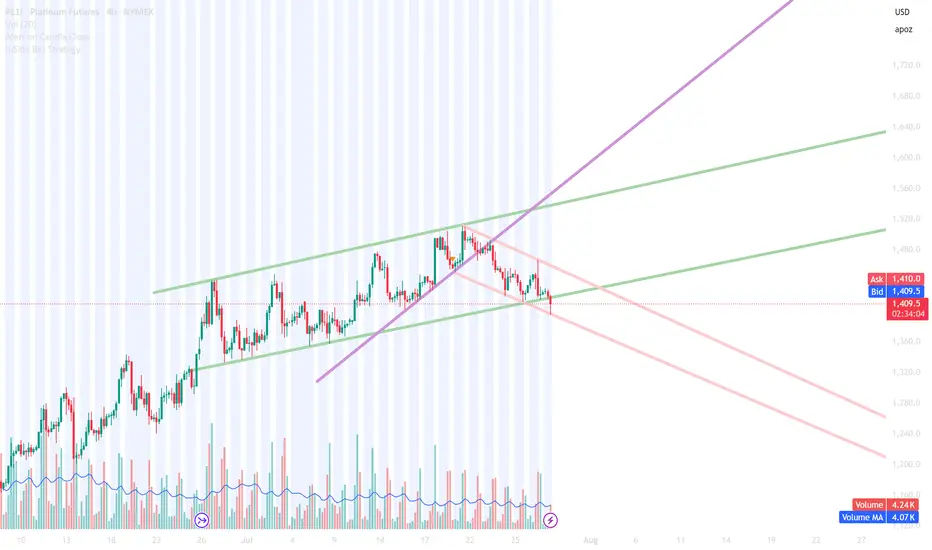
Looks like we are in a channel @PLQuick update on NYMEX:PL1! PL: The previous plan was to trade a break-out of the channel, which has now occurred. It looks like a new channel is forming. The current strategy is to either look for a breakout or simply trade the range within this new channel.
Gold Market Technical Analysis and Trading StrategiesGold Market Technical Analysis and Trading Strategies
Current Trend Analysis
Gold prices entered a technical rebound after testing key support at $3,300 and are currently trading in a narrow range between $3,315 and $3,320. This area constitutes a key bull-bear dividing line, acting as both upper resistance at the hourly chart's descending channel and technical resistance from a previous low. Since retreating from the April high of $3,500, gold prices have fallen 5.7%, primarily due to the Federal Reserve's hawkish stance and a stronger dollar.
Key Price Analysis
Resistance Zone: 3,320-3,325 (upper channel edge + Fibonacci 23.6% retracement level)
Support Level: 3,300, a psychological barrier; a break below could see prices fall to 3,280-3,260.
Bull-Bear Divide: A break above 3,320 could see prices rise to 3,340-3,353; a break below 3,310 would signal a continuation of the trend.
Market Sentiment and Momentum
COMEX net long positions have fallen to a year-to-date low, reflecting subdued market sentiment. The MACD hourly chart shows a bottoming divergence, indicating weakening short-term downward momentum, but shrinking trading volume raises doubts about the sustainability of the rebound. A doji candlestick appears after consecutive negative closes on the daily chart, reflecting a temporary equilibrium between bulls and bears.
Trading Strategy Recommendations
Primary Strategy: Set up short positions on dips under pressure between 3320-3325, with a stop-loss above 3332. Targets are 3310-3305. A break below targets 3280.
Secondary Strategy: Try a small buy position if the price stabilizes at 3315, with a strict stop-loss below 3310 and a target of 3330-3340.
Position Management: Limit risk per trade to 1-2%, with a stop-loss of $6-8.
Risk Warning: Focus on a breakout above the 3315-3320 area. Performance in the European session may indicate the direction of the US market. Be wary of volatility risks arising from changes in US economic data and Fed policy expectations. The medium- to long-term downward trend remains unchanged; strict stop-loss orders are recommended for short-term trading.

Gold Recovers After Sharp Drop – Trend Not Yet Reversed📊 Market Overview:
Gold rebounded from a sharp fall earlier in the session, rising from $3301 to around $3315 as the U.S. dollar weakened slightly and sellers took partial profit. However, no strong fundamental catalyst confirms a trend reversal yet.
________________________________________
📉 Technical Analysis:
• Key Resistance: $3315 – $3322
• Nearest Support: $3300 – $3295
• EMA 09 (H1): Price is currently just below EMA09, indicating a slight bearish bias
• Candlestick / Volume / Momentum:
• H1 candle shows a long lower wick at $3301 → some buying interest
• No H1 candle has closed above $3315 yet → no confirmed reversal
• Volume remains weak, RSI still under 50 → limited bullish momentum
________________________________________
📌 Outlook:
Gold may continue to consolidate between $3300 and $3315 in the short term. If it fails to close above $3315, bearish pressure could return toward $3295–$3288.
________________________________________
💡 Suggested Trade Setups:
🔻 SELL XAU/USD: $3315 – $3318
🎯 TP: 40/80/200 pips
❌ SL: $3323
🔺 BUY XAU/USD: $3295 – $3300
🎯 TP: 40/80/200 pips
❌ SL: $3285
GOLD H2 Intraday Chart Update For 29 July 2025Hello Traders, Welcome to new day
we have US JOLTS high impact news today, for market sustains above 3300 psychological level
if market successfully break 3280 level then it will move towards 3280 or even 3270
if market crosses 3330 level successfully then it will move towards 3345 or even 3360
All eyes on FOMC & NFP news for the week
Disclaimer: Forex is Risky

Daily gold analysisDaily gold analysis
A long position with the target and stop loss as shown in the chart
The trend is up, we may see more upside
All the best, I hope for your participation in the analysis, and for any inquiries, please send in the comments.
He gave a signal from the strongest areas of entry, special recommendations, with a success rate of 95%, for any inquiry or request for analysis, contact me

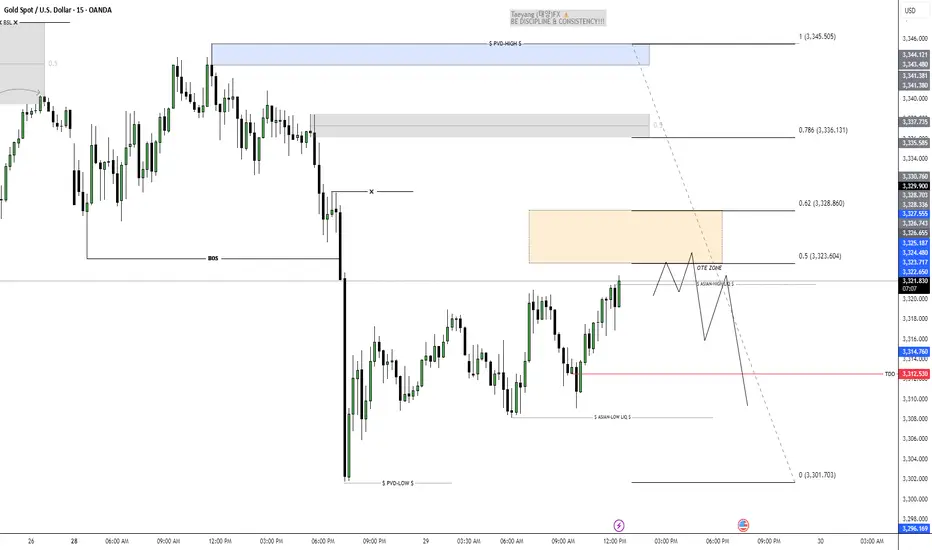
asian high sweep modelxauusd 15min view asian high sweep model with ote zone go with some ltf1min confirmation
XAUUSD DEVELOPS MID-TERM BEARISH IMPULSEXAUUSD DEVELOPS MID-TERM BEARISH IMPULSE
Yesterday was the 4th bearish day in a row for gold. The reasons are the same as for the EURUSD: American-European trade agreement. Geopolitical risks got eliminated and market participants get rid of the bullion. "If more ‘trade deals’ are reached, this could help to reduce this source of policy uncertainty that has weighed against the dollar, at least for now. It could also see other factors such as relative yields becoming more influential," said Paul Mackel, global head of FX research at HSBC.
Technically, the price has broke down the former trendline and is currently staying slightly above the local support of 3,300.00. It is expected for rebound to continue, retest of the trendline is possible with further decline towards 3,200.00 support level.
