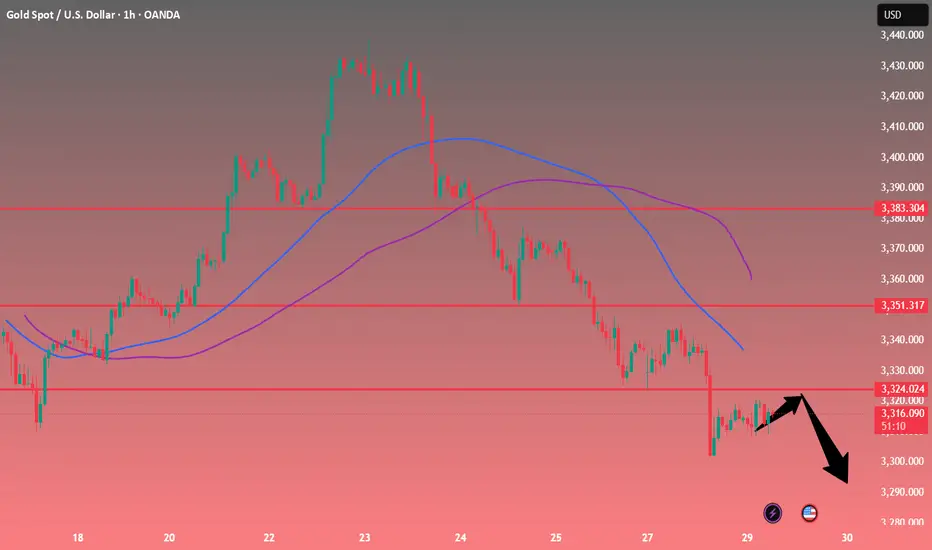
XAUUSDOANDA:XAUUSD 📉 Trade Opportunity: XAUUSD (Gold) – Short Position Setup
A sell opportunity has emerged on XAUUSD, presenting a high-probability trade idea supported by technical indicators, resistance rejection, and potential for short-term downside movement. 1. XAUUSD is currently trading near a key resistance level at 3320, where sellers have previously stepped in and capped price advances.
The recent rejection at this level suggests weakening bullish momentum and a possible short-term reversal.
The entry at 3320 provides an ideal position to take advantage of potential downside movement from a clearly defined resistance zone.
The first target at 3310 corresponds with a minor support level and offers a fast exit for conservative traders.
The second target at 3300 is psychologically significant and has historically acted as both support and resistance.
The third target at 3290 aims for a deeper move toward the lower range of the current price channel, offering maximum profit potential if momentum continues.
. The stop loss at 3330 is placed just above the recent highs, minimizing risk while allowing the trade enough room to develop.
Futures market

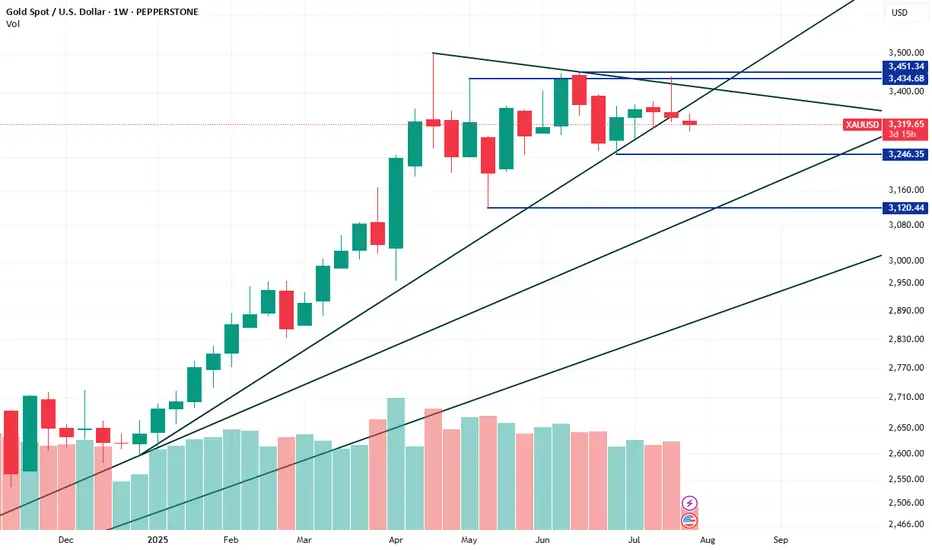
XAUUSD could potentially drop down to 3120XAUUSD has broken its most recent descending trendline on the Weekly chart, signaling a possible short-term reversal. It’s now approaching a higher-timeframe descending trendline, which could act as resistance. The next key demand zone is around 3246; if that fails, the more significant demand lies at 3120. Despite this pullback, the macro trend remains bullish. Notably, institutional traders increased their net long positions by over 40,000 contracts last week, bringing the total to more than 253,000, reflecting a potential shift in sentiment.
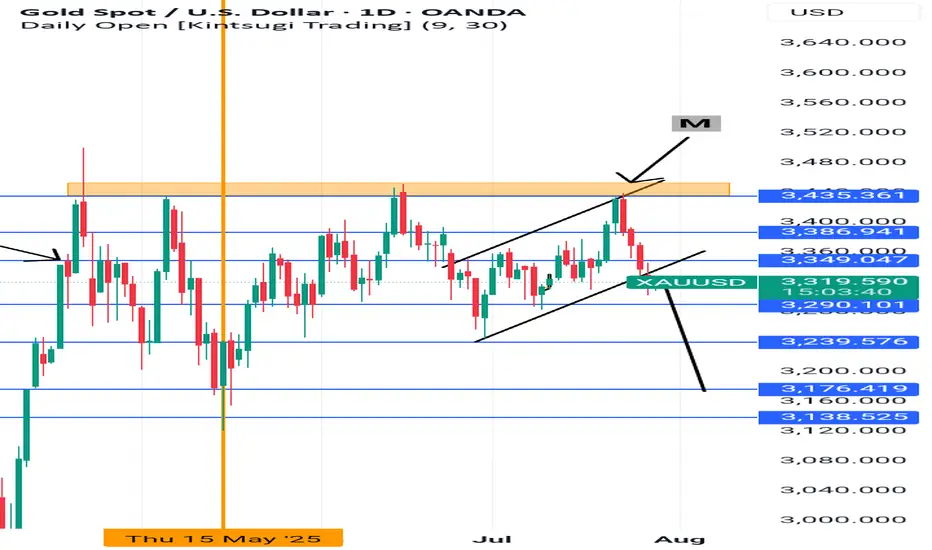
Bearish Move Xauusd has been respecting the resistance level 3435.361 that each time price hits it, it moves downwards for a sell.
The are two clear M formations that have formed, and currently the is the ascending channel where price has broken through,created a retest and is geared to move downwards to complete the M
Gold major trendline3 Bull points
RSI div
Major trendline
and hoping to reversal trend 30min timeframe very soon...
Buy stop order
RRR 1:2
Hold for 3430 for more gain but manage your risk

Crude oil-----sell near 67.50, target 65.00-64.00Crude oil market analysis:
The idea of crude oil today is still bearish. Xiaoyang predicts that it will rebound first and then continue to fall. Consider selling near 67.50 if it rebounds. Crude oil is basically weak if it does not stand above 70.00. Crude oil is a repair market after a big drop. In theory, it will continue to fall after the repair. In addition, pay attention to crude oil inventory data later.
Operation suggestions:
Crude oil-----sell near 67.50, target 65.00-64.00

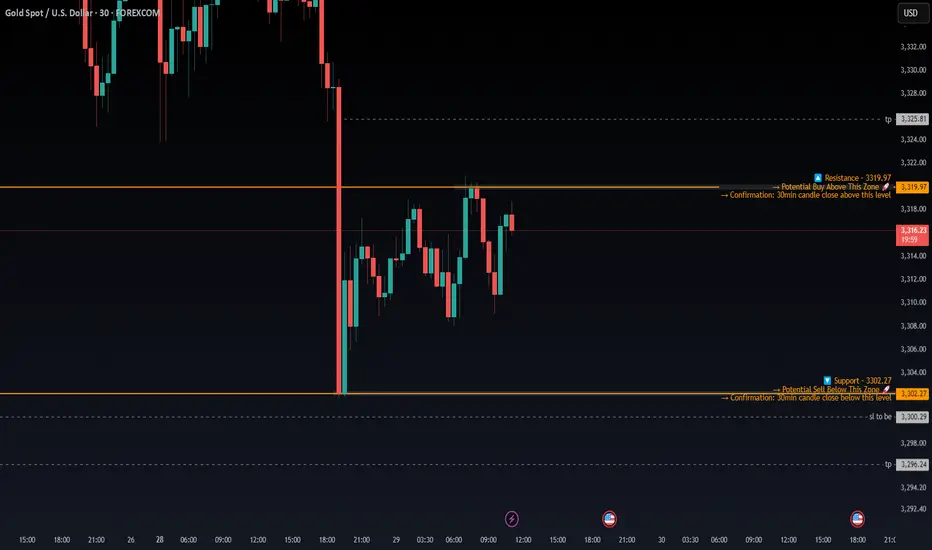
XAUUSD (GOLD) - SCALPING IDEA🧠 Clean Price Action Outlook – Patience Until the Range Breaks
Currently, price is consolidating between 3319.97 (resistance) and 3302.27 (support) a well defined short-term range that’s been respected multiple times. Both levels are holding firmly, with wicks and reactions showing that buyers and sellers are actively defending these zones.
Right now, I'm not interested in trading inside this chop zone there's too much noise and no clear directional conviction. My focus is on waiting for price to break cleanly out of the range with confirmation.
📈 Bullish Scenario (Buy Plan):
If price breaks and closes above 3319.97 on the 30-minute timeframe, that would be the first sign of bullish strength. Ideally, I want to see:
A strong bullish candle close above 3319.97
Follow-through in the next candle (not a fakeout or wick trap)
Volume pickup or price holding above the level during retest
📍 If this happens, I’ll look to enter long trades on confirmation, with a potential target around 3325.81, which is the next minor resistance.
SL would ideally be placed just below the breakout candle or the breakout zone itself depending on the price structure at the time.
📉 Bearish Scenario (Sell Plan):
On the flip side, if price breaks down below 3302.27 and closes below it on the 30-minute chart, that opens the door for shorts.
Here’s what I want to see:
A full candle body close below the level (not just a wick spike)
Possibly a retest + rejection of 3302.27 from below
Weak price action around the level confirming sellers are in control
If that plays out, I’ll consider short entries with an SL above the structure (around 3304+), and a first target around 3296.00, where there’s minor demand.
⚠️ Until Then – No Trade Zone
Until we get a confirmed breakout, I’m staying out. No point guessing which side will win the market will show us.
Gold Spot / U.S. Dollar (XAUUSD) 4-Hour Chart4-hour chart from OANDA shows the price movement of Gold Spot (XAUUSD) from mid-July to late August 2025. The current price is 3,425.000, with a slight increase of +0.03% (0.880) to 3,315.325. Key levels include a sell price of 3,315.070 and a buy price of 3,315.590. The chart highlights a recent downward trend with a support zone around 3,313.855 and resistance near 3,350.823, as indicated by the shaded areas.

A Good Spot for a Long-Term Entry – Is Today the Weekly Low?Gold Positioning – Preparing for a Potential Swing Long After Liquidity Sweep
Gold is currently positioned at an attractive area for a potential long-term buy setup, following a clear liquidity sweep outside the external range, where Monday’s candle took out the previous Daily Swing Low.
While immediate buying may still be premature, current price action suggests a continued short-term decline could play out today, targeting the Old Low of Monday’s candle. This area may serve as the foundation for a weekly bottom formation.
🔹 Strategic Outlook:
Based on this scenario, I may allocate a small portion of capital for an early long position , with the intention to hold through the upcoming bullish swing.
This position could potentially be held for a minimum of 500 pips if the market confirms a reversal.
Key Buy Zone to monitor: 3289 – 3297
Patience and precision will be key. Let the market show its hand before scaling in.

CAN SILVER RETURN TO ITS HISTORIC HIGH OF $50?In the world of precious metals, gold has already broken its all-time high in recent months, supported by solid fundamentals. Another precious metal is now catching up: silver. Unlike platinum and palladium, silver today combines all the necessary ingredients to revisit its historic peak. Its bullish potential stems from a unique blend of market volume, correlation with gold, supportive fundamentals, and favorable technical conditions. Silver isn’t just "gold’s little brother": it is currently the only precious metal with both the technical and structural setup to aim once again for the mythical $50 mark, last reached in 2011.
1) After GOLD, silver is the most liquid precious metal and has the highest positive correlation
The first key factor is liquidity. On the precious metals market, gold remains the clear leader, with hundreds of billions of dollars traded daily. Silver comes second, far ahead of platinum and palladium, with around $5 billion in daily volume. This level of activity is crucial—adequate liquidity allows speculative and institutional flows to fully express themselves. Conversely, the low volumes of platinum and palladium limit their upside, as their markets are too narrow to support the kind of momentum seen in gold or silver.
The second strength of silver lies in its natural correlation with gold. Historically, the two metals move in sync. This behavioral alignment is reflected in a correlation coefficient close to 1. Platinum and palladium, by contrast, respond to industrial demand, particularly from the auto sector and emissions technology. Silver, however, blends industrial uses (jewelry, electronics, solar panels, etc.) with a monetary and financial role similar to gold. This dual nature makes silver a hybrid asset, with both ETF-driven financial demand and jewelry-like industrial demand.
2) Technically, the SILVER/GOLD ratio remains in a short-term uptrend from a long-term support
Technical analysis reinforces this fundamental outlook. While gold appears to be losing steam after hitting $3,500, silver still shows a medium-term bullish setup—even though short-term corrections are always possible. The gold/silver ratio, historically useful to detect when silver outperforms gold, also suggests that silver is poised for further gains. Silver’s long-term trend remains bullish as long as the $34–$35 support zone holds. The $50 mark is the natural technical target of this trend.
The following chart shows the gold/silver ratio and indicates that silver is likely to outperform gold through year-end:
And here is the monthly candlestick chart of spot silver:
DISCLAIMER:
This content is intended for individuals who are familiar with financial markets and instruments and is for information purposes only. The presented idea (including market commentary, market data and observations) is not a work product of any research department of Swissquote or its affiliates. This material is intended to highlight market action and does not constitute investment, legal or tax advice. If you are a retail investor or lack experience in trading complex financial products, it is advisable to seek professional advice from licensed advisor before making any financial decisions.
This content is not intended to manipulate the market or encourage any specific financial behavior.
Swissquote makes no representation or warranty as to the quality, completeness, accuracy, comprehensiveness or non-infringement of such content. The views expressed are those of the consultant and are provided for educational purposes only. Any information provided relating to a product or market should not be construed as recommending an investment strategy or transaction. Past performance is not a guarantee of future results.
Swissquote and its employees and representatives shall in no event be held liable for any damages or losses arising directly or indirectly from decisions made on the basis of this content.
The use of any third-party brands or trademarks is for information only and does not imply endorsement by Swissquote, or that the trademark owner has authorised Swissquote to promote its products or services.
Swissquote is the marketing brand for the activities of Swissquote Bank Ltd (Switzerland) regulated by FINMA, Swissquote Capital Markets Limited regulated by CySEC (Cyprus), Swissquote Bank Europe SA (Luxembourg) regulated by the CSSF, Swissquote Ltd (UK) regulated by the FCA, Swissquote Financial Services (Malta) Ltd regulated by the Malta Financial Services Authority, Swissquote MEA Ltd. (UAE) regulated by the Dubai Financial Services Authority, Swissquote Pte Ltd (Singapore) regulated by the Monetary Authority of Singapore, Swissquote Asia Limited (Hong Kong) licensed by the Hong Kong Securities and Futures Commission (SFC) and Swissquote South Africa (Pty) Ltd supervised by the FSCA.
Products and services of Swissquote are only intended for those permitted to receive them under local law.
All investments carry a degree of risk. The risk of loss in trading or holding financial instruments can be substantial. The value of financial instruments, including but not limited to stocks, bonds, cryptocurrencies, and other assets, can fluctuate both upwards and downwards. There is a significant risk of financial loss when buying, selling, holding, staking, or investing in these instruments. SQBE makes no recommendations regarding any specific investment, transaction, or the use of any particular investment strategy.
CFDs are complex instruments and come with a high risk of losing money rapidly due to leverage. The vast majority of retail client accounts suffer capital losses when trading in CFDs. You should consider whether you understand how CFDs work and whether you can afford to take the high risk of losing your money.
Digital Assets are unregulated in most countries and consumer protection rules may not apply. As highly volatile speculative investments, Digital Assets are not suitable for investors without a high-risk tolerance. Make sure you understand each Digital Asset before you trade.
Cryptocurrencies are not considered legal tender in some jurisdictions and are subject to regulatory uncertainties.
The use of Internet-based systems can involve high risks, including, but not limited to, fraud, cyber-attacks, network and communication failures, as well as identity theft and phishing attacks related to crypto-assets.

Gold price bottoming out?Market news:
In early Asian trading on Tuesday (July 29), spot gold fluctuated in a narrow range and is currently trading around $3,320 per ounce. The international gold price fell to a three-week low on Monday, mainly because the United States and the European Union reached a trade agreement over the weekend, boosting the dollar and risk sentiment. In addition, Trump said that he would impose a "global tariff" of 15% to 20% on most countries, which was different from his statement last week. The dollar index rose to a one-week high, making gold relatively expensive for investors holding other currencies.The volatile downward trend of London gold prices was not only directly affected by the trade agreement reached between the United States and Europe, but also closely related to the strong rebound of the US dollar index, the recovery of global risk appetite and the market's expectations for the Federal Reserve's interest rate policy. At the same time, the progress of Sino-US trade negotiations, Trump's tough stance on Russia and the Middle East, and the continued tension in geopolitics still add more uncertainty to the future trend of the gold market.Gold is facing multiple tests: the three unfavorable factors of a strong dollar, a rebound in risk appetite, and a rise in real interest rates have formed a combined force. In addition, the US Conference Board Consumer Confidence Index for July and the US JOLTs job vacancy data for June will also be released on this trading day, and investors need to pay attention to them.
Technical Review:
The further strengthening of the US dollar index has caused gold to continue to adjust close to the 3300 mark under pressure. As the price crosses below the short-term moving average, the current short-term moving average and other periodic indicators have begun to turn downward, and the Bollinger Bands as a whole are also intended to shrink. In addition, the macd indicator has a dead cross pattern again and has no upward intention, and it has a strong downward extension and obvious volume. Therefore, the daily line should continue to tend to sell. However, while selling, we should also pay attention to the strength of the rebound.The daily chart closed with a continuous negative structure, and the price was running in the middle and lower tracks of the Bollinger Bands and below the MA10 daily moving average of 3360. The short-term four-hour chart hourly chart Bollinger Bands opened downward, and the moving average opened downward. In addition, the macd indicator maintained a dead cross pattern, and the downward volume showed sufficient potential, so the 4-hour gold price can continue to participate in selling at a high level after a short-term rebound, assisting low-price buying!
Today's analysis:
Gold bears are galloping all the way, and gold buying has basically no rebound strength. Gold is still in a selling trend. Go with the trend, the trend is king, and continue to sell with the trend. As long as gold does not show an obvious buy reversal signal, then the rebound is to continue to sell gold to the end.The gold 1-hour moving average continues to form a dead cross selling arrangement. The selling strength of gold is still very strong, and gold selling will continue to exert its strength. Gold rebounded to 3318 yesterday, which is still a weak rebound. The watershed for buying and selling gold is now at 3330. Gold rebounds above 3330 in the Asian session, which is an opportunity to sell at highs.
Operation ideas:
Buy short-term gold at 3300-3302, stop loss at 3292, target at 3330-3350;
Sell short-term gold at 3330-3333, stop loss at 3342, target at 3300-3290;
Key points:
First support level: 3308, second support level: 3293, third support level: 3284
First resistance level: 3330, second resistance level: 3346, third resistance level: 3360
Gold----Sell near 3326, target 3300-3280Gold market analysis:
The recent gold daily line is still weak. It rebounded yesterday and fell again. It has touched the strong support of the weekly line. Today's idea is still bearish. Consider continuing to sell it if it rebounds. It is estimated that it will be repaired if there is support at 3300. The daily line was a cross star yesterday, and the upper shadow line was very long. The daily moving average suppression position was also around 3345, and the suppression position of the pattern was also around 3350. Today, the price is below 3345. We insist on being bearish. This week is a data week. The subsequent trend depends on the release of data. If the data is not strong and the weekly selling signal is added, it is very likely that gold will enter the 3200 era. After the weekly line breaks 3280, it basically opens up the weekly line's downward space, and will start a deep decline in the later period. In the Asian session of gold, we pay attention to the suppression of 3326. This position is the indicator suppression and the small suppression of the pattern. Consider selling it near this position. If it stands above 3326, don't sell it. The repair range will be 3345. Consider selling it at 3345. If the US market cannot break 3300, we should consider whether it will rebound. On the contrary, if it breaks 3300 directly in the Asian market, we should consider selling it directly.
Support 3300 and 3280, suppress 3326 and 3345, and the watershed of strength and weakness in the market is 3326.
Fundamental analysis:
This Monday and Tuesday are relatively quiet, and the big data will be released one by one starting from Wednesday.
Operation suggestion:
Gold----Sell near 3326, target 3300-3280

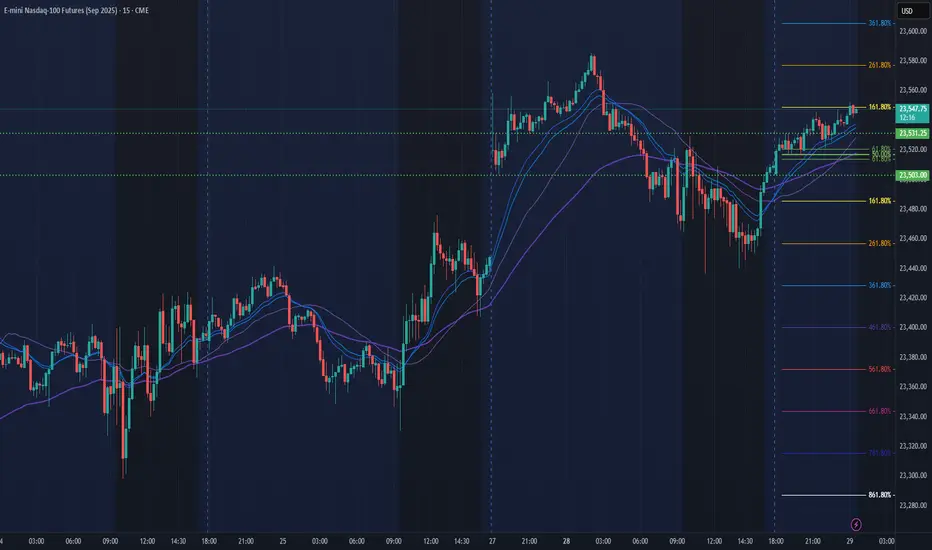
NQ & ES Key LevelsExactly as I predicted yesterday...The price was supported at the key levels and moved upwards.

NQ Power Range Report with FIB Ext - 7/29/2025 SessionCME_MINI:NQU2025
- PR High: 23531.00
- PR Low: 23503.00
- NZ Spread: 62.5
Key scheduled economic events:
10:00 | CB Consumer Confidence
- JOLTs Job Openings
Session Open Stats (As of 12:25 AM 7/29)
- Session Open ATR: 233.38
- Volume: 17K
- Open Int: 280K
- Trend Grade: Long
- From BA ATH: -0.2% (Rounded)
Key Levels (Rounded - Think of these as ranges)
- Long: 23811
- Mid: 22096
- Short: 20383
Keep in mind this is not speculation or a prediction. Only a report of the Power Range with Fib extensions for target hunting. Do your DD! You determine your risk tolerance. You are fully capable of making your own decisions.
BA: Back Adjusted
BuZ/BeZ: Bull Zone / Bear Zone
NZ: Neutral Zone
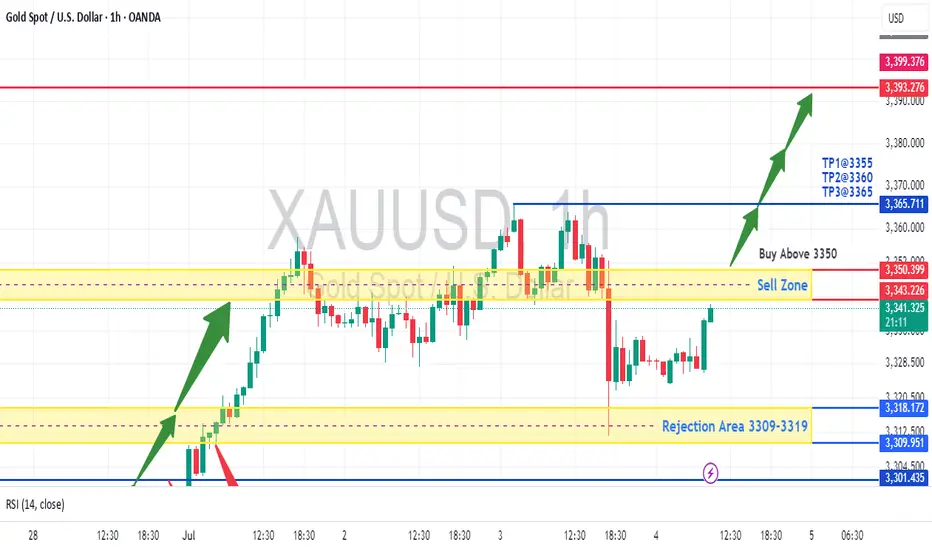
XAUUSD - Retesting 3400 before DeclineThe chart shows a potential buy setup for gold (XAUUSD) with the following key points:
Price Action: Gold is trading at 3,341.465, above the suggested "Buy Above 3350" level, indicating a bullish bias.
Support/Resistance: The rejection area at 3309-3319 held as support, and price has moved higher, confirming buyer interest.
Take Profit Levels: TP1 (3355), TP2 (3360), and TP3 (3365) provide clear upside targets.
RSI Confirmation: The RSI (14) at 54.21 shows moderate bullish momentum without being overbought.
Volume & Close: The slight increase in price (+0.09%) with supportive volume suggests accumulation.
Trade Idea: Enter long above 3350 with stops below 3309, targeting TP1-TP3. The rejection zone and RSI support further upside.
Disclaimer: This is not financial advice. Please consult with a financial advisor before making any investment decisions. We are not responsible for your loss because we are not SEBI registered and this analysis based on technical aspects and only for educational practice. Do your own research.
XAUUSD Analysis: Watching 3323.52 as Potential Support-Turn-ResiPrice action on XAUUSD suggests that the 3323.52 level may act as a key area of interest. Following the recent break below a structural low, I am anticipating a possible retracement toward this zone, where it could serve as a support-turned-resistance level.
Should price react to this area and fail to reclaim it, we may see a continuation of bearish momentum driving price lower.
📌 Key Level: 3323.52
📉 Bias: Bearish below this zone
🔍 Confirmation: Watching for rejection or bearish structure on lower timeframes around the level

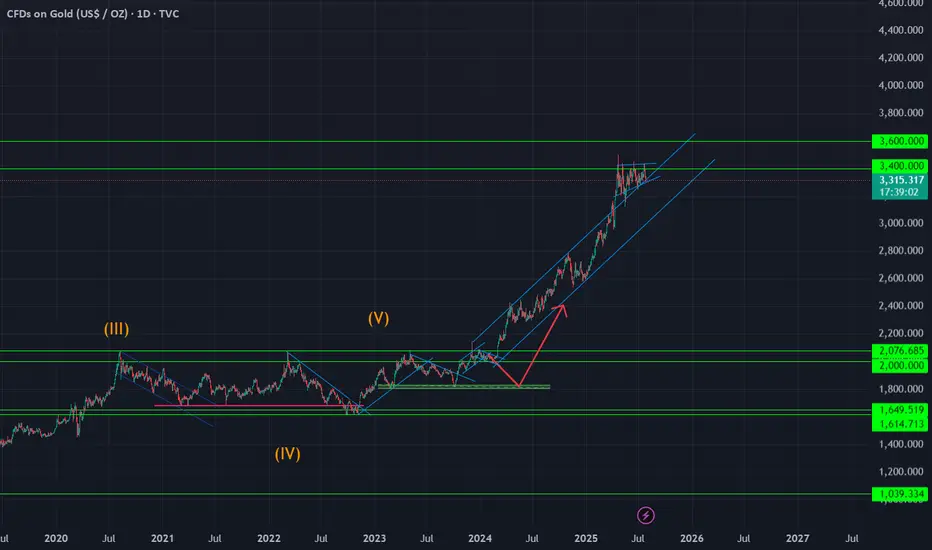
Gold RetracementGold has been leading massively since the COVID Recession driven by all time highs of inflation and low rates across the board it also traded the best in the last 18 months and so, being almost vertical in its upward movement. And so as the old testaments of time have taught us nothing lasts, Gold didn't yet have a corrective move, and one should suspect that the 2000 levels- not so long ago used to be ATH- will be revisited some time in the 12 months period ahead.
The 3400 level is holding strong but there yet to be signs of weakness on the XAUUSD pair, 3400-3600 USD/Oz is a good as any level top sell expect pumping and dumping as high as 3800 for the FOMO buyers to be drawn in by the big whales and the Short sellers to be Margined out.
This opportunity is as good as any and the market never runs out of these opportunities so trade safely don't get greedy and live below your means.
Stay safe out there
OANDA:XAUUSD
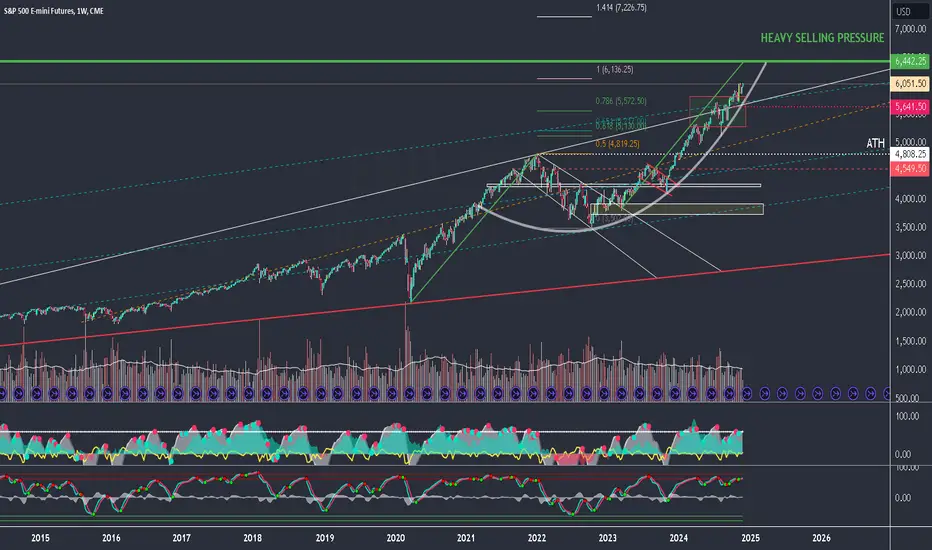
SP500 E-Mini Futures will pump to 6,442.00 and then dump hardSP500 E-Mini Futures is showing in the lower timeframes a possible continuation at least more 6,30% reaching the 6,442.00 mark and at the same time with some bearish divergences in the higher time frames that if the price gets there could iniate a pullback between 30% and 40% to bring the price back slight below 4,000.00 at the end of next year possibly.
XAUUSD Analysis: Watching 3323.52 as Potential Support-Turn-ResiPrice action on XAUUSD suggests that the 3323.52 level may act as a key area of interest. Following the recent break below a structural low, I am anticipating a possible retracement toward this zone, where it could serve as a support-turned-resistance level.
Should price react to this area and fail to reclaim it, we may see a continuation of bearish momentum driving price lower.
📌 Key Level: 3323.52
📉 Bias: Bearish below this zone
🔍 Confirmation: Watching for rejection or bearish structure on lower timeframes around the level

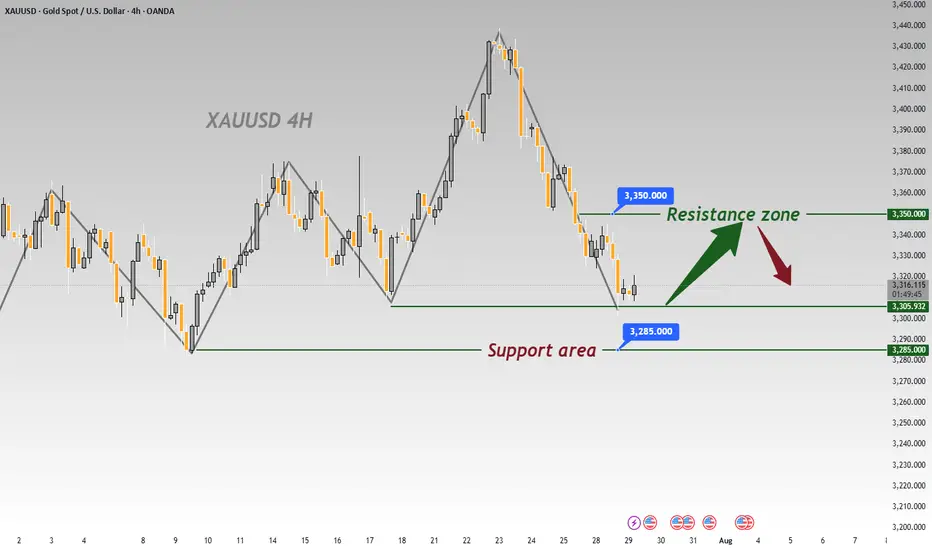
Gold: This Week's Analysis & StrategyThis week, the fluctuations have clearly moderated📉. Focus on a strategy of buying at lows and selling at highs as much as possible📈. Currently, the resistance around 3350 is prominent🚧, and 3300 acts as support below🛡️. If the decline continues, it may reach around 3285👇
We successfully took short positions last week 📉, and this week I recommend going long at lower levels 📈. Over the long term, gold remains in a bull market 🐂, but it will not repeat the frenzy seen in April; instead, it will maintain a steady upward pace ⬆️.
Market expectations for Fed rate cuts have been volatile so far this year 📊. At the start of the year, as Trump-related developments unfolded, market optimism faded 😐. Meanwhile, the de-dollarization trend fueled growing expectations of Fed rate cuts 💹. By early April, Trump’s reciprocal tariff measures—far more aggressive than expected—roiled global financial markets 🌍, triggering a surge in concerns about a U.S. recession ⚠️. Markets thus anticipated that the Fed would cut rates quickly to shore up the economy, with expectations for rate cuts within the year once exceeding 100 basis points 📉. However, shortly after, Trump announced a 90-day extension of the reciprocal tariffs, easing market pessimism 😌 and driving a strong rebound in U.S. stocks 📈. At this point, markets began worrying that his tariff policies could spark an inflation rebound 🔥, leading to a steady decline in rate cut expectations—currently, expectations for rate cuts this year have dropped to fewer than two 🔄.
Risk Warning ⚠️
Event Sensitivity: Outcomes of China-U.S. trade talks 🤝, the Fed’s statements , and nonfarm payroll data 📊 may trigger one-sided volatility. Positions should be adjusted promptly to avoid risks 🛡️
⚡️⚡️⚡️ XAUUSD ⚡️⚡️⚡️
🚀 Buy@ 3300 -3310
🚀 TP 3320 - 3330 - 3340
🚀 Sell@ 3350 -3340
🚀 TP 3330 - 3320 - 3310
Daily updates bring you precise trading signals 📊 When you hit a snag in trading, these signals stand as your trustworthy compass 🧭 Don’t hesitate to take a look—sincerely hoping they’ll be a huge help to you 🌟 👇
7.29 Gold 1-hour bottom signal appearsIn the short term, we see the daily line as the range of 3301-3345, and the current price is showing a volatile rebound, so we have to buy on dips. Then 3306-08 is the long point, but the price has risen in the morning, so the long position should be around 3310-12 in advance. If it falls below 3301 during the day, it will continue to test the 3292-3282 line downward. Similarly, if it breaks above 3345 during the day, it will continue to test 3372 upward and show a rebound trend in the next few days.
Buy GoldAnother Opportunity to Buy gold... i think gold will fill previous weekly wick this week.. so get Ready 🔥

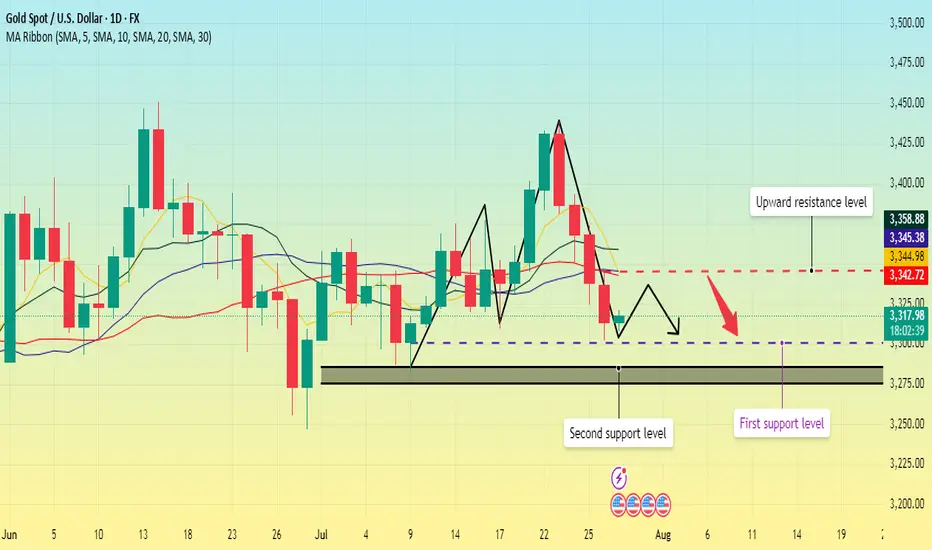
Gold repeatedly tested lows. Will it break through?On Monday, the Asian market opened low and rose in the early trading. In the European trading, it rose to around 3345. The European trading was under pressure and fluctuated. The US trading began to accelerate its decline, and the lowest point reached around 3302. Then it continued to fluctuate in the range of 3300-3320.
On July 27, the United States and the European Union reached a framework trade agreement; the agreement reduced market concerns about the global economic recession, promoted the attractiveness of risky assets, and boosted the stock market and the US dollar. Although Trump has repeatedly pressured for a substantial interest rate cut, the market has strong expectations for a September interest rate cut. The current expectation of maintaining a stable interest rate dominates the market, coupled with the strength of the US dollar, which puts gold prices under downward pressure in the short term.
Gold opened low in the early trading on Monday and then rebounded to recover the losses, but then fell below the low again, and the daily line closed in the negative, and now it has formed a four-day negative decline. MA5 and 10-day moving averages form a dead cross, and there is a downward turn.
The focus on the upper side is around Monday's high of 3345, which is also near the current position of MA5, 20, and 30-day moving averages. Below this position, gold is weak; if it breaks upward, it is necessary to prevent the possibility of a rebound correction.
The lower support first focuses on the 3300 integer mark; secondly, focus on the area around 3285-3275.
Operation strategy:
Short near 3340, stop loss 3350, profit range 3320-3300;
Long near 3300, stop loss 3290, profit range 3320-3340.
Before the release of US data on Tuesday, you can maintain this operation strategy; after the data is released, adjust the strategy based on the impact of the data.
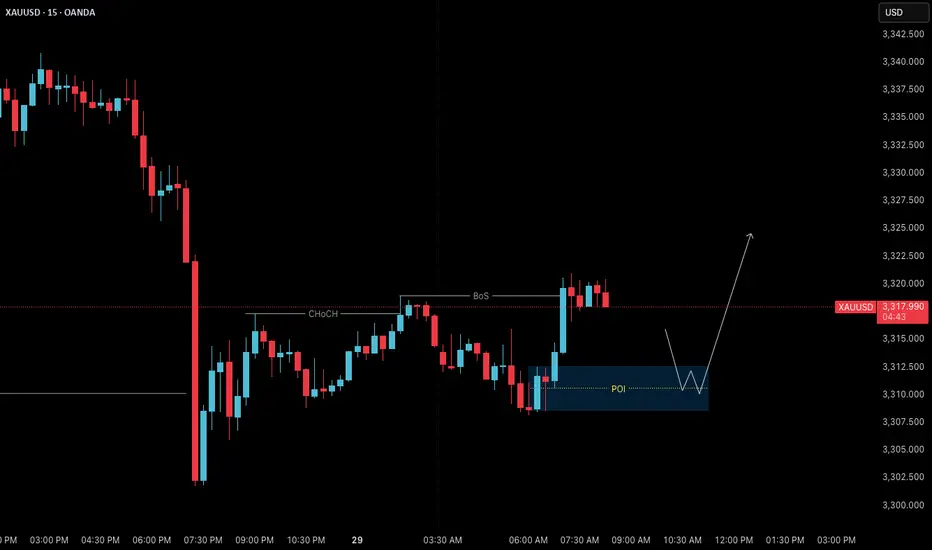
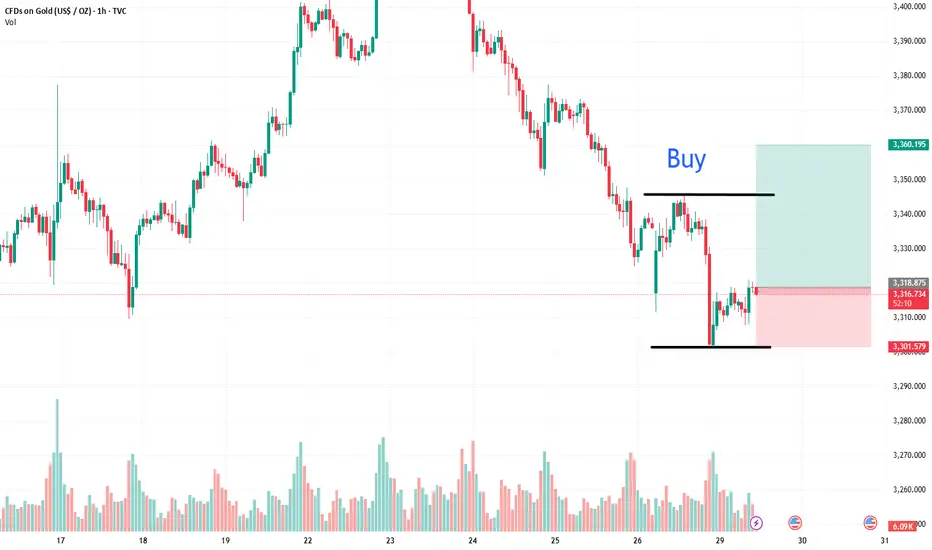
Gold 29 July – H4 Demand Holds, M15 Structure ShiftsGold (XAUUSD) Analysis – 29 July
The Mirror is Forming at 3310: Structure + Reaction in Focus
The market has successfully held the H4 demand zone, particularly near the critical level around 3310. This level is not just another number on the chart — it’s an inflection point. A possible first higher low or swing low, from which the next directional leg in gold could emerge.
Yesterday’s price action swept liquidity beneath this zone and then showed a strong bullish reaction. This isn’t just a bounce. It’s a behavioral shift — one that hints at absorption of selling pressure and the re-entry of aggressive buyers.
🔍 Structure Alignment: H4 + M15
On the H4 timeframe, price has stabilized within the demand zone.
Zooming into M15, we now see internal price action beginning to shift:
• First, a Change of Character (ChoCH) — the earliest clue that momentum is starting to turn.
• Then, a Break of Structure (BoS) to the upside — signaling potential bullish intent.
This multi-timeframe alignment — H4 support holding + M15 structure shifting — builds a strong case for a potential reversal and continuation of the uptrend.
📍 What Next?
The next step is to mark a refined M15 Point of Interest (POI) — a zone where price may pull back before making its next move upward.
We don’t chase price. We let it come to us.
✅ Look for Lower Timeframe Confirmation
Once price returns to your POI, it’s time to observe.
You’re not looking for obvious signals. You’re watching for subtle behavior —
a sharp reaction, a psychological flush, or a precise candle footprint that reveals intent.
The deeper signals aren’t always visible to the untrained eye — but they’re there for those who’ve studied the mirror.
( For those who know what to look for — this is where the sniper entry reveals itself. )
🎯 Summary
• Bias: Bullish — structure and reaction support long setups
• Plan: Wait for price to retest the M15 POI
• Execution: Only enter on confirmed lower timeframe intent and confluence
• Target: 120 pips (fixed, as per system)
• Stop Loss: 40 pips (always 1:3 R:R minimum)
📚 This is the kind of structure-based clarity we teach in The Chart is the Mirror .
Let the chart speak.
Let the structure guide you — not your emotion.
📘 Shared by @ChartIsMirror