WTI(20250729)Today's AnalysisMarket news:
After gold prices soared to an all-time high of more than $3,500 an ounce in April, the latest report from the Commodity Futures Trading Commission (CFTC) showed that fund managers have increased their bullish bets to the highest level in 16 weeks.
Technical analysis:
Today's buy and sell boundaries:
66.09
Support and resistance levels:
68.13
67.37
66.87
65.30
64.80
64.04
Trading strategy:
If the price breaks through 66.87, consider buying, the first target price is 67.37
If the price breaks through 66.09, consider selling, the first target price is 65.30
Futures market

Dow Jones Monday Gap and Rally Long Trade EntryI am going for a gap up and rally idea. Extremely bullish bias. I am already triggered in Long at 45,252
stop is 75 ticks
target is 180 ticks
This is my one trade for the day.
Same idea as Sunday May 11th where it too gapped up at the open over 1% and right into 250 for the rally all day
Today's action

XAU/USD(20250729) Today's AnalysisMarket news:
After gold prices soared to an all-time high of more than $3,500 an ounce in April, the latest report from the Commodity Futures Trading Commission (CFTC) showed that fund managers have increased their bullish bets to the highest level in 16 weeks.
Technical analysis:
Today's buying and selling boundaries:
3320
Support and resistance levels:
3363
3347
3337
3303
3293
3277
Trading strategy:
If the price breaks through 3320, consider buying in, with the first target price of 3337
If the price breaks through 3303, consider selling in, with the first target price of 3293

Bullish Sentiment Returns to Gold?Hello everyone, what are your thoughts on XAUUSD?
From a technical perspective, XAUUSD has just retested its long-term ascending trendline and formed a bullish reaction candle, suggesting that buying pressure may be returning.
Recently, a survey of 206 investors revealed that market sentiment remains optimistic, with 66% expecting gold prices to continue rising, 19% predicting a decline, and 15% anticipating a sideways market.
What do you think? Share your opinion in the comments!

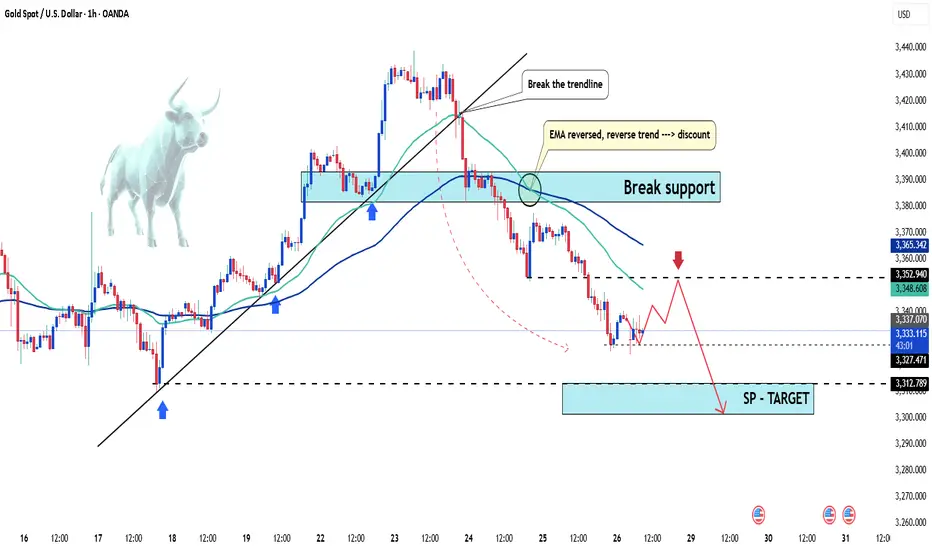
Gold setupGold us just broken to the downside from the previous uptrend and now we expect the prices to continue pushing towards the downside. the prices are likely to reject from the the current order block but if not, they will probably do on the smaller upper order block as you can see via the analysis

Gold Under Pressure – Temporary Pullback or Start of a DowntrendHello everyone, great to see you again.
Today, let’s focus on the bearish factors surrounding gold. At the time of writing, gold is trading around 3,331 USD, down 50 pips on the day, continuing its downward correction since the end of last week.
Within just a few days, gold has plunged from its peak of 3,433 USD—losing nearly 100 USD per ounce.
This sharp drop is largely driven by profit-taking and market anticipation ahead of key economic data next week, including U.S. interest rate decisions, inflation, and job reports.
This week is packed with critical updates: growth figures, inflation stats, employment numbers, and monetary policy decisions from major central banks—all of which could significantly impact gold’s next move.
According to a recent survey, 36% of analysts expect gold to fall further, while retail investors remain optimistic about a rebound.
For now, the market is clearly in a correction phase. Caution is advised.
What do you think—will gold bounce back or continue to drop?
Daily Analysis- XAUUSD (Tuesday, 29th July 2025)Bias: No Bias
USD News(Red Folder):
-JOLTS Job Openings
Notes:
- Strong bearish closure
- Uncertainty on fundamentals
- Potential BUY/SELL if there's
confirmation on lower timeframe
- Pivot point: -
Disclaimer:
This analysis is from a personal point of view, always conduct on your own research before making any trading decisions as the analysis do not guarantee complete accuracy.
The strongest top out I’ve ever seen!Gold gives the strongest topping signal I know of. The USD appears to be bottoming. You’d have to be crazy to not have downside protection at the very least. I’m all the way short!

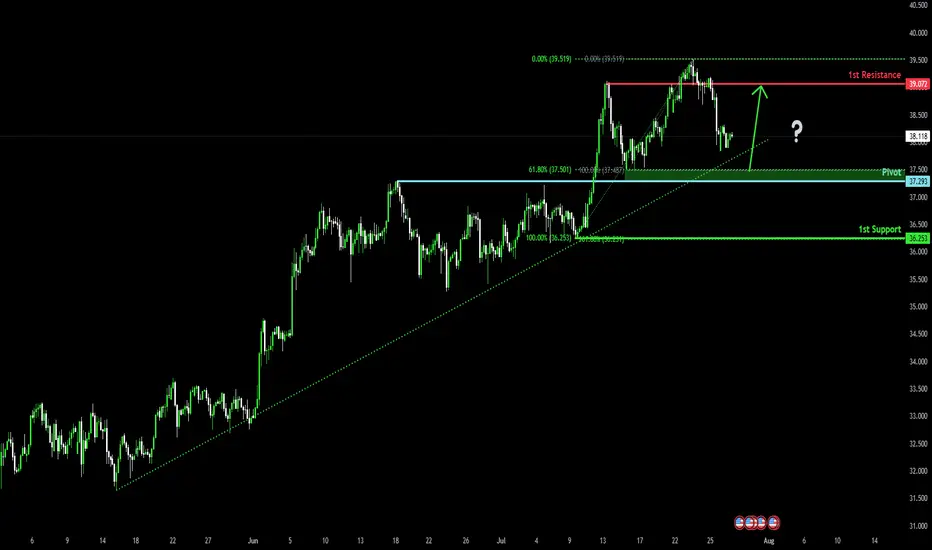
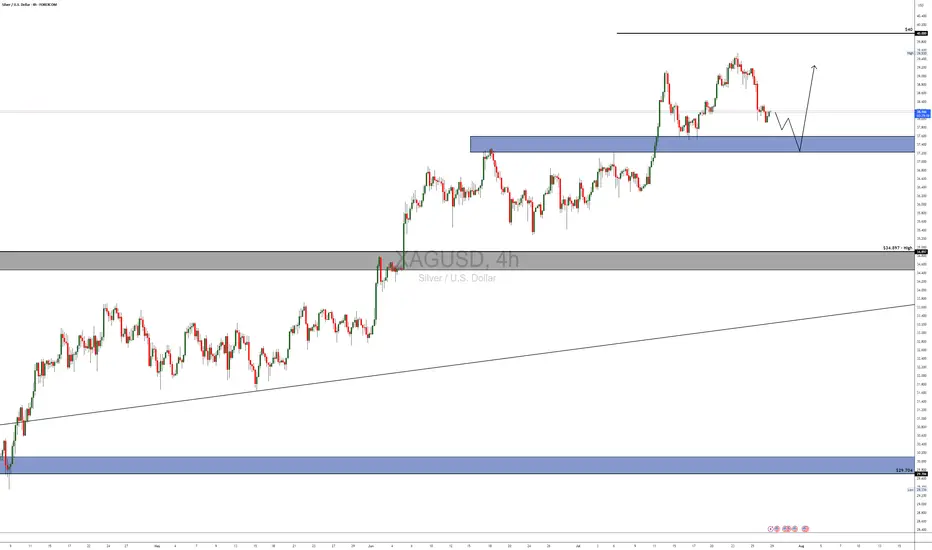
Falling towards pullback support?The Silver (XAG/USD) is falling towards the pivot, which is a pullback support and could rise to the 1st resistance.
Pivot: 37.29
1st Support: 36.25
1st Resistance: 39.07
Risk Warning:
Trading Forex and CFDs carries a high level of risk to your capital and you should only trade with money you can afford to lose. Trading Forex and CFDs may not be suitable for all investors, so please ensure that you fully understand the risks involved and seek independent advice if necessary.
Disclaimer:
The above opinions given constitute general market commentary, and do not constitute the opinion or advice of IC Markets or any form of personal or investment advice.
Any opinions, news, research, analyses, prices, other information, or links to third-party sites contained on this website are provided on an "as-is" basis, are intended only to be informative, is not an advice nor a recommendation, nor research, or a record of our trading prices, or an offer of, or solicitation for a transaction in any financial instrument and thus should not be treated as such. The information provided does not involve any specific investment objectives, financial situation and needs of any specific person who may receive it. Please be aware, that past performance is not a reliable indicator of future performance and/or results. Past Performance or Forward-looking scenarios based upon the reasonable beliefs of the third-party provider are not a guarantee of future performance. Actual results may differ materially from those anticipated in forward-looking or past performance statements. IC Markets makes no representation or warranty and assumes no liability as to the accuracy or completeness of the information provided, nor any loss arising from any investment based on a recommendation, forecast or any information supplied by any third-party.
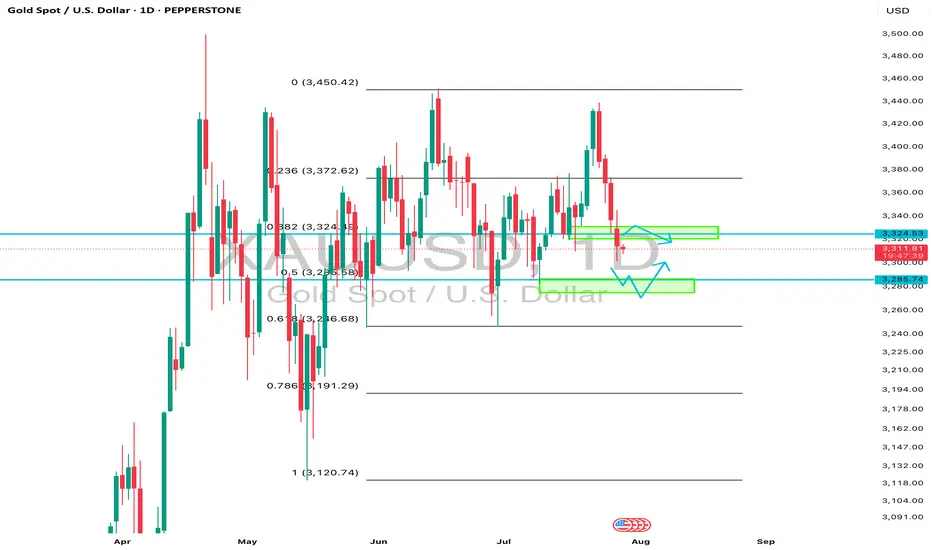
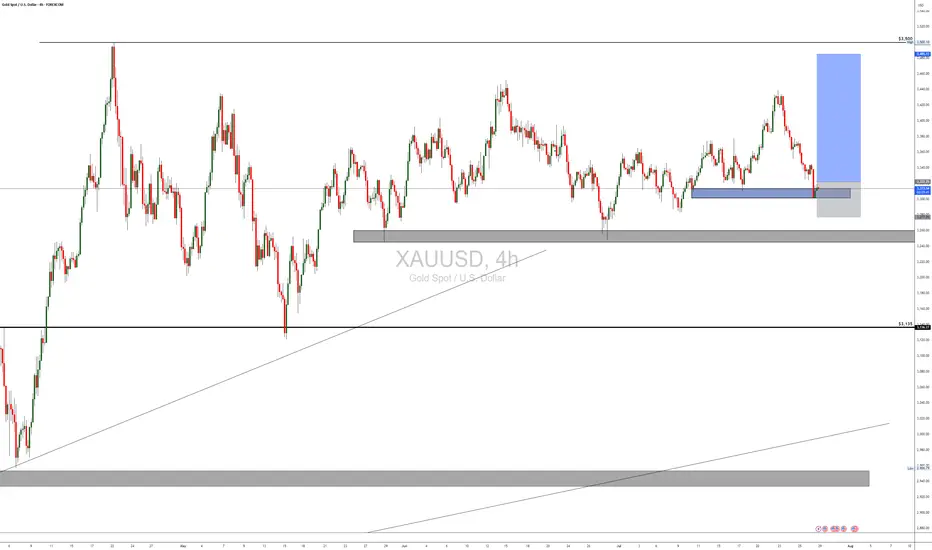
Bearish drop for the Gold?The price is reacting off the pivot and could drop to the 1st support, which is a swing low support that aligns with the 127.2% Fibonacci extension.
Pivot: 3,319.63
1st Support: 3,271.54
1st Resistance: 3,345.37
Risk Warning:
Trading Forex and CFDs carries a high level of risk to your capital and you should only trade with money you can afford to lose. Trading Forex and CFDs may not be suitable for all investors, so please ensure that you fully understand the risks involved and seek independent advice if necessary.
Disclaimer:
The above opinions given constitute general market commentary, and do not constitute the opinion or advice of IC Markets or any form of personal or investment advice.
Any opinions, news, research, analyses, prices, other information, or links to third-party sites contained on this website are provided on an "as-is" basis, are intended only to be informative, is not an advice nor a recommendation, nor research, or a record of our trading prices, or an offer of, or solicitation for a transaction in any financial instrument and thus should not be treated as such. The information provided does not involve any specific investment objectives, financial situation and needs of any specific person who may receive it. Please be aware, that past performance is not a reliable indicator of future performance and/or results. Past Performance or Forward-looking scenarios based upon the reasonable beliefs of the third-party provider are not a guarantee of future performance. Actual results may differ materially from those anticipated in forward-looking or past performance statements. IC Markets makes no representation or warranty and assumes no liability as to the accuracy or completeness of the information provided, nor any loss arising from any investment based on a recommendation, forecast or any information supplied by any third-party.

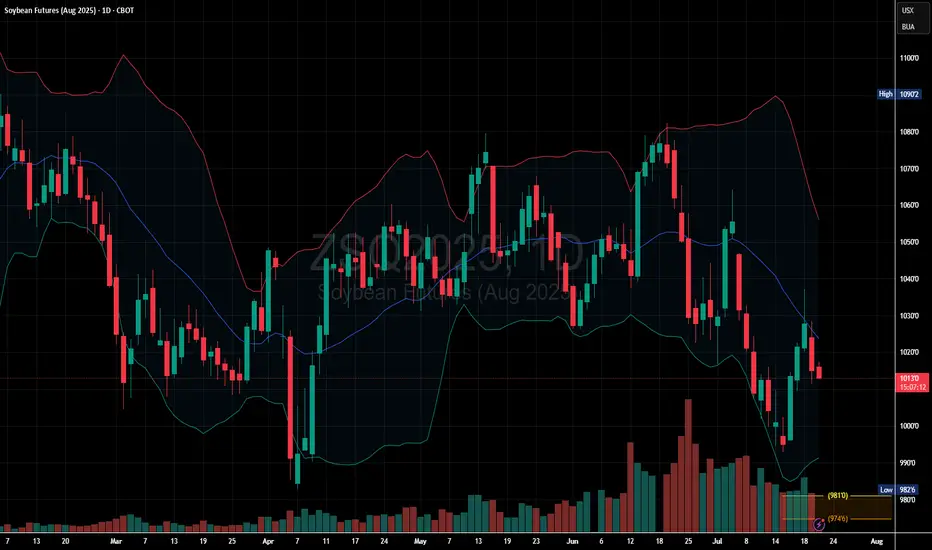
ZSQ2025 Slips Below Mid-Band: Downtrend in Motion
The price is trading below the midline of the Bollinger Bands, indicating weakness and bearish momentum.
Recent candles show lower highs and lower lows, a classic bearish structure.
Price has rejected the midline recently and is leaning back toward the lower band, a common setup in bearish continuations.
XAUUSD approaches a strong buy zoneGold is approaching a strong buy area. Aggressive traders set pending orders whereas cautious ones wait for some confirmation signals in the range of such zones. I expect buyers to push price back up for atleast half day today Follow risk management to enjoy your trading journey.
Target1 3374

Has gold Bottomed Out? Will the Bullishness continue from here?Looking for the bullish activity to continue from here but need to see a sweep and reject of the Previous daily Low before I want to get active. This would give confirmation that the price want to continue with this bullishness.

BUY TRADE SETUP ON XAGUSDCheck this buy trade setup i got on SILVER.
Anticipate a retest of the demands zone at 37.45 zone and plan for a buy entry there.
A Swing Trade Plan.
BUY TRADE SETUP ON XAUUSDA Quick Trade setup on Gold for Gold traders who are crazy about Gold!
Swing Trade.
Check it out!
07/28/25 Trade Journal, and ES_F Stock Market analysis EOD accountability report: +405
Sleep: 5 hours
Overall health: meh
VX Algo System Signals from (9:30am to 2pm)
— 9:00 AM Market Structure flipped bullish❌
— 10:04 AM VXAlgo ES X1 Buy signal! ✅
— 11:21 AM Under 6424, the structure is bearish. Don't avg down! ✅
— 11:40 AMVXAlgo NQ X1 Buy Signal! ✅
— 12:40 PM VXAlgo NQ X1DD Sell Signal! ✅
— 1:30 PM VXAlgo ES X3DD Sell Signal! ✅
What’s are some news or takeaway from today? and What major news or event impacted the market today?
Today was one of the few short the resistance day and refreshing to see after we been grinding ATH (all time highs)
News
Eu trade deal over the weekend,
& china tariff extension.
What are the critical support levels to watch?
--> Above 6395= Bullish, Under 6374= Bearish
