Gold Market Rejected at 3310 as Bearish Channel HoldsGold market faced rejection at 3310, failing to break above the bearish channel, as DXY strength continues to weigh on price action. The inability to sustain above key levels reflects ongoing bearish pressure, unless a clear break occurs.
🔍 Key Insight:
3310 acts as a short-term ceiling
DXY strength supports the bearish stance, follow for more insights coment and boost idea .
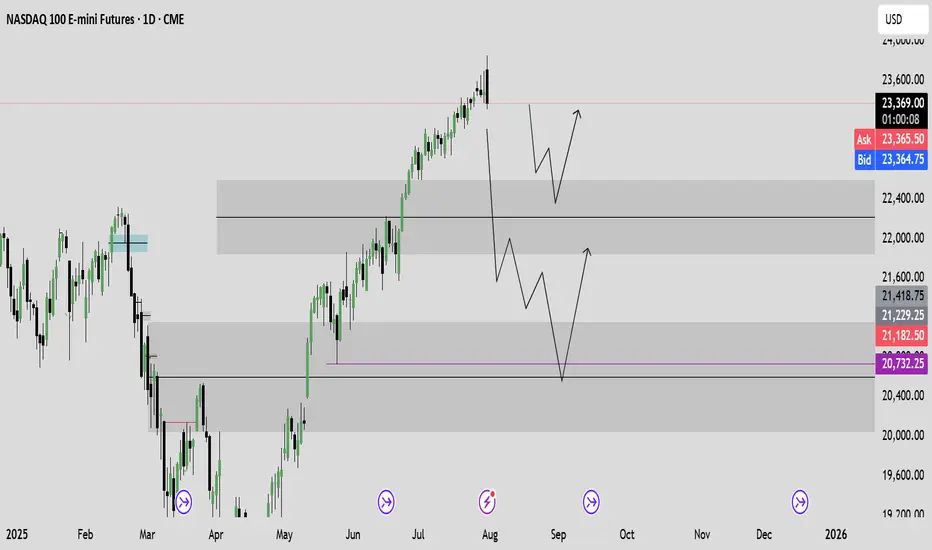
Futures market

The rebound is weak, short orders intervene#XAUUSD
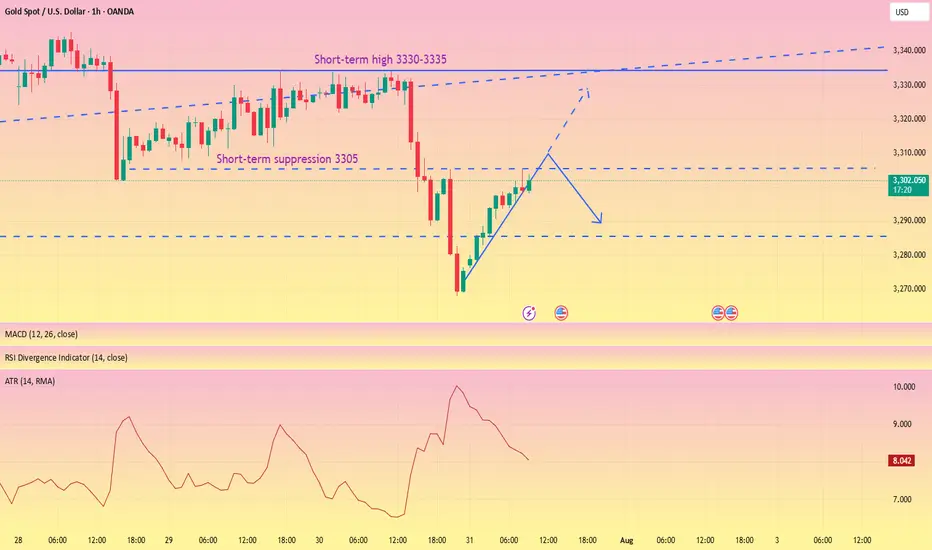
After two consecutive trading days of volatility, gold finally began to fall under pressure near 3335. After breaking through the 3300 mark, the price of gold accelerated its decline, reaching a low of around 3268, and yesterday's daily line closed with a large negative line. 📊
Today's rebound is more likely to be based on the buffering performance of the impact of news. The ATR data also shows that the bullish momentum is slowly weakening in the short term. 🐻After digesting the impact of yesterday's news through rebound during the day, it may fall again in the future.📉
📎The primary focus today is 3305 above, which was also the high point of yesterday's pullback correction. If the gold price rebounds to 3305-3320 and encounters resistance and pressure,📉 you can consider shorting and look towards 3290-3270.🎯
If the short-term gold rebound momentum is strong and breaks through the 3305-3320 resistance area, it will be necessary to stop loss in time. Gold may be expected to touch yesterday's high resistance of 3330-3335, which is the second point to consider shorting during the day.💡
🚀 SELL 3305-3320
🚀 TP 3290-3270
xauusdGold enters support by reaching daily trend line
If gold continues to hold support
Gold is expected to reach its previous high again
XAUUSDXAUUSD breakout falling channle and resistance zone.
Buy above 3295
Stop Loss: 3291
1st TP: 3308
2nd TP: 3313
3rd TP: 3322
4th TP: 3333
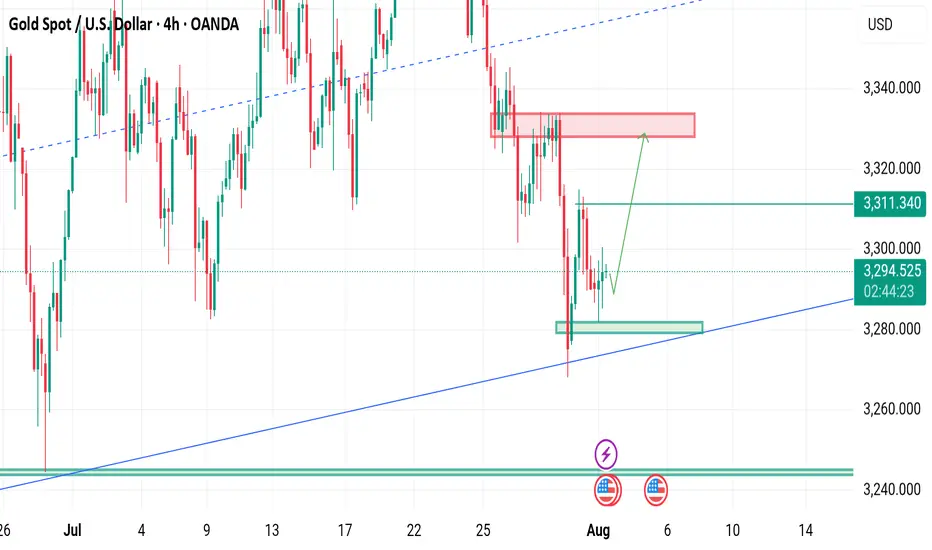
gold on third pattern breakout#XAUUSD have multiple test the third pattern, now price forming needs to breakout the 3308 before any further movement.
Buy entry 3301.4, TP 3308-3323.
Below 3291 holds a very strong bearish continuation, if breakout price will fall till 3269
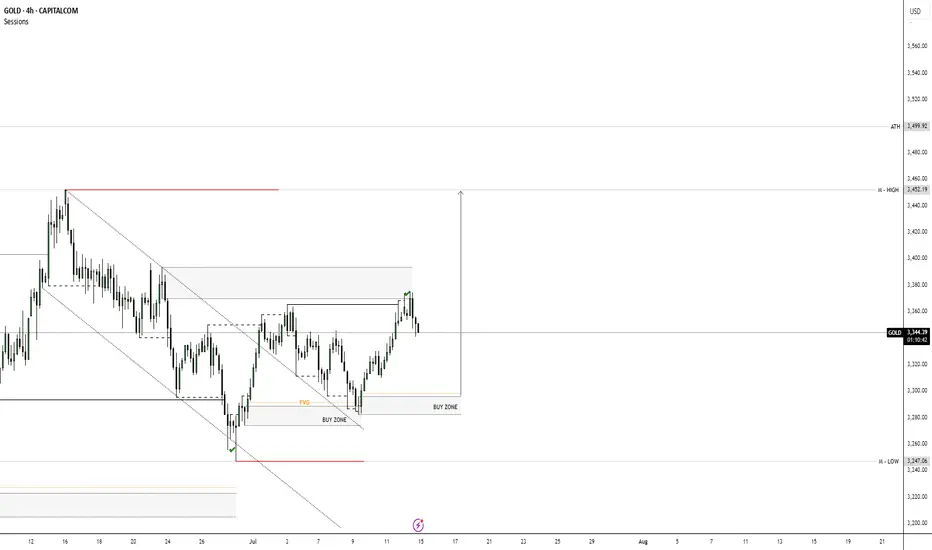
XAUUSD ANALYSYS 💸GOLD💸
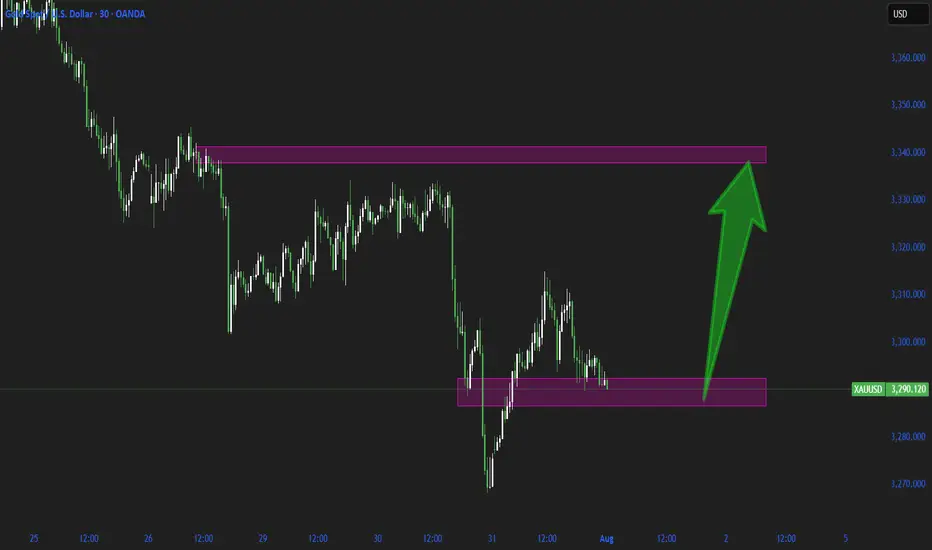
Market Outlook: Bullish
• Price broke out of a downtrend channel and is now forming higher highs and higher lows — clear sign of a trend reversal.
• Current move is a pullback after a strong push up.
⸻
📍 Key Zones:
• Buy Zones and Fair Value Gaps (FVGs) are marked.
• These are areas where buyers may step in again.
• Price is pulling back into these zones — potential long entry area.
⸻
🎯 Target:
• The top red line marks a liquidity zone or resistance.
• Price is likely aiming to reach this area next.
⸻
📈 Trade Setup Idea:
• Buy on pullback to the FVG / Buy Zone.
• Stop Loss: Below the Buy Zone.
• Take Profit: At the previous high (resistance zone).
⸻
⚠️ Risk to Watch:
• If price breaks below the Buy Zone, bullish setup is invalidated — wait for new structure.
XAUUSD – Downtrend Confirmed, Bears in ControlOn the H4 timeframe, gold has completely broken its short-term uptrend structure and formed a series of lower highs and lower lows. Every bounce is rejected at the strong resistance zone of 3,326 – 3,333 USD, confirming the clear downtrend.
Although the recently released Core PCE index was lower than expected, this is not enough to drive a recovery as other data, such as the Employment Cost Index and statements from the Fed, still show persistent inflationary pressure. Therefore, the monetary policy remains hawkish, causing money to flow out of gold.
Currently, the price is approaching the critical support zone of 3,247. If this level is broken, the scenario of further declines to 3,192 is entirely possible.

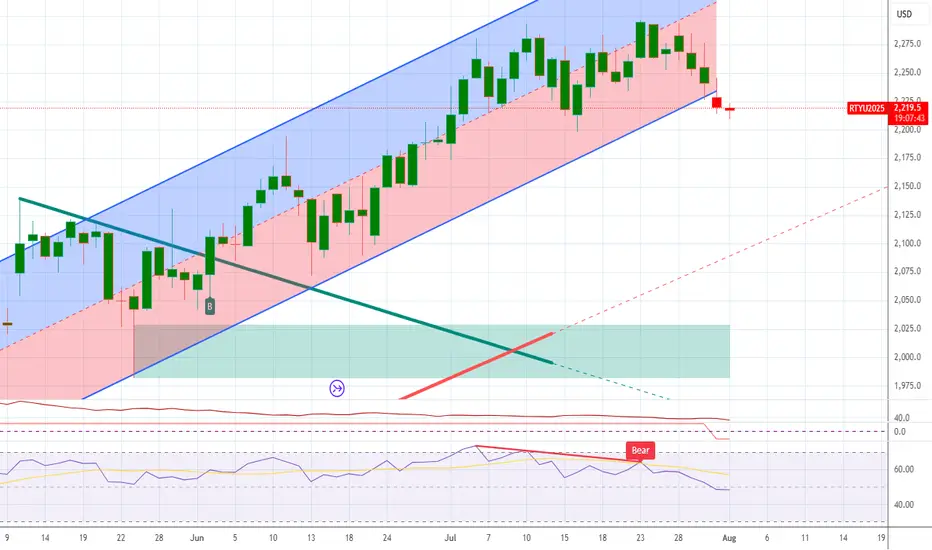
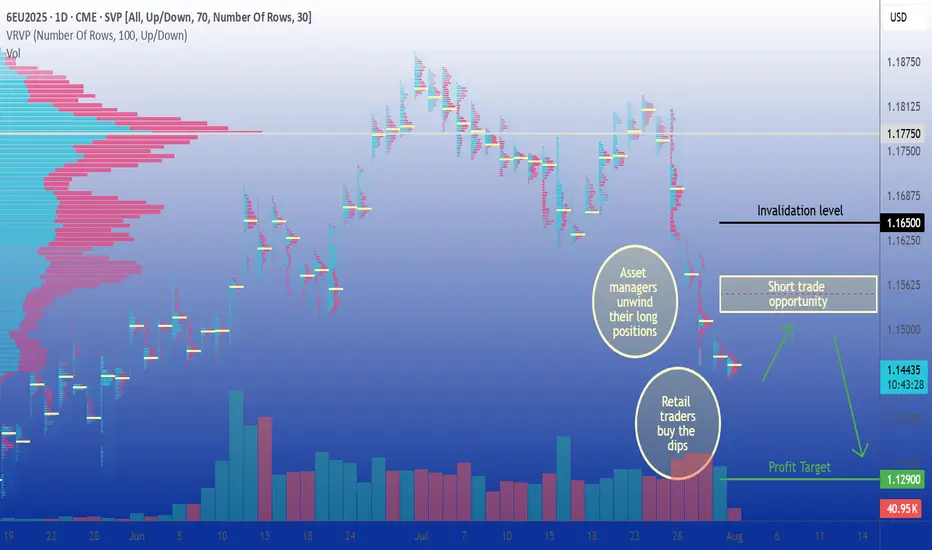
Tactical Short Setup on EURThe September 2025 Euro FX futures contract (E6U25) is currently trading around 1.1440 after topping out near 1.19 the 1st of July. This decline reflects a broader market repricing, driven by evolving expectations around monetary policy from the Federal Reserve and the European Central Bank, softening Eurozone growth prospects, and a technical backdrop that has turned decisively bearish. Coupled with shifts in sentiment and options market positioning, the current setup presents an opportunity to initiate a tactical short with an attractive risk-reward profile.
Fundamental Analysis – Central banks and diverging momentums
Monetary policies on either side of the Atlantic appear to diverge. The Federal Reserve has kept its federal funds rate steady in the 4.25%–4.50% range since December 2024, resisting political pressure to ease. In contrast, the European Central Bank has gradually lowered its deposit rate from 4% to 2.00% since mid-2024 and maintained that level in July, considering inflation is now back to its 2% target. This has widened the yield differential in favor of the U.S. dollar.
Forward guidance from both central banks suggests a cautious stance. The Fed’s June 2025 dot plot anticipates a modest rate cut by year-end, though FOMC members remain divided. Meanwhile, the ECB projects subdued inflation and modest growth, implying no urgency for further easing.
On the macro front, U.S. GDP rebounded sharply in Q2 (+3.0% annualized), though driven largely by a collapse in imports. Domestic demand and job creation have slowed, and tariffs may push core inflation above 3% again. In the eurozone, Q2 GDP barely expanded (+0.1%), with uneven performance across member states. Inflation is stable at 2%, with core pressures easing. Altogether, the dollar retains a slight edge amid firmer data and a more hawkish Fed.
Technical Outlook – Bearish shift with volume confirmation
From a technical standpoint, the E6U25 contract has clearly broken down from its prior range. The area around 1.1775, which previously served as a high-volume node and resistance, was breached with strong downside momentum. The price action has since carved out a clean pattern of lower highs and lower lows, and volume has notably increased on bearish sessions, confirming the shift in control.
The current structure suggests a vacuum between 1.1775 and 1.1500, with only minor resistance expected around 1.1545, where some residual volume lies. There is little to no support before the 1.1280–1.1300 area, which aligns with a lower volume shelf on the visible range volume profile (VRVP). If price retraces to retest the 1.1525–1.1575 zone, that area is likely to act as a tactical selling opportunity before potentially resuming the downtrend.
Sentiment Analysis
CFTC data as of late July shows asset managers holding a substantial long position in EUR/USD, though these are beginning to unwind. The positioning profile leaves the euro vulnerable to further long liquidation if the selloff deepens.
Retail sentiment reinforces this view, as most retail traders are caught on the wrong side of the move. Open interest is stable but elevated, and trading activity has begun to rise slightly, hinting at retail dip-buying that may lack conviction. No major retail capitulation has occurred yet.
Broad market volatility remains subdued, and EUR/USD-specific indicators show a similar picture. The CME CVOL Index for EUR/USD remains around 8, a level considered moderately low by historical standards, reflecting a calm, non-disruptive market environment that favors technical trading, including respect for resistance levels and trend-following strategies.
Options Analysis
According to the CME FX Options Vol Converter, the landscape for EUR/USD still exhibits a modest downside bias. Risk reversals across one to three months tenors remain slightly negative, reflecting moderate demand for euro puts.
In listed markets, CME data for August expiries shows notable open interest concentration in puts at the 1.1450 and 1.1500 strikes, with deltas indicating directional positioning rather than purely hedging activity. On the call side, interest is more dispersed but visible above 1.1650, particularly at 1.1700 and 1.1750, suggesting some appetite for upside. However, the deltas are lower.
Trade Idea
A tactical short trade is favored in the 1.1525–1.1575 zone, which coincides with a potential pullback level within a well-established downtrend. This level also aligns with a minor volume shelf, providing a natural resistance area where sellers are likely to re-enter the market.
The suggested stop level is 1.1650, just above the recent short-term swing highs, which would invalidate the current bearish structure. The target lies around 1.1290, near the next major support zone and volume cluster.
Final thoughts
The EUR/USD rally in May/June was primarily fueled by expectations of synchronized easing and softer U.S. data. However, the Fed’s reluctance to commit to a cut, combined with a relatively more aggressive ECB stance, has shifted the narrative back in favor of the dollar. With asset managers showing signs of willingness to further unwind their exposure, combined with sentiment indicators pointing to complacency, a deeper retracement remains plausible.
The technical breakdown, lack of implied vol support for a rebound, and fresh open interest on euro puts collectively argue for tactical downside continuation. The proposed trade seeks to capture that move with a controlled stop and a realistic price target. Unless EUR/USD can reclaim the 1.1650–1.1700 zone decisively, the path of least resistance remains downward.
---
When charting futures, the data provided could be delayed. Traders working with the ticker symbols discussed in this idea may prefer to use CME Group real-time data plan on TradingView: tradingview.com/cme/ .
This consideration is particularly important for shorter-term traders, whereas it may be less critical for those focused on longer-term trading strategies.
General Disclaimer:
The trade ideas presented herein are solely for illustrative purposes forming a part of a case study intended to demonstrate key principles in risk management within the context of the specific market scenarios discussed. These ideas are not to be interpreted as investment recommendations or financial advice. They do not endorse or promote any specific trading strategies, financial products, or services. The information provided is based on data believed to be reliable; however, its accuracy or completeness cannot be guaranteed. Trading in financial markets involves risks, including the potential loss of principal. Each individual should conduct their own research and consult with professional financial advisors before making any investment decisions. The author or publisher of this content bears no responsibility for any actions taken based on the information provided or for any resultant financial or other losses.
NFP ON DECK TODAY Gold is currently holding the Range of 3275-3310.
What's possible scanarios we have?
we have NFP data on deck today, expect potential volatility.
Until the release, gold may continue to range between 3275 and 3315.
This trade is totally unexpected how can gold react on numbers.
•If the H4 & D1 chart breaks below 3270, we could see a further drop toward the 3250 zone.
• Ifthe H4 & D1 chart flips above 3310, we could see a further Upside climb the 3335 -3345 zone.
Stay alert. Key levels in play.
#XAUUSD
XAU/USD 01 August 2025 Intraday AnalysisH4 Analysis:
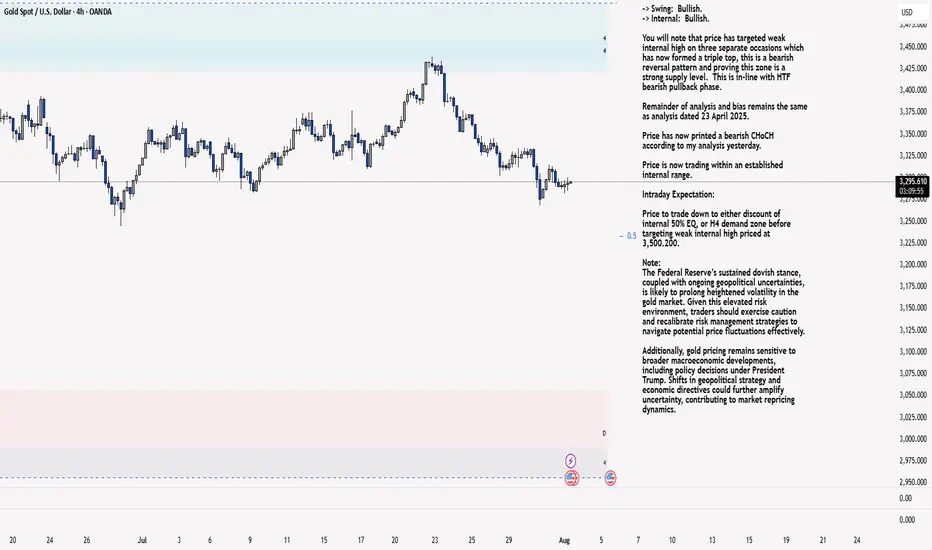
-> Swing: Bullish.
-> Internal: Bullish.
You will note that price has targeted weak internal high on three separate occasions which has now formed a triple top, this is a bearish reversal pattern and proving this zone is a strong supply level. This is in-line with HTF bearish pullback phase.
Remainder of analysis and bias remains the same as analysis dated 23 April 2025.
Price has now printed a bearish CHoCH according to my analysis yesterday.
Price is now trading within an established internal range.
Intraday Expectation:
Price to trade down to either discount of internal 50% EQ, or H4 demand zone before targeting weak internal high priced at 3,500.200.
Note:
The Federal Reserve’s sustained dovish stance, coupled with ongoing geopolitical uncertainties, is likely to prolong heightened volatility in the gold market. Given this elevated risk environment, traders should exercise caution and recalibrate risk management strategies to navigate potential price fluctuations effectively.
Additionally, gold pricing remains sensitive to broader macroeconomic developments, including policy decisions under President Trump. Shifts in geopolitical strategy and economic directives could further amplify uncertainty, contributing to market repricing dynamics.
H4 Chart:
M15 Analysis:
-> Swing: Bullish.
-> Internal: Bullish.
H4 Timeframe - Price has failed to target weak internal high, therefore, it would not be unrealistic if price printed a bearish iBOS.
The remainder of my analysis shall remain the same as analysis dated 13 June 2025, apart from target price.
As per my analysis dated 22 May 2025 whereby I mentioned price can be seen to be reacting at discount of 50% EQ on H4 timeframe, therefore, it is a viable alternative that price could potentially print a bullish iBOS on M15 timeframe despite internal structure being bearish.
Price has printed a bullish iBOS followed by a bearish CHoCH, which indicates, but does not confirm, bearish pullback phase initiation. I will however continue to monitor, with respect to depth of pullback.
Intraday Expectation:
Price to continue bearish, react at either M15 supply zone, or discount of 50% internal EQ before targeting weak internal high priced at 3,451.375.
Note:
Gold remains highly volatile amid the Federal Reserve's continued dovish stance, persistent and escalating geopolitical uncertainties. Traders should implement robust risk management strategies and remain vigilant, as price swings may become more pronounced in this elevated volatility environment.
Additionally, President Trump’s recent tariff announcements are expected to further amplify market turbulence, potentially triggering sharp price fluctuations and whipsaws.
M15 Chart:
Gold continues to go long in the 3280-3300 range.Gold continues to go long in the 3280-3300 range.
Today, we remain firmly bullish on a bottom in the 3280-3300 range.
On August 1st, the Federal Reserve, while keeping interest rates unchanged, acknowledged slowing economic growth, triggering a repricing of expectations for a rate cut.
This led to a rebound in gold prices, but of course, this was just a pretext for the price increase.
Recently, gold prices experienced a four-day decline (July 23-28), falling from $3431 to $3268, as progress in trade negotiations and a rebound in the US dollar dampened safe-haven demand.
Non-farm Payrolls
Here are the key takeaways:
Today's US July non-farm payrolls data (expected to increase by 110,000, compared to 147,000 previously) will determine expectations for a September rate cut by the Federal Reserve.
A weak reading (e.g., below 100,000) could push gold prices back towards $3,400;
A strong reading (above 150,000) would remain bearish for gold. Gold prices continue to decline, and we are long in the 3280-3300 range.
Today, we remain firmly bullish on gold bottoming in the 3280-3300 range.
On August 1st, the Federal Reserve, while keeping interest rates unchanged, acknowledged slowing economic growth, triggering a repricing of rate cut expectations in the market.
This led to a rebound in gold prices, but of course, this was just a pretext for the price increase.
Recently, gold prices experienced a four-day decline (July 23-28), falling from $3431 to $3268, as progress in trade negotiations and a rebound in the US dollar dampened safe-haven demand.
Non-farm Payroll Data
Here are the key takeaways:
Today's US July non-farm payroll data (expected to increase by 110,000, compared to 147,000 previously) will determine expectations for a September rate cut by the Federal Reserve. A weak reading (e.g., below $100,000) could push gold back to $3,400.
A strong reading (above $150,000) would continue to be bearish for gold.
Technical Analysis and Trading Recommendations
Key Levels:
Support:
$3,270 (100-day moving average)
$3,248 (June low);
Resistance:
$3,300 psychological level
$3,340 (21-day/50-day moving average crossover).
Trading Strategy:
Short-term:
1: If the price holds above $3,300, initiate a long position with a target of $3,330-3,350.
2: If the price falls below $3,270, a drop to $3,248 is possible.
3: Focus on the key watershed at $3,300
4: Key Point:
As long as the gold price is above $3,300, I believe it's a good time to buy the dip. Following the upward trend in gold prices is a very wise choice.
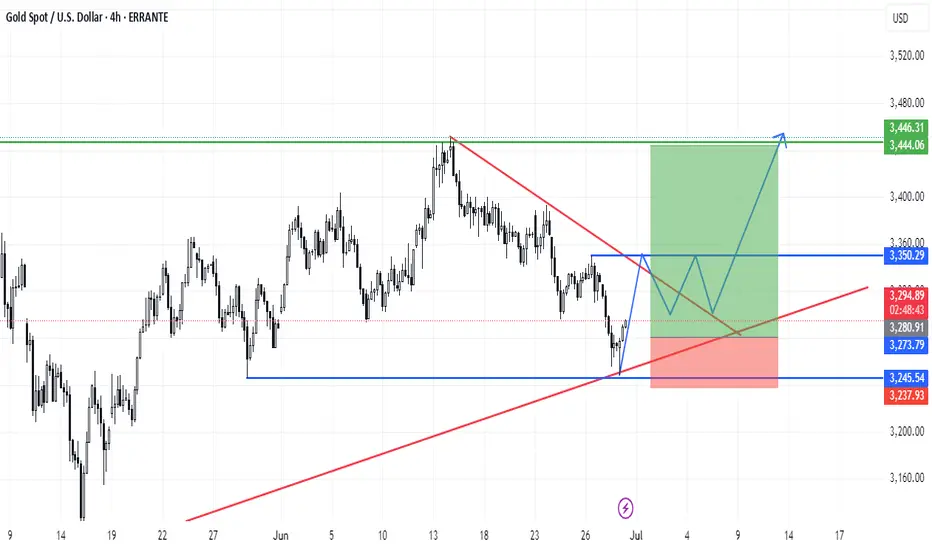
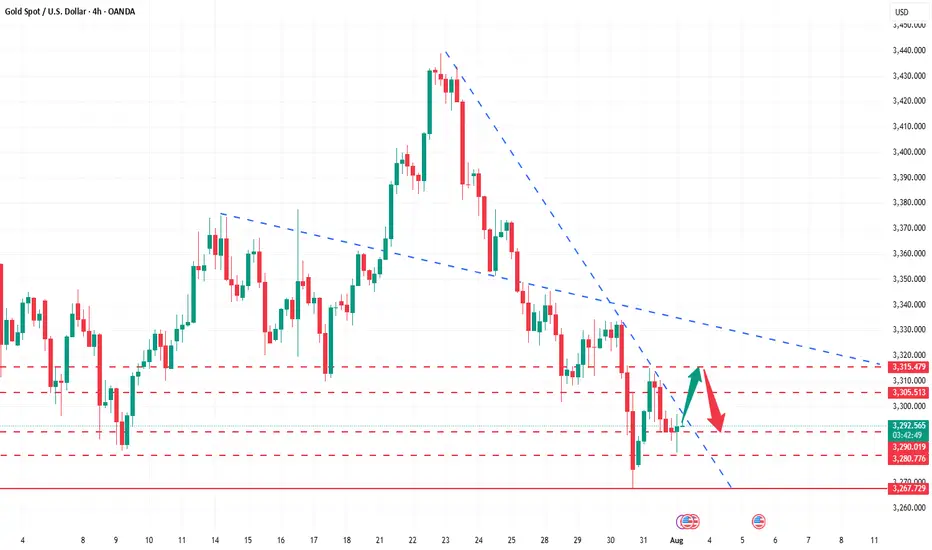
As shown in Figure 4h:
The potential for gold prices to rebound is becoming increasingly clear.
The lower edge of the wide fluctuation range is slowly stabilizing.
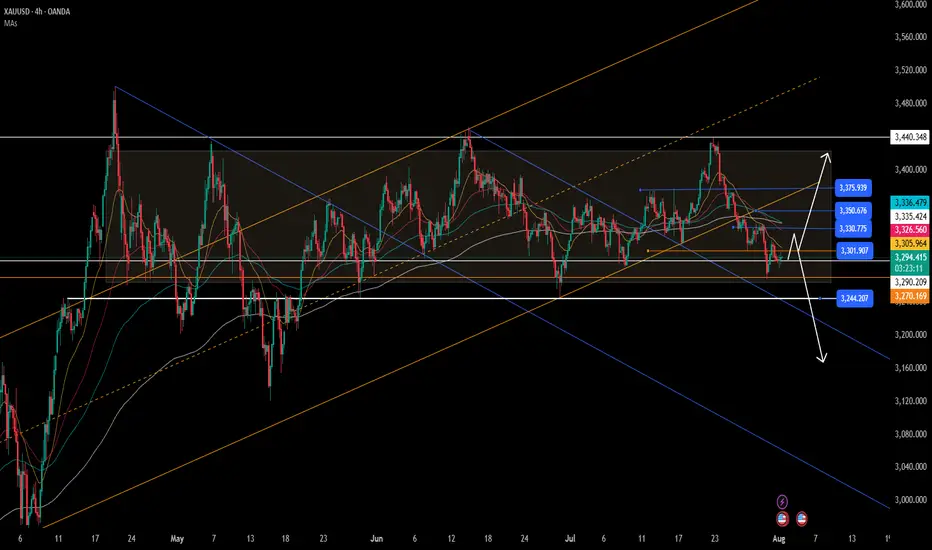
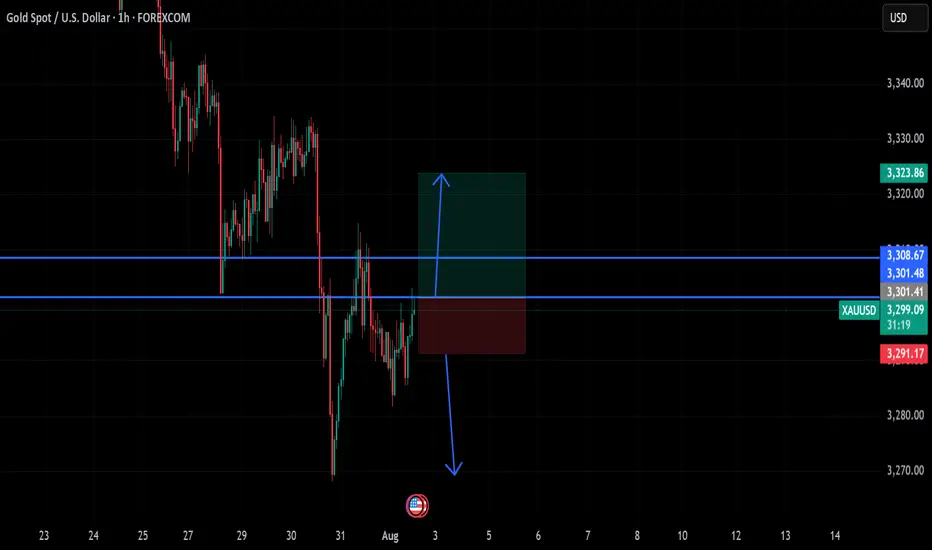
Market Expectations for Gold (XAU/USD)Gold is currently in a very critical zone, and in my view, it has room to rise toward the 3339–3345 level.
Once that zone is touched, I expect another drop to follow.
GOLD in 15minHello to all traders. 😎😎
I hope all your deals will hit their targets. 🎉🎉
After yesterday's heavy drop on the last day of July. We had a weak growth.
I think the price will retest $3300 and we will have another drop to the $3280 area. Look for short positions in the $3300 area.
Remember that this is an analysis and be sure to do money management when trading.
What Do You Think?
Which scenario do you think is happen? **Share your thoughts!** ⬇️
Don't forget that this is just an analysis to give you an idea and trade with your own strategy. And don't forget the stop loss🛑🛑🛑
❤️❤️❤️The only friend you have in financial markets is your stop loss❤️❤️❤️
Please support me with your ✅' like'✅ and comments to motivate me to share more analysis with you and share your opinion about the possible trend of this chart with me 🙏😊
Be Happy , Ali Jamali
Impact of the Non-Farm Payrolls? Latest Analysis.Information Summary:
Most traders are turning their attention to the crucial US labor market report, which is being closely watched as the market actively searches for new clues regarding the timing of the next interest rate cut this year.
The July non-farm payrolls report will be released at 8:30 AM US time. US non-farm payrolls increased by 110,000 in July, seasonally adjusted, lower than the 147,000 increase in June. The US unemployment rate is expected to rise from 4.1% to 4.2% in July.
If the non-farm payrolls figure falls below 100,000 and the unemployment rate rises, it could signal a weakening job market, undermining the Fed's rekindled hawkish outlook and dampening the dollar's upward momentum. In this scenario, gold prices could re-cross the 3,400 mark. However, if the non-farm payrolls unexpectedly exceed 150,000, it could support the dollar's continued rise and hurt gold. Strong US employment data could rule out two rate cuts from the Fed this year.
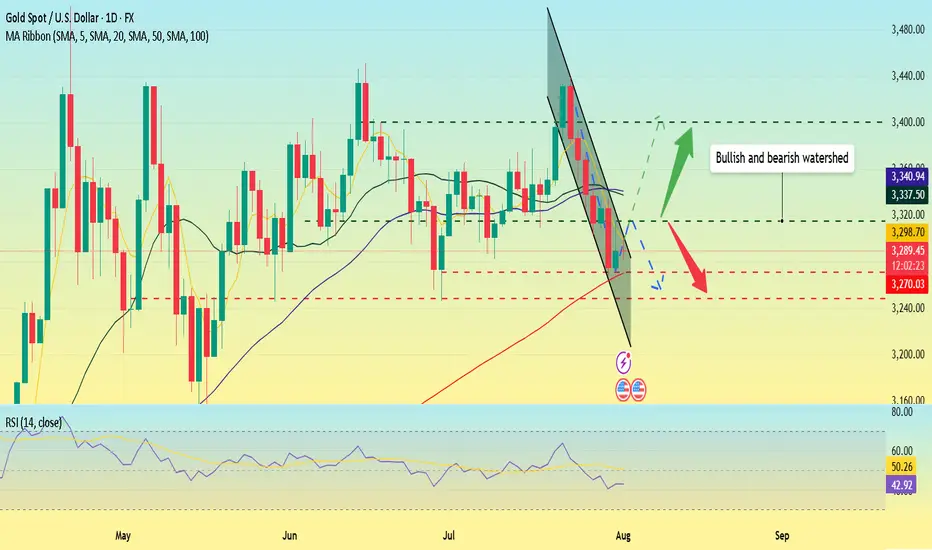
Market Analysis:
Quaid believes that the current moving average crossover is trending downward, and downward momentum is still in play. The RSI remains at 42.7, hovering below the midline, indicating that gold's downward trend remains intact. The 20-day moving average fell below the 50-day moving average on Wednesday, confirming the bearish momentum.
Therefore, if gold closes below the key support level of the 100-day moving average at $3,270 on a weekly basis, a new downtrend could begin, potentially leading to a drop towards the June 30 low of $3,248.
Quaid believes that the current bull-bear watershed needs to focus on around 3315, which is the previous intensive trading area and is also the first resistance position for short-term upward movement.
On the last trading day of Super Data Week, Quaid hopes that everyone has gained something and has a happy weekend; I wish you all good luck.
How to correctly grasp the gold trading opportunities?Yesterday, gold prices saw a technical rally amidst volatile trading, followed by a downward trend under pressure. Bulls strongly supported a rebound at 3280 in the Asian session. The European session saw an accelerated upward move, breaking through 3314 before retreating under pressure. We also precisely positioned short positions below 3315, achieving a perfect target of 3290-3295. During the US session, the market again faced pressure at 3311, weakening in a volatile trend before breaking through 3300. The daily chart ultimately closed with a medium-sized bullish candlestick pattern, followed by a pullback and then a decline.
Overall, after yesterday's rebound, gold prices remain under pressure at the key resistance level of 3314. The short-term bearish weakness line has moved down to this level. If pressure continues in this area in the short term, gold will maintain a weak and volatile structure, with intraday trading remaining focused on rebounds and upward moves. If you are currently experiencing confusion or unsatisfactory trading strategies, please feel free to discuss your options and help avoid investment pitfalls.
From a 4-hour analysis perspective, focus on resistance at 3305-3315 on the upside. A rebound to this level is a good opportunity to short against resistance. Focus on support at 3280-3270 on the downside. Unless the price stabilizes strongly, consider not entering long positions below this level. The overall strategy remains to short on rebounds, with the same rhythm. I will provide timely notifications of specific levels from the bottom, so keep an eye on them.
Gold Trading Strategy: Short on rebounds near 3305-3315, with targets at 3290-3280-3270.
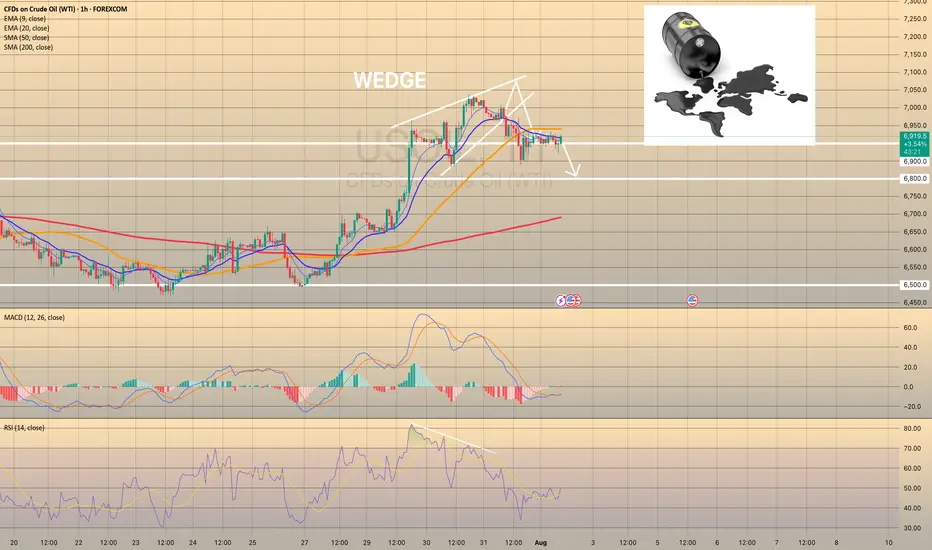
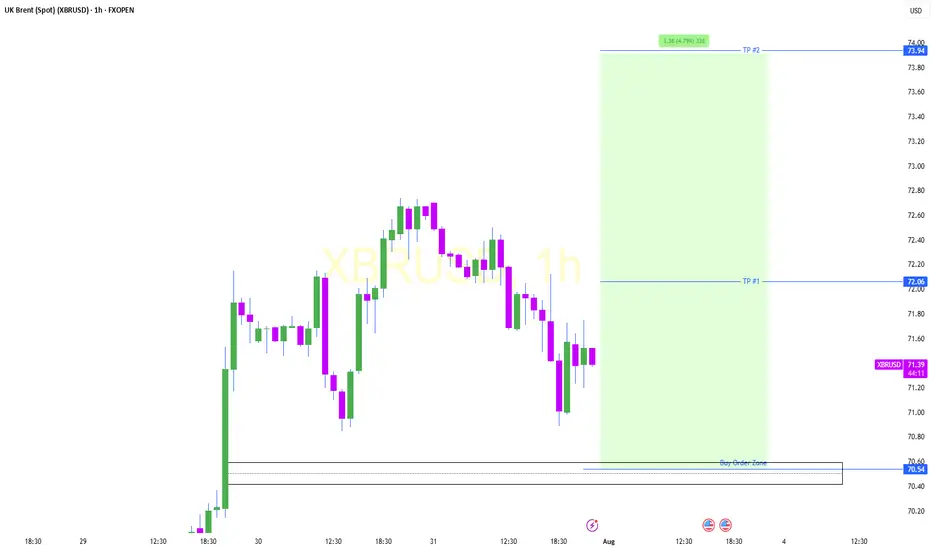
USOIL REACHED THE 6,900.00 SUPPORT LEVEL. WHAT'S NEXT?USOIL REACHED THE 6,900.00 SUPPORT LEVEL. WHAT'S NEXT?
As we told July 31, the price got reversed towards first support level of 6,900.00. Market participants are waiting for the OPEC+ meeting this week, expecting a significant output hike. Currently, the price sits slightly above the support level. Although, the asset trades above this level, considering the current weakness of the asset, further decline is expected. The 6,800.00 support level is the next target here.
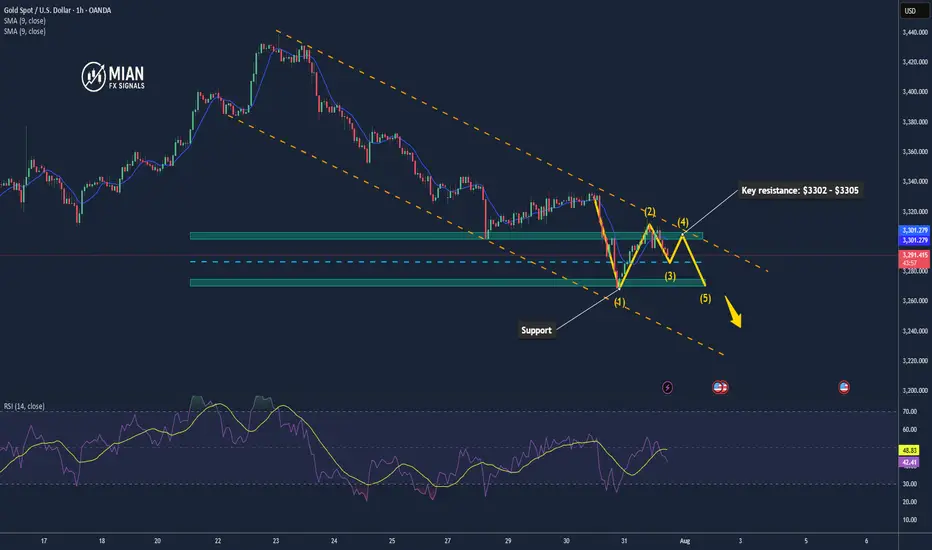
GOLD REMAINS UNDER PRESSURE AFTER U.S. INFLATION DATA📊 Market Overview:
Gold is trading around $3294, down from $3311 earlier after U.S. Core PCE and Employment Cost Index came in as expected — reinforcing the Fed's hawkish stance. A stronger dollar and rising Treasury yields continue to weigh on gold.
📉 Technical Analysis:
• Key resistance: $3302 – $3305
• Nearest support: $3285 – $3275
• EMA09 (H1): Price is below the 9-period EMA → short-term trend remains bearish
• Candlestick / volume / momentum: After the sharp drop, price is consolidating between $3293–$3298 with low volume. Failure to break above $3302 may trigger further downside. RSI near 45 suggests room for more selling.
📌 Outlook:
Gold may continue to decline in the short term if it fails to reclaim $3302 and the dollar remains strong through the Asian and European sessions.
💡 Suggested Trade Setup:
🔻 SELL XAU/USD: $3296 – $3298
🎯 TP: $3280 / $3275
❌ SL: $3305
🔺 BUY XAU/USD: $3275 – $3278 (if reversal candle appears)
🎯 TP: $3295
❌ SL: $3270
BuyLondon Session
Daily Volume
Untapped Zone
Market Structure
NT:: Limit order must be tapped before the breach of the red line
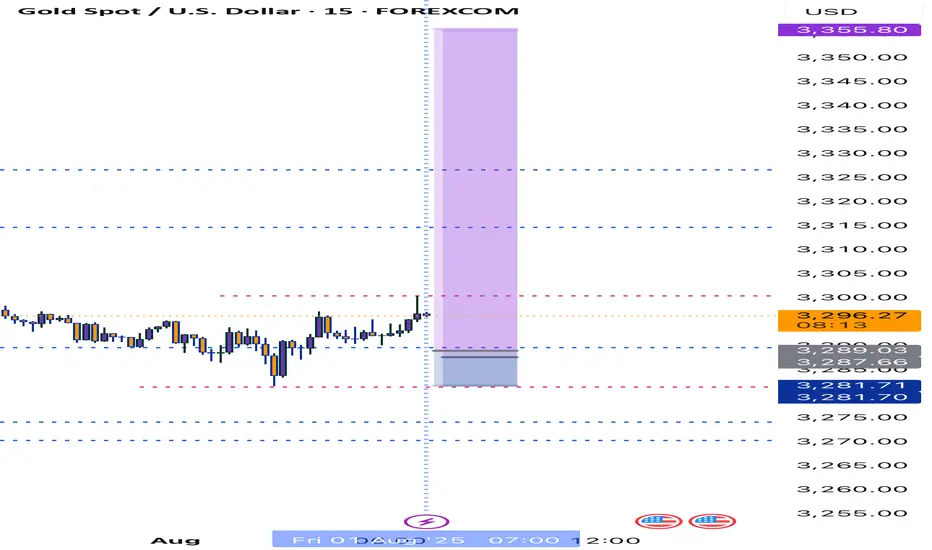
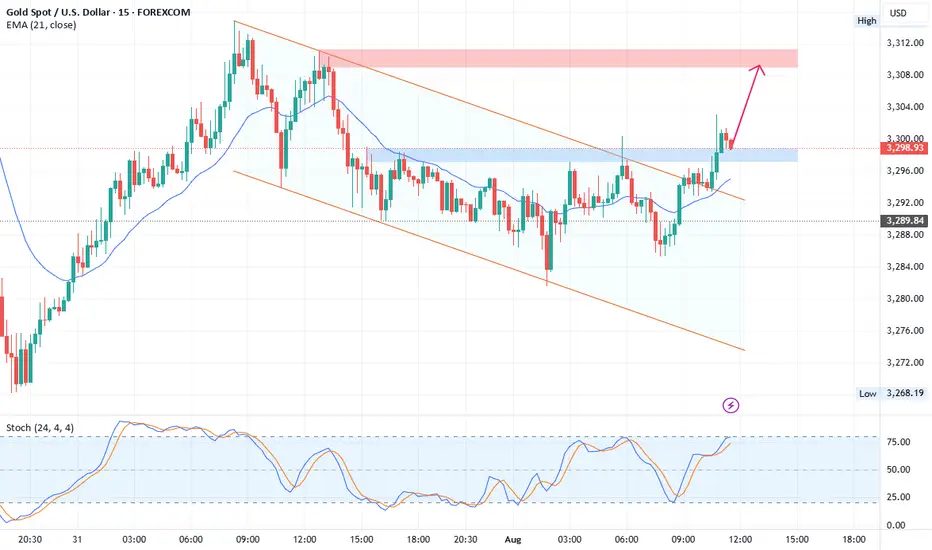
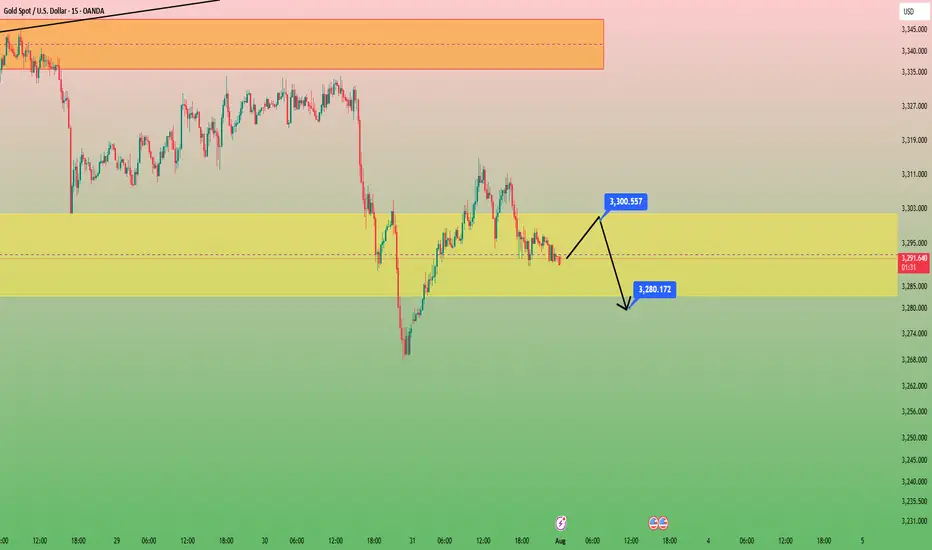
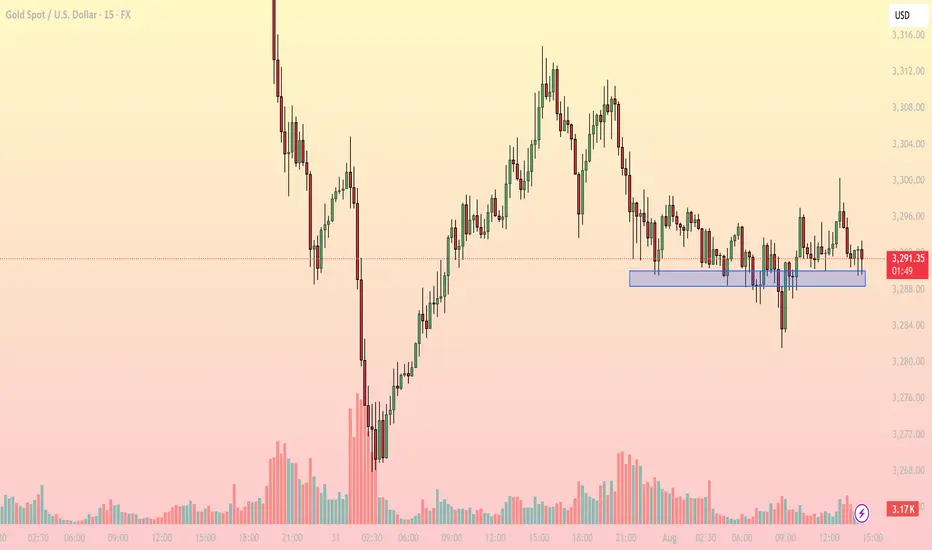
Gold consolidates near key support – What's next for?1. Market Overview
On the 15-minute chart, XAUUSD is trading around 3,290–3,292 USD, hovering just above a critical intraday support zone at 3,287–3,289 USD (highlighted in blue). This area has repeatedly provided a bounce in recent sessions, indicating persistent buying interest.
The current price action reflects sideways movement within a narrow range (3,287–3,296 USD), and notably, declining volatility, as shown by reduced candle range and trading volume.
2. Technical Breakdown
EMA: Price is moving around the EMA20 and EMA50, reflecting indecision and lack of directional momentum.
RSI (inferred): Likely hovering near the neutral 50–55 zone, confirming a balanced market.
Trendline: A descending series of lower highs from the 3,312 peak suggests bearish pressure, though buyers still defend key support.
Fibonacci: The 3,287 USD zone aligns with the 61.8% Fibonacci retracement level, reinforcing its strength as a bounce area.
3. Key Levels to Watch
3,287–3,289: Support - Repeated reactions here – key demand zone
3,296: Immediate resistance - Needs breakout to confirm bullish move
3,302: Next resistance - Breakout target – short-term top
3,275: Deeper support - Retest level if support breaks
4. Trading Strategy Scenarios
🔹 Scenario 1 – Long setup at support
Entry: 3,287–3,289 (wait for bullish reaction like pin bar or engulfing)
Stop Loss: Below 3,284
TP1: 3,296 | TP2: 3,302
🔹 Scenario 2 – Short setup on breakdown
Entry: Below 3,284 (after clear bearish candle close)
Stop Loss: 3,288
TP1: 3,275 | TP2: 3,268
5. Conclusion
Gold is in a tug-of-war at a sensitive support zone. Whether bulls defend or bears break below will set the tone for the rest of the session. Focus on price reaction around 3,287 to determine direction – avoid blind predictions.
Make sure to follow for more live strategies as the New York session unfolds – and save this post if you find it helpful!
What’s your view on this support zone? Let’s discuss below!
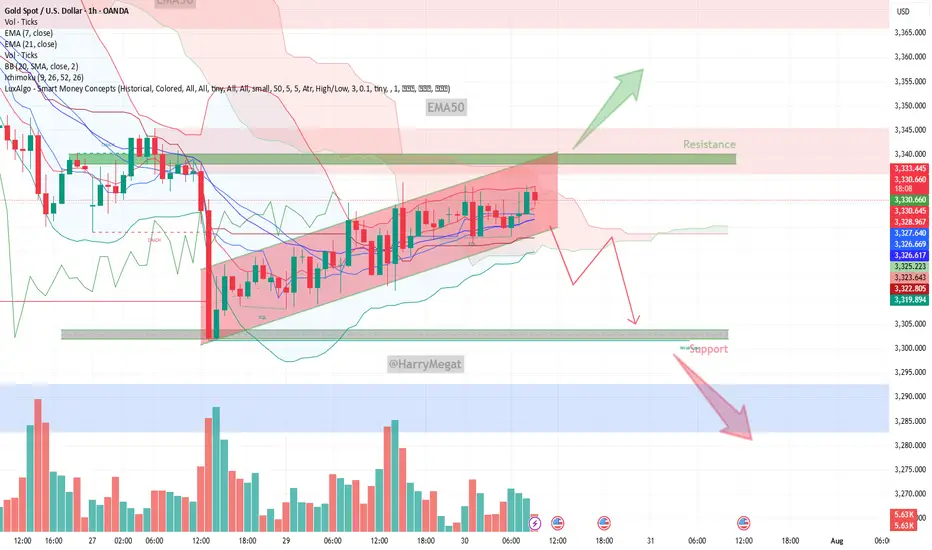
Gold (XAU/USD) on the 1‑hour timeframeGold (XAU/USD) on the 1‑hour timeframe
Chart Structure & Bias
* Price remains trapped in a **rising channel** (\~\$3,328–3,333), pressing against resistance near **\$3,340–3,345**.
* Short-term momentum is bearish: both EMA 7 and EMA 21 sit above current price, with declining volume signaling weakening buyer strength.
* Overall trend leans neutral‑to‑bearish until market clears key zones decisively.
Trade Scenarios
**Bearish Breakdown (Preferred)**
* **Trigger:** Break and close below channel support (\~\$3,326).
* **Targets:** Initial drop toward **\$3,320**, then **\$3,300**, and possibly lower if momentum intensifies.
* **Invalidation:** Price pushes back above **\$3,333–3,335**, negating bearish structure.
**Bullish Breakout (Conditional)**
* **Trigger:** Clean breakout and sustained close above **\$3,342–3,345**.
* **Targets:** Upward stretch toward **\$3,355–3,360**, and if strong, **\$3,367–3,375+**.
* **Invalidation:** Fails to hold structure—retesting from above back beneath **\~\$3,338**.
Macro Drivers & Market Conditions
* Caution prevails pre‑Fed decision and ADP / GDP releases—market awaits cues on interest rate direction.
* Safe‑haven demand has softened as global trade sentiment improves, while U.S. dollar strength continues to cap upside in gold.
* Analysts favor **sell‑on‑rise positioning**, bumping up potential for controlled pullbacks.
Verdict
Gold is consolidating in a tight upward channel, showing short-term bearish pressure. The **bearish breakdown scenario holds the edge** unless price convincingly clears above **\$3,345** on strong volume, which could flip bias. A confirmed break below **\$3,326** sets the stage for downward moves toward **\$3,300** or lower.