DXY Just Broke Through the Lock… Where’s the Market Headed Now?🌅 Good Morning, Friends!
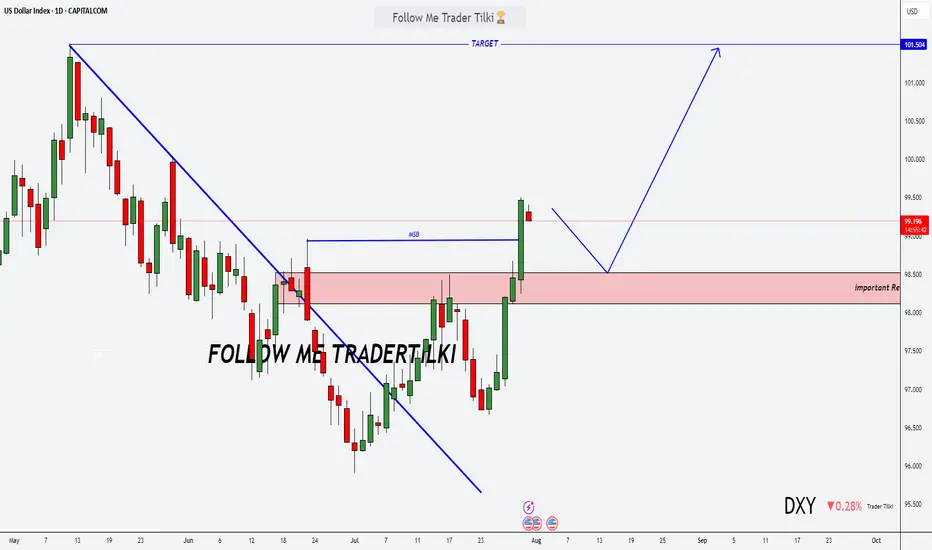
A few days ago, I marked 98.950 as a key threshold for the DXY index. As of today, that level has officially been broken—and the bullish momentum we anticipated is now kicking in. 📈
The next target? 101.000.
That said, it’s crucial to remember: DXY is heavily influenced b
Market indices
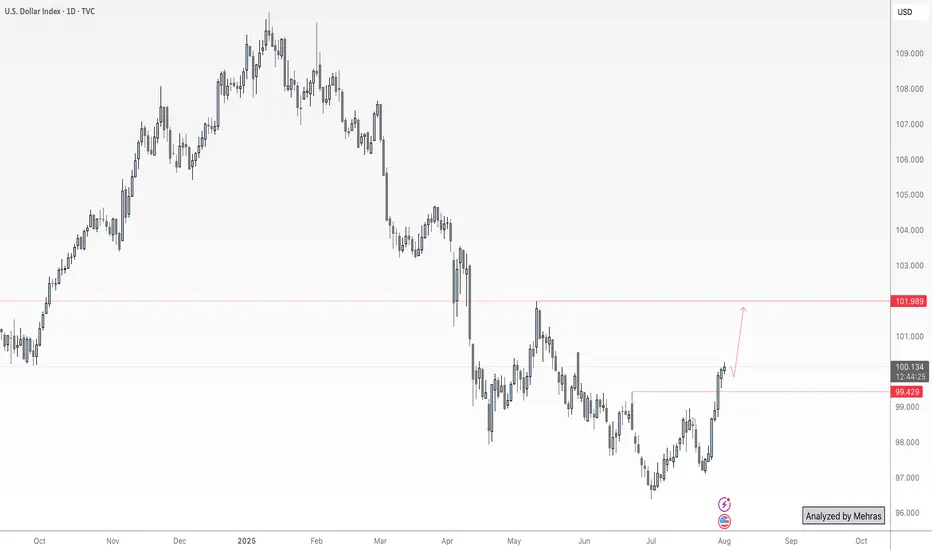
NFP Volatility Ahead – Is the Dollar Ready to Break Higher?🟢 DXY Outlook – A Key Day for the Dollar Index
Yesterday’s monthly candle closed with strong bullish momentum, marking a powerful start to August. Today, on the first trading day of the month, we’re expecting three major U.S. economic releases:
NFP, Average Hourly Earnings (m/m), and the Unemployme
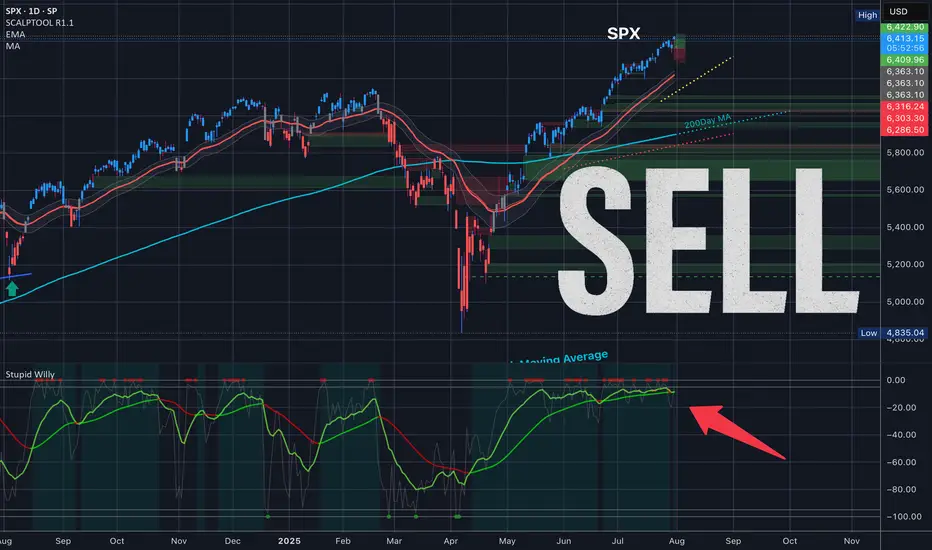
$SPY $SPX SELLIt is time. For SPX today I sold SP:SPX 6420/6435 bear call spreads here. First order filled for 7.20, Back up orders at 6430/6445.
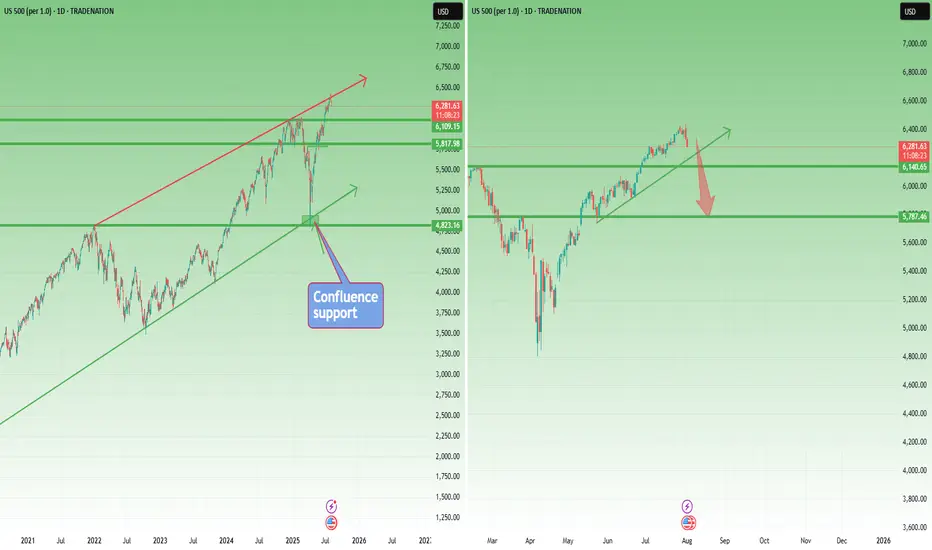
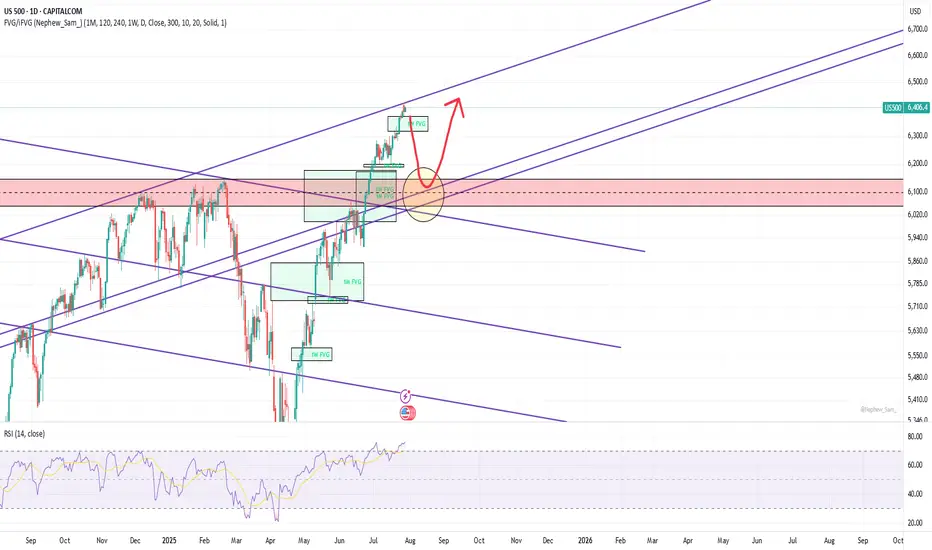
Correction Ahead? SP500 Prints Reversal Signal at Key Resistance📘 This market moves like a textbook chart
SP500 is acting like a perfect case study from a trading manual. Back in early April, the index dipped just below 5,000, right into a confluence support zone ( I had spoken about this at the time ) – formed by the long-term ascending trendline and the 202
S&P 500 Obeying Elliott Wave TheoryThis is an update of a previous publication. A Flat occurred for Wave 2(Green) and if Wave 3 is over, we can expect a Zigzag for Wave 4. Zigzags have 3 waves. A confirmation at its current location will trigger a sell for Wave 4(Green).
For more information on the same, go to:

A pullback planThe upper trendline starts from Jan 2022 peak. It was broken on normal scale but still holds on log scale. The price may top here or may go higher. In a very bullish scenario the price may bounce much higher from an upper 1W FVG, but I think it will be broken soon. In any case I see a strong support
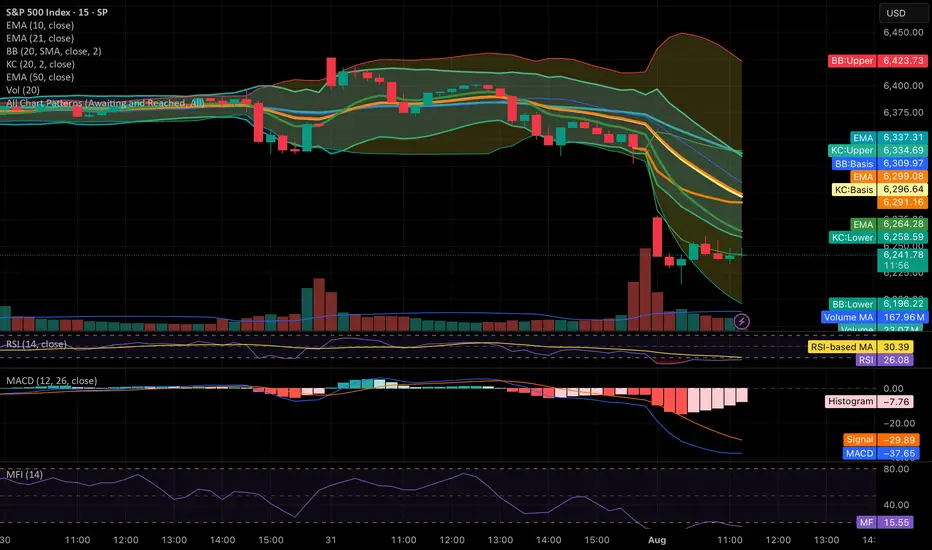
Price breakout below Keltner bandThe price has shown a breakout after the squeeze below the keltner band and may signal a more bullish trend.
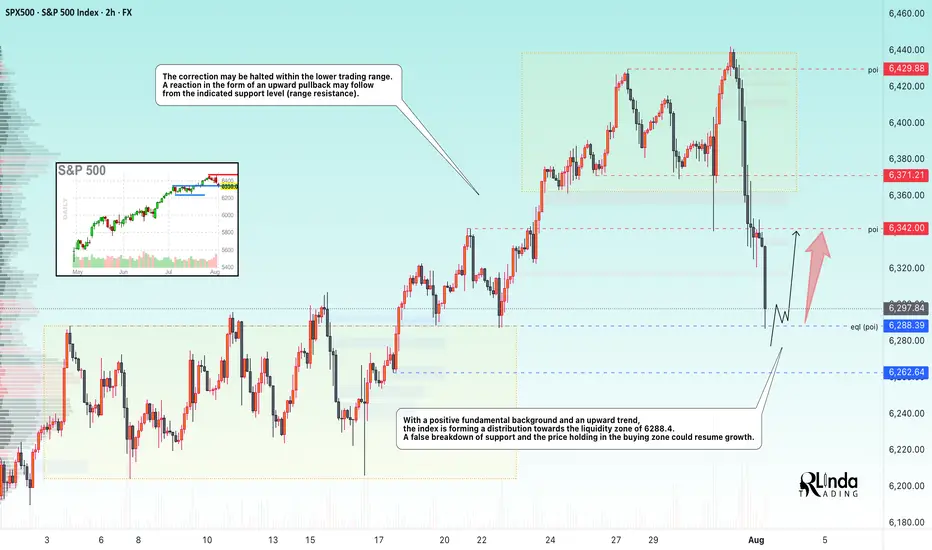
SP500 → Countertrend correction before growthFX:SPX500 is correcting against an upward trend. In the second half of the week, the market received fairly positive fundamentals during the reporting period.
S&P 500 futures found support after strong reports from Meta and Microsoft, which exceeded earnings expectations and forecasts thanks t
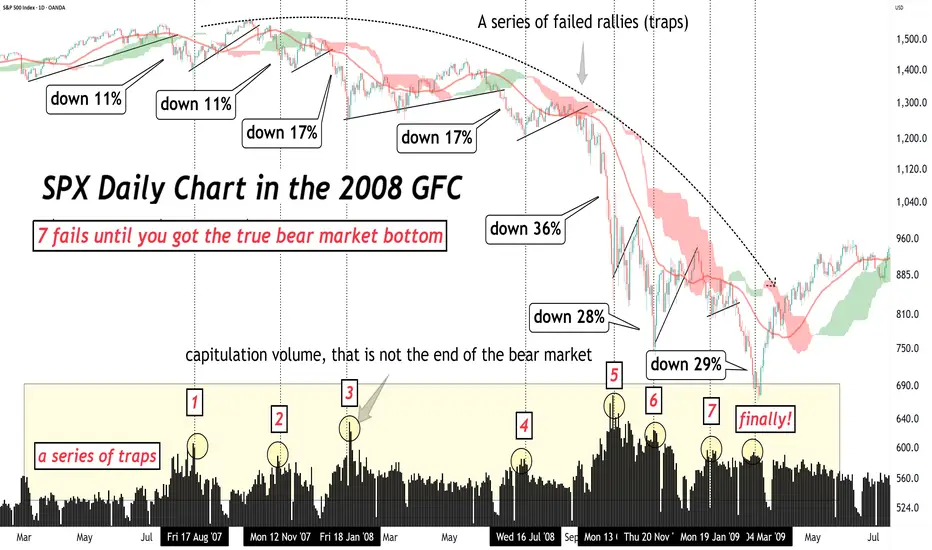
The worst drops often come later!Don’t be fooled by the first crash… The worst drops often come later in a bear market.
Let’s break down the brutal truth about the 2008 GFC and what it teaches us today. 🧵
1.
In the 2007–2009 bear market, the S&P 500 had 7 failed rallies before finally bottoming.
Every bounce looked like the botto
See all popular ideas