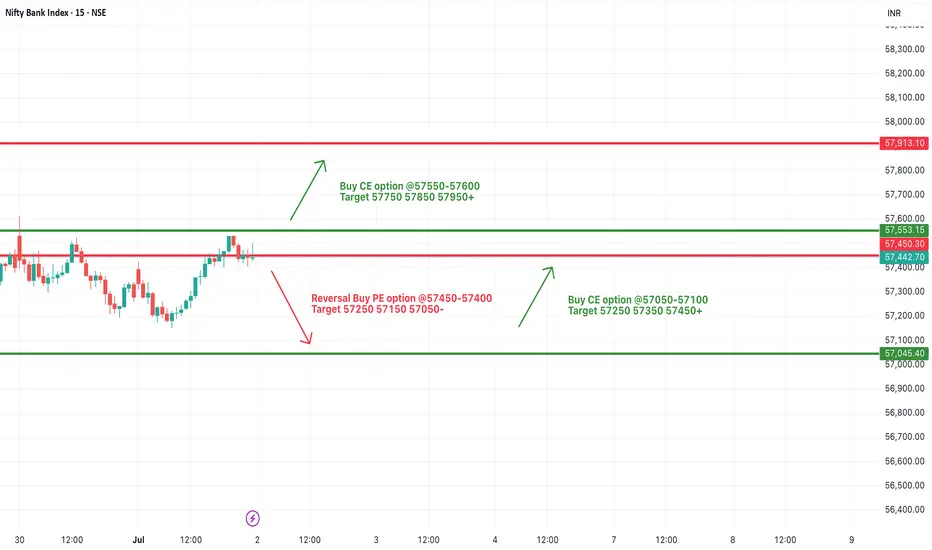
[INTRADAY] #BANKNIFTY PE & CE Levels(02/07/2025)Bank Nifty is expected to open flat near the 57,440 level, just below the immediate resistance at 57,450. This zone will play a crucial role in today’s session. Sustaining above 57,450 can lead to bullish momentum with potential upside targets of 57,550, 57,850, and 57,950. Traders may look for a breakout confirmation before entering long trades.
On the downside, if the index fails to sustain above the 57,450 level and reverses, support around the 57,100–57,050 zone could be tested. A move below this range might lead to a short-term decline toward 57,000 and 56,950. The market remains in a consolidation phase, and breakout from this tight zone can lead to a directional move.
Market indices
Usrec longs after drop📈 US Tech 100 | 15-Min Chart
✅ Live Trade Example using ELFIEDT RSI + Reversion
⸻
This setup was captured using the ELFIEDT RSI + Reversion indicator. A clean BUY signal was triggered after an extended move, followed by a sharp reversal — perfectly timed and visually confirmed by the indicator’s built-in logic.
💡 The result? A precise entry with a strong follow-through.
This tool is built to spot high-probability reversals with confluence — across timeframes, instruments, and volatility conditions.
⸻
👥 Want to trade with structure and clarity?
Join our community of traders who use this system daily to simplify their decisions and sharpen their edge.
📩 Comment “🔥” or send a DM to learn more.

U.S. dollar index DXY analysis- daily time frame ✅ U.S. Dollar Index (DXY) Analysis — Daily Timeframe
👤 A TVC:DXY trader’s perspective:
When I look at this chart, several key points immediately stand out:
1️⃣ Long-Term Trend
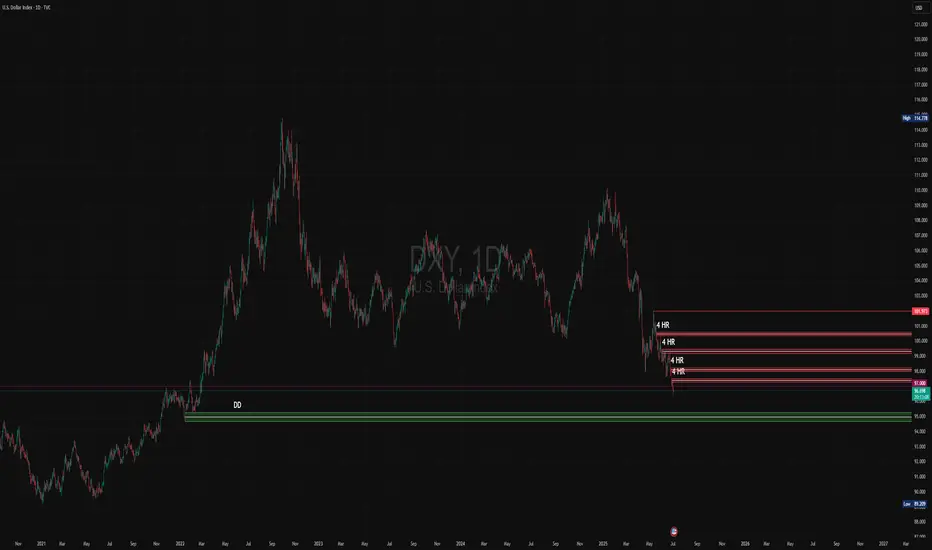
On the weekly and daily timeframe, the major trend has turned bearish after peaking around 114. We see a clear series of lower highs and lower lows confirming the downtrend.
The sharp rally from 89 to 114 in the past was a strong impulsive move, which is now undergoing a deep correction. Currently, price is hovering around a major historical support near 96.
2️⃣ Key Support Zone
The current price near 96.7 is sitting right at a significant support area that has triggered considerable buying interest in the past.
If this support decisively breaks, the green zone marked as DD (around 93–95) represents a strong long-term demand zone and will likely be the next liquidity target for buyers.
3️⃣ Resistance (Supply Zones)
The four red-marked 4HR zones between 97 and 101.9 clearly show significant supply zones where sellers have stepped in on lower timeframes.
Should the price attempt a bounce from current levels, these resistance areas may act as a strong barrier to further upside.
4️⃣ Price Structure and Liquidity
Looking more closely, the market seems to be moving from a consolidation phase toward lower support liquidity. That means there is a high probability of a liquidity grab toward the 93–95 area before a potential fresh bullish leg.
At higher levels, unless the price can break and hold above 98 and then 100, we cannot confirm a trend reversal.
🔹 Summary
✅ Overall downtrend remains dominant
✅ 96–97 is a critical support zone
✅ A break below this support targets 93–95
✅ Trend reversal only possible with a confirmed break and hold above 98, and then 100–101
✅ The 4HR resistance zones (97–101) are strong hurdles for any bullish retracement
✅ As long as price remains below 98, any rally is likely just a corrective move
⚠️ Disclaimer: This analysis is for educational and informational purposes only and does not constitute financial advice or a recommendation to buy or sell. All trading decisions are solely your own responsibility.
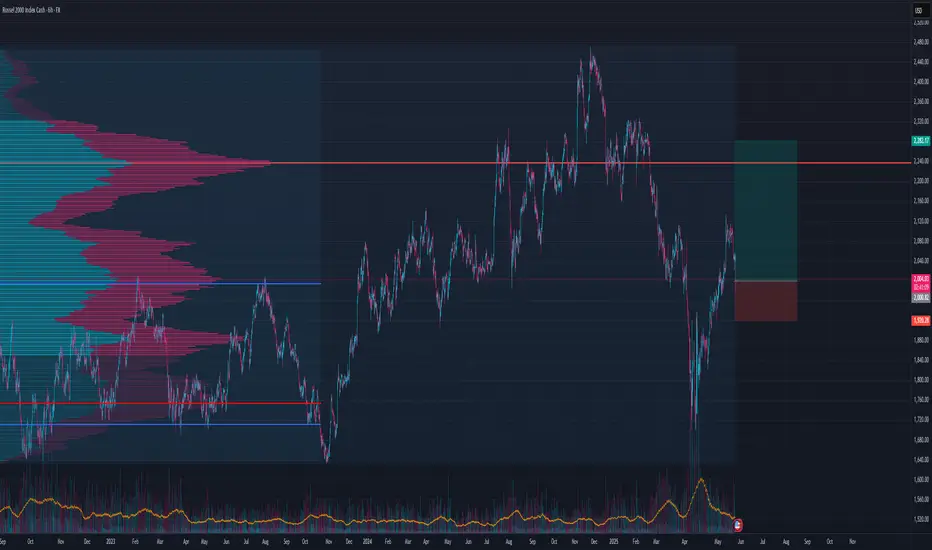
Russels IWM LongSeems decent here since its the VAH of the previous all time high correction move
Pump into POC for TP
Would not risk more then 1%
US30 Sell analysis/ideaThis analysis is based on multiple timeframes and executed using reversal trading and trend formation. complete explanation in the video!

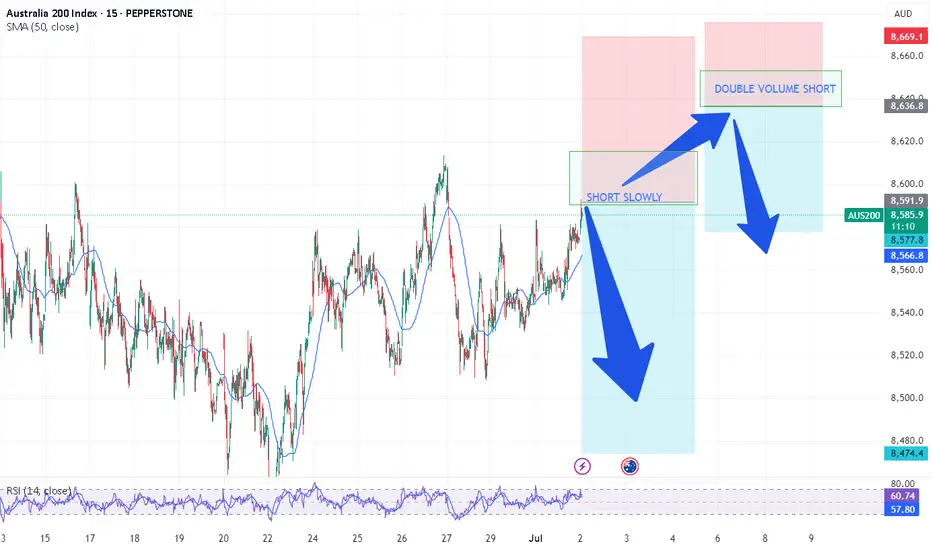
SHORT AUS200/ASX200 - TIME TO SHORT THE AUSSIETeam, over the last few days, we have been successfully SHORT BOTH UK100/AUS200, but I did not post the chart
Today is a good time to post.
Ensure you understand your RISK - can always discuss with us in the room
Let's SHORT UK100/FTSE100, I still expect the market to be volatile even though the US expect a rate cut. on the 9th JULY, there will be a tariff announcement, and it could also extend towards September
We are SHORTING AUS200 at 8586 toward 8616 - SLOWLY
with target at 8562-47
DOUBLE THE SHORT AT 8632-56
Target at 8608-8592
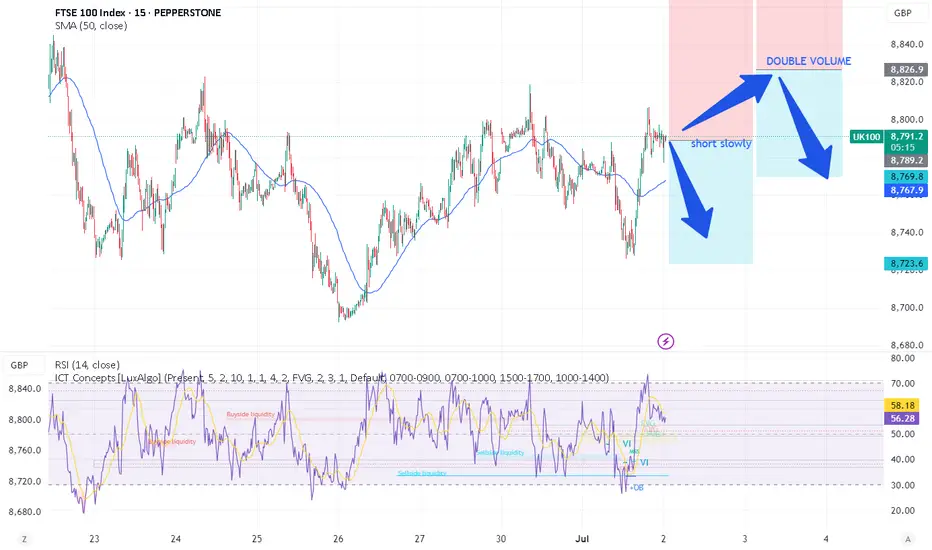
UK100/FTSE100 - TIME TO SEND UK100 TO RECESSIONTeam, we are setting two strategies to the SHORT UK100/FTSE100
Ensure you understand your RISK - can always discuss with us in the room
Let's SHORT UK100/FTSE100, I still expect the market to be volatile even though the US expect a rate cut. on the 9th JULY, there will be a tariff announcement, and it could also extend towards September
We are SHORTING UK100 at 8789 toward 8816
Target at 8762-8745
I will DOUBLE the short at 8836-8862
Target at 8816-8805
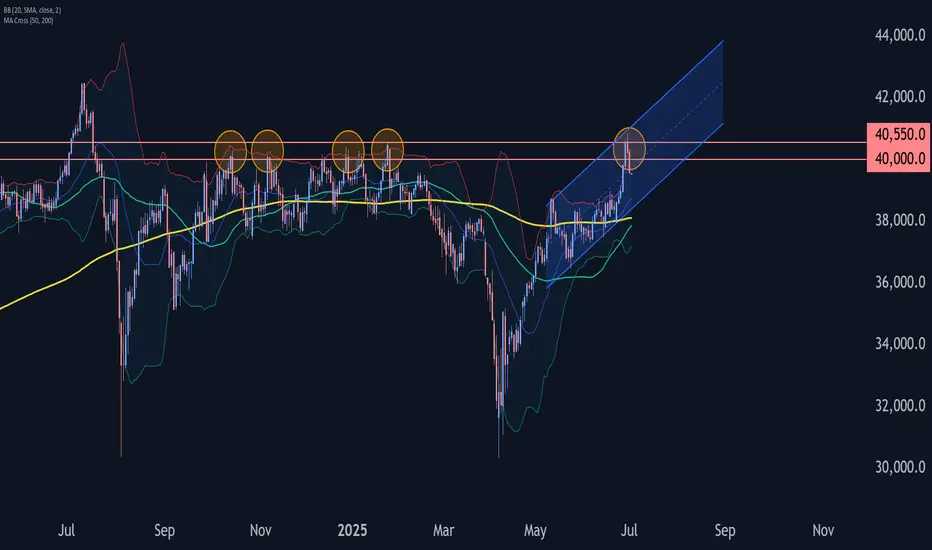
Nikkei 225 Wave Analysis – 1 July 2025
- Nikkei 225 reversed from resistance zone
- Likely to fall to support level 39000.00
Nikkei 225 index recently reversed down with the Evening Star from the resistance zone between the resistance levels 40000.00 and 40550.00 (former multi month high from January).
This resistance zone was strengthened by the upper daily Bollinger Band and by the resistance trendline of the daily up channel from May.
Given the strength of the aforementioned resistance zone and the overbought daily Stochastic, Nikkei 225 index can be expected to fall to the next support level 39000.00.
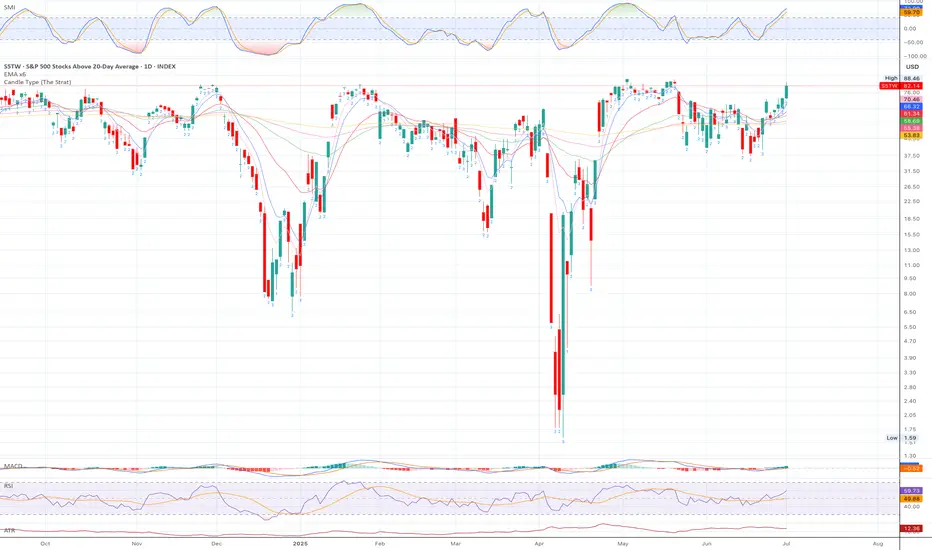
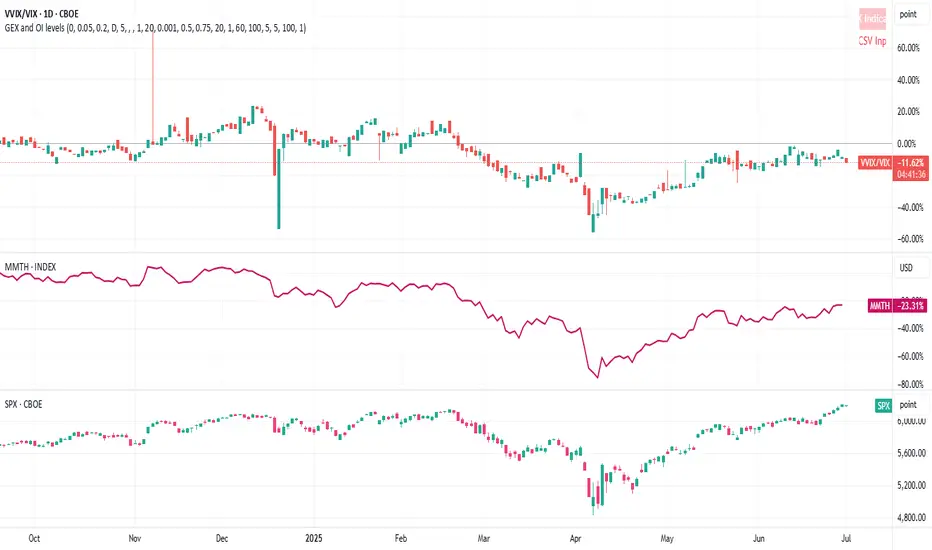
Percentage of stocks above 20MAIt's getting near that time again folks! 82% of AMEX:SPY stocks above 20MA which suggests a sharp pullback is imminent.
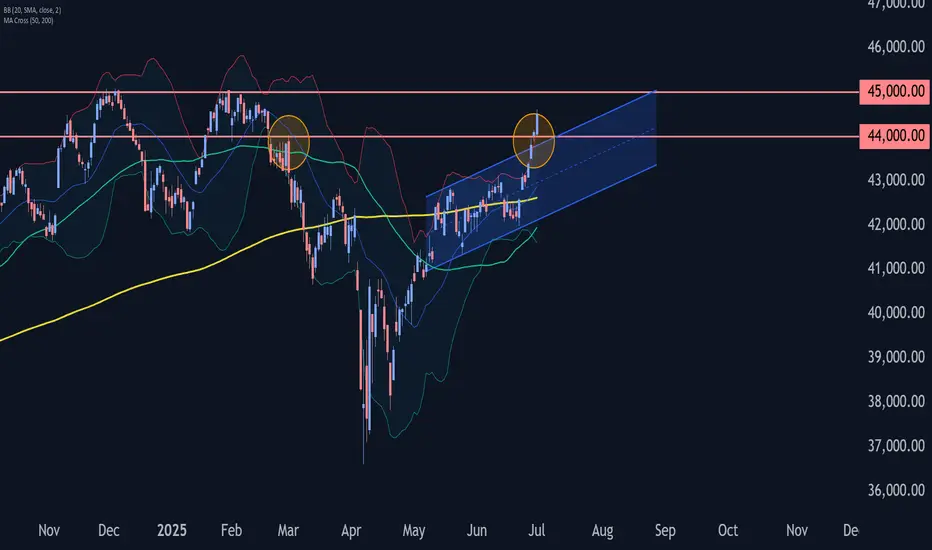
Dow Jones Wave Analysis – 1 July 2025
- Dow Jones broke the resistance zone
- Likely to rise to resistance level 45000.00
Dow Jones index recently broke the resistance zone located at the intersection of the resistance level 44000.00 (former top of wave iv from March) and the resistance trendline of the daily up channel from May.
The breakout of this resistance zone accelerated the active impulse wave (3) – which is part of the multi-month upward ABC correction 2 from April.
Dow Jones index can be expected to rise to the next resistance level 45000.00 (target price for the completion of the active impulse wave (C)).
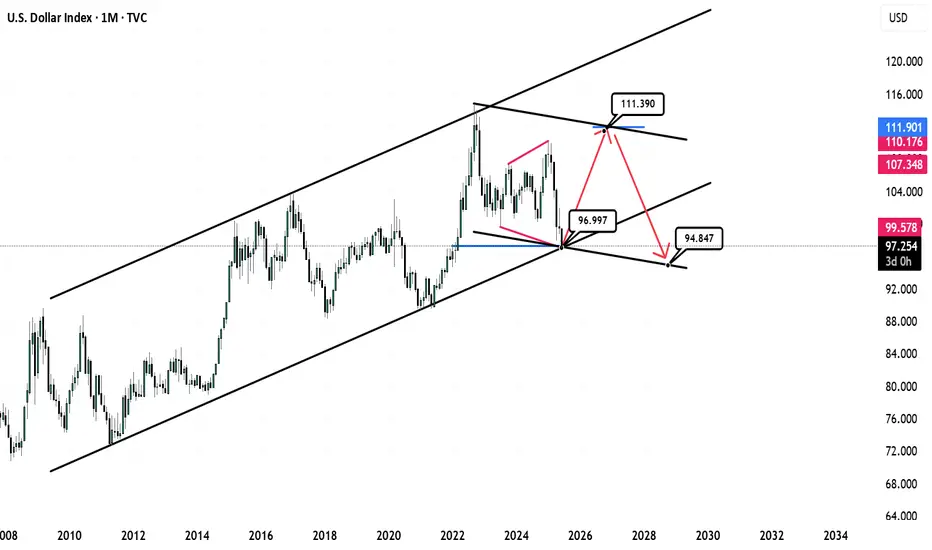
USD Roadmap: Bullish Recovery or Structural Breakdown?TVC:DXY CAPITALCOM:DXY
🟢 Scenario A – Bullish Rebound (Red Arrow Up):
Price bounces from the lower channel and breaks toward:
107.348, 110.176, or even 111.901 resistance area.
If the dollar is supported by China buying USD, hawkish Fed, or geopolitical tensions, this scenario gains weight.
🔸 Resistance: Blue downward-sloping line (possible trendline resistance or lower high area)
🔸 Risk: Price could form a lower high and then reverse.
🔴 Scenario B – Bearish Breakdown (Red Arrow Down):
If the USD fails to break above resistance (around 107–112) and gets rejected…
Then we see a move back down, possibly breaking the long-term channel, aiming for the lower diagonal support zone or even sub-92.
🔸 This would signal a major shift in USD strength, possibly driven by:
Fed rate cuts
Global de-dollarization
China not supporting USD
Stronger EUR or CNY
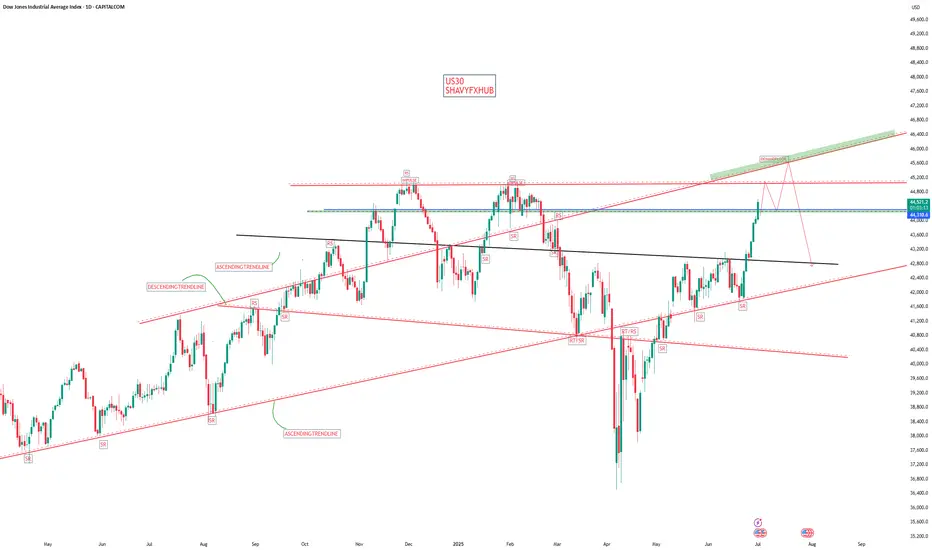
US30Market Drivers
Rotation: Investors are shifting from tech to industrials and other Dow components to start the second half of 2025.
Trade Policy: Optimism over potential US trade agreements and a 90-day delay in new tariffs has supported the rally.
Technical Outlook: The overall momentum is bullish and first resistance at 45.043
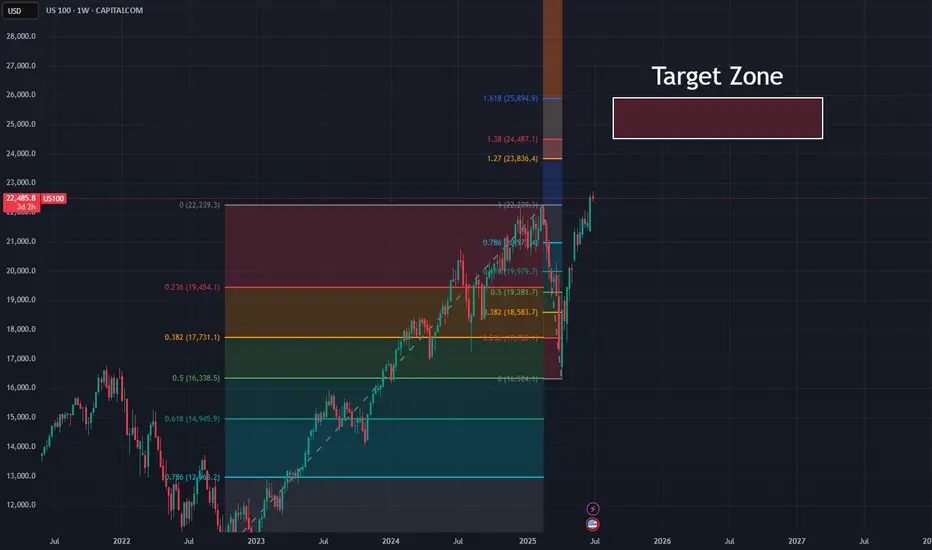
Up Up Up... Nothing Can Stop NAS From RisingLet's take a look at the big picture in the NASDAQ: Do you see how nicely the spring crash landed on the 50% retracement of the upward movement since fall 2022?
Now that we've crossed the old ATH, the targets are clear, and they're way up in the NASDAQ.
The summer correction is therefore likely to fail and probably turn into a listless sideways slide. By September at the latest, however, the NAS should pick up speed again and head for targets between 25,000 and 26,000 - at the very least.
Clear skies!
Dow Jones -> A breakout rally of +40%!🐂Dow Jones ( TVC:DJI ) will create new highs:
🔎Analysis summary:
Since the April lows, the Dow Jones already rallied about +25%. This was simply the expected rejection away from a strong confluence of support. Now, the Dow Jones is sitting at the previous all time highs and about to break out, leading to a massive rally.
📝Levels to watch:
$45.000, $60.000
🙏🏻#LONGTERMVISION
Philip - Swing Trader

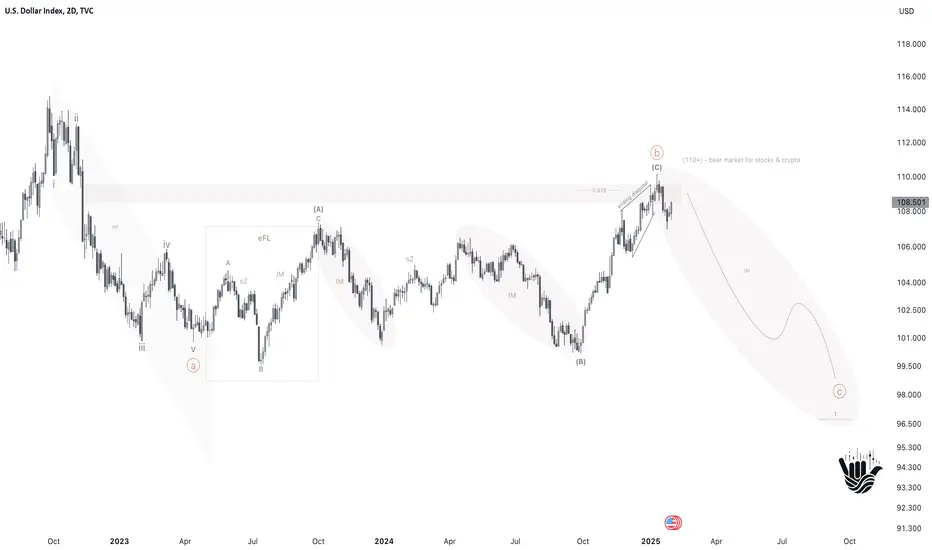
DXY at the Crossroads: How the 108–110 could reshape the market
Key Highlights
The U.S. Dollar Index TVC:DXY is currently near an important resistance level of 108–110.
A potential reversal of the dollar at this level could lead to further growth in stock markets and strengthen cryptocurrencies, while a break above 110+ would continue to put pressure on risk assets.
If CAPITALCOM:DXY surpasses 110 and holds above it, there is a possibility of reaching as high as the 120 mark. A rejection from the 108–110 zone would indicate a downward trend developing, possibly pushing the index toward the 98 area or lower.
Future outcomes will depend on Federal Reserve monetary policy, global demand for the dollar and other safe-haven assets, as well as overall economic stability.
What about crypto?
There are serious risks for CRYPTOCAP:TOTAL2 CRYPTOCAP:TOTAL3 & CRYPTOCAP:OTHERS
A long-term perspective on ICEUS:DXY suggests that “alt seasons” tend to occur during periods of dollar weakness. Currently, the 108–110 zone and the MA50-W are pivotal. A potential DXY reversal here may act as a catalyst for another major altcoin rally in the coming months, while continued dollar strength could postpone any such “alt season.”
Shaka
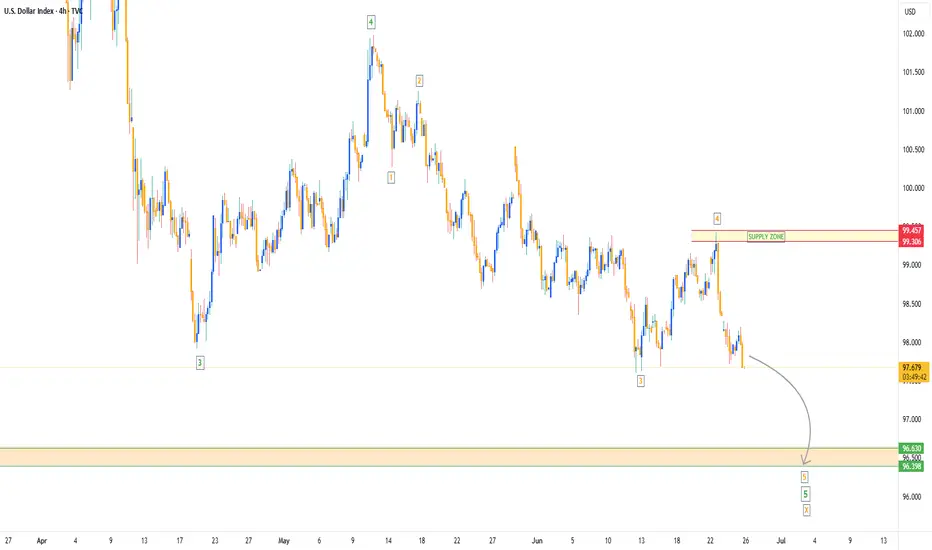
Dollar Index Bearish to $96The DXY has been in a downtrend for a while & that bearish pressure is not over yet. I expect more bearish downside towards the $96 zone, before we can re-analyse the market for any signs of bullish takeover.
⭕️Major Wave 3 Impulse Move Complete.
⭕️Major Wave 4 Corrective Move Complete.
⭕️Minor 4 Waves of Major Wave 5 Complete, With Minor Wave 5 Yet Pending.
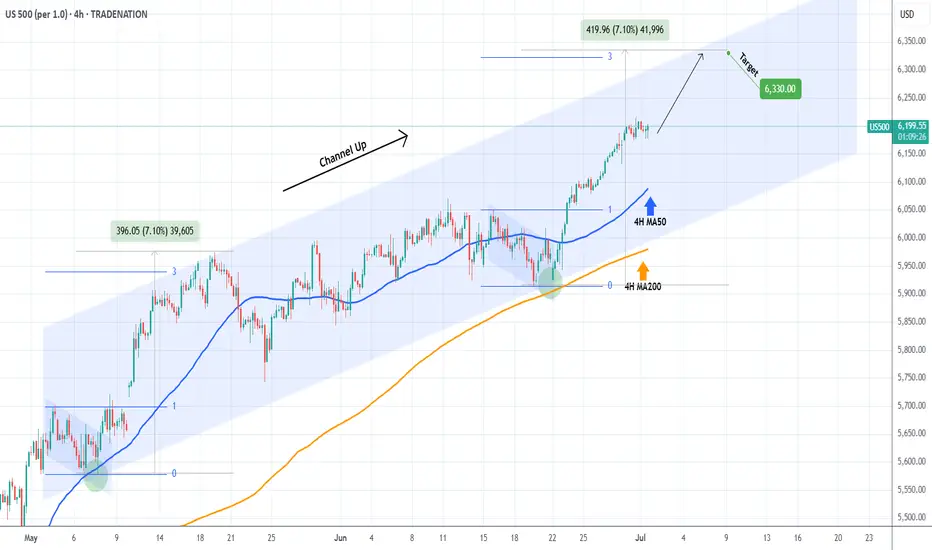
S&P500 Bullish Leg not over yet.The S&P500 index (SPX) has been trading within a Channel Up since the May 07 Low and is currently unfolding the latest Bullish Leg.
As you can see, it is far from having topped, not just by a plain trend-line (Higher Highs) perspective but also based on the Fibonacci and % rise terms relative to the previous Bullish Leg.
That peaked after a +7.10% rise, a little above the 3.0 Fibonacci extension. As a result, a 6330 Target on the short-term is more than fitting.
-------------------------------------------------------------------------------
** Please LIKE 👍, FOLLOW ✅, SHARE 🙌 and COMMENT ✍ if you enjoy this idea! Also share your ideas and charts in the comments section below! This is best way to keep it relevant, support us, keep the content here free and allow the idea to reach as many people as possible. **
-------------------------------------------------------------------------------
Disclosure: I am part of Trade Nation's Influencer program and receive a monthly fee for using their TradingView charts in my analysis.
💸💸💸💸💸💸
👇 👇 👇 👇 👇 👇
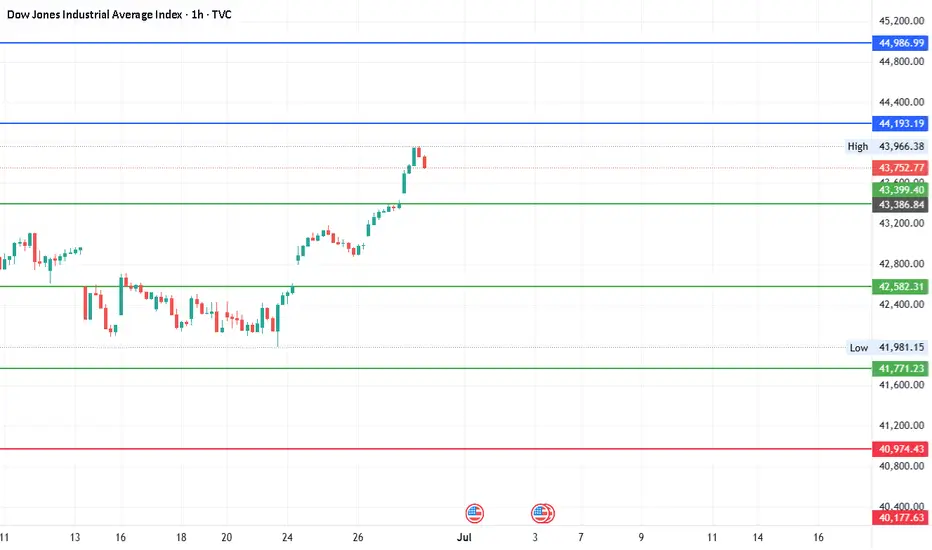
#DJI - Pivot is 42582.31 | Target 38374.12 or 46790.50?Date: 27-06-2025
This is in continuation with the previous post of 8000 points target. We have a new pivot point for the next move.
#Dow Jones Current Price: 43880.
Pivot Point: 42582.31 Support: 41771.23 Resistance: 43399.40
#Dow Jones Upside Targets:
Target 1: 44193.19
Target 2: 44986.99
Target 3: 45888.75
Target 4: 46790.50
#Dow Jones Downside Targets:
Target 1: 40974.43
Target 2: 40177.63
Target 3: 39275.875
Target 4: 38374.12
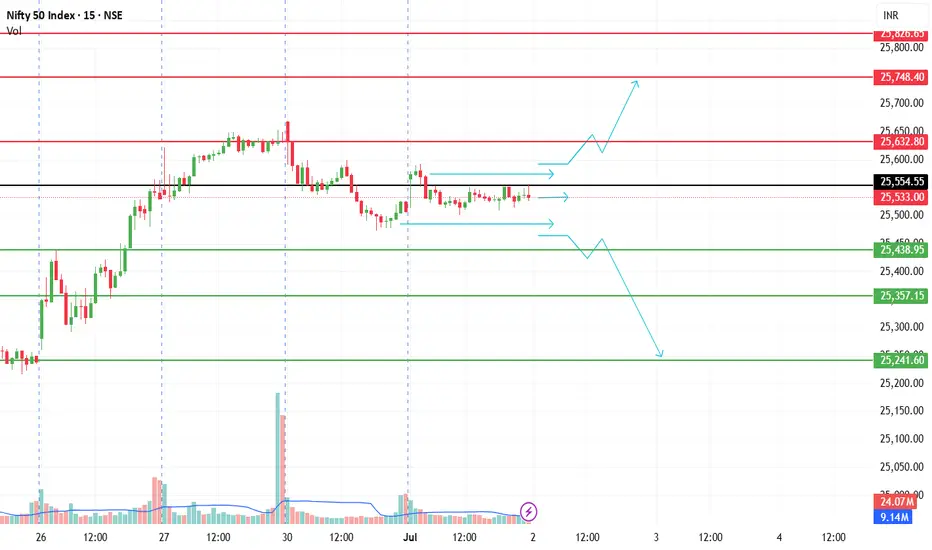
NIFTY VIEW FOR 02-07-2025Dear Trader, One more day coming for SIDEWAY market. unfortunately
Bullish -> if OPEN above 25550, 25750 will be the resistance and may volatile between 25600 and 25750.
Bearish -> if OPEN below 25450, 25250 will be the support and may slip to 25050
Sideway -> if OPEN around 25500, market will be ranging in-between 25550 to 25450
Thank You, Rest will be after OPENING, Have a profitable day!
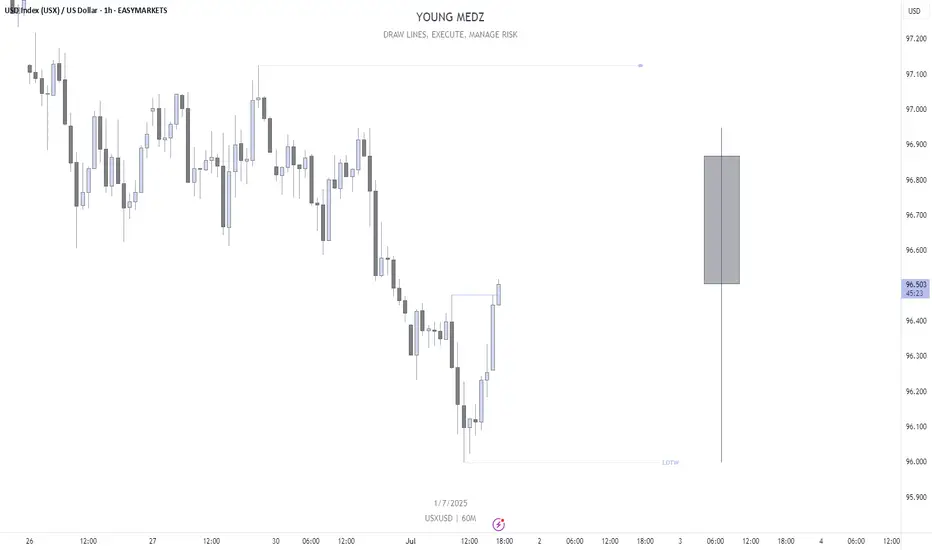
USXUSD LOTWUSXUSD LOTW Potentially In.
H1 BOS confirms this for me. Targeting H4 Internal Liquidity & Daily FVG.
Let's see.
The market bias stays up, MJ stocks may be a buy here. The market continues to be biased up, and the target is likely the weekly B. MJ stocks are showing technical signs that a reversal may come. There may be other sectors similar as I think the summer bottom gamblers will start appearing now that everything else is at the highs. Gold looks like it will eventually go lower. Nat gas lost support and is likely to go lower. USOIL is bear flagging.

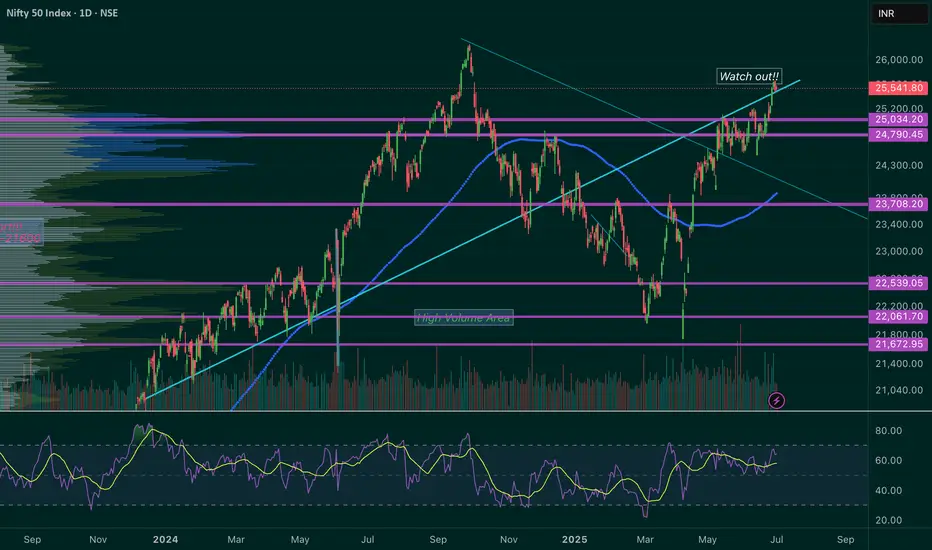
NIFTY is Testing its long term Trend Line.I’ve been keeping an eye on the ‘Watch Out’ area and the trend line that’s being tested. I’ve been following this trend line for a while now, and I’m excited to share some potential scenarios that could unfold in July.
Here are a few things to keep in mind:
1. The 25450 - 25550 range could become a key resistance and support area.
2. If NIFTY successfully retests this trend line and shows some upward movement, the next target could be 26000. In this case, I would recommend buying July 26000 Call options.
3. If NIFTY can’t hold this retest (which is less likely given NSE:NIFTY the current bullish market sentiment), our next watchout zone could be 25000 - 24800.
4. We might even be seeing an all-time high NIFTY soon!
Disclaimer: Please do your own research before investing. This is just my personal opinion, and I don’t force anyone to invest based on my ideas.