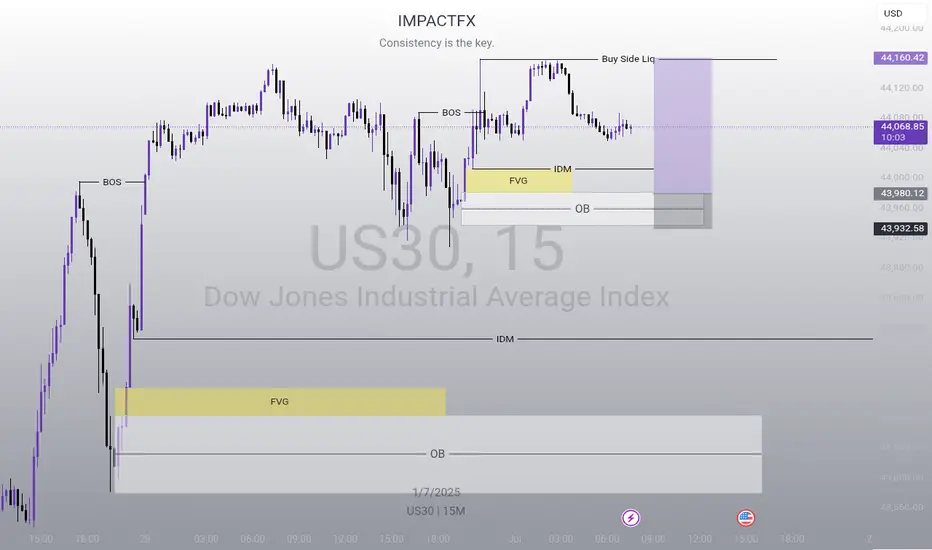
US30 Buy SetupI have two zones for US30 Buy but I think price should trigger my limit to take out the BSL(Buy Side LIq) before going down
Market indices
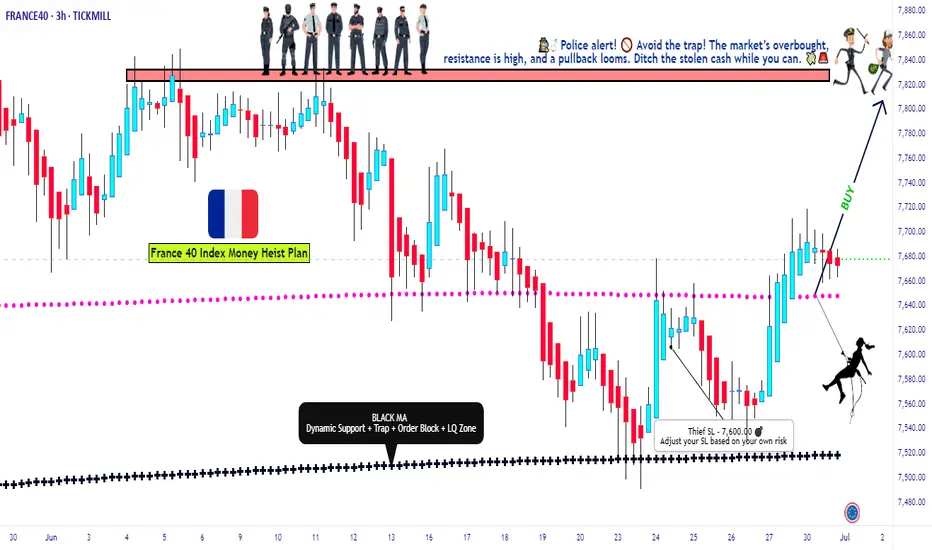
FRANCE 40 Heist in Progress | Bullish Reversal Zone Spotted.💼 CAC40 Market Heist: Thief Trading Blueprint for Smart Traders (Swing/Day Trade Edition) 💼
🌍 Bonjour, Hola, Hallo, Marhaba, Ola, Hello! 🌍
Welcome to all Market Hustlers, Silent Snipers, and Profit Seekers! 🤑💸🎯
We're back with a precision-built Thief Trading Plan — this time targeting the FRANCE40 / CAC40 Index, using a combination of street-smart technicals and sharp macro insights.
🧠 Game Plan: The “Market Heist” Strategy
This strategy revolves around a Long Entry setup aiming for the high-risk Red Zone. Price is pushing into potential overbought territory, with signs of consolidation and trend exhaustion. That’s exactly where reversal opportunities and big moves live — right before the herd wakes up. 🐂💰
🔓 Entry Plan – "The Vault’s Open"
📍 Enter on bullish setups – recommended through:
Recent 15/30 min support levels or
Swing low/high based buy limit zones
💡 Pro Tip: Set alerts at those critical swing levels so you’re always one step ahead.
🛑 Stop Loss – "Stay Out of Jail"
🎯 Suggested SL: Near the recent 3H swing low (~7600 zone)
🧩 Adjust SL based on:
Risk tolerance
Lot size
Multiple entries
Trading strategy preference
🎯 Take Profit – "The Great Escape"
📌 Primary TP: 7830.00
🔐 Trailing SL advised to secure profits during the climb
🚨 If market shifts or trap signs emerge, exit early and protect the bag.
⚔️ Scalpers vs Swingers – Choose Your Crew
Scalpers: Only ride the long waves. Use momentum & micro breakouts.
Swing Traders: Follow the blueprint. This is your time to rob the trend cleanly. 🕶️📈
🧩 Market Insight & Fundamentals
This bullish momentum is backed by key drivers:
Economic releases
Institutional positioning (COT Reports)
Sentiment & intermarket flows
Geopolitical & macro factors
📌 Always update your narrative. Markets shift fast. Stay informed. Stay sharp.
⚠️ Important Trading Notice – News Risk & Management
🚫 Avoid fresh entries during high-impact news events
🔄 Use trailing SLs to lock gains
🧠 Be aware of volatility traps
❤️ Support the Strategy – Hit Boost & Join the Crew
If this strategy made sense to you, smash that Boost Button.
You're not just supporting a post — you're fueling a Thief Trader movement where smart, fearless traders take what’s theirs from the market. 🚀💰
🎉 Keep winning, stay alert, and I’ll see you in the next heist! 🧠💸🐱👤
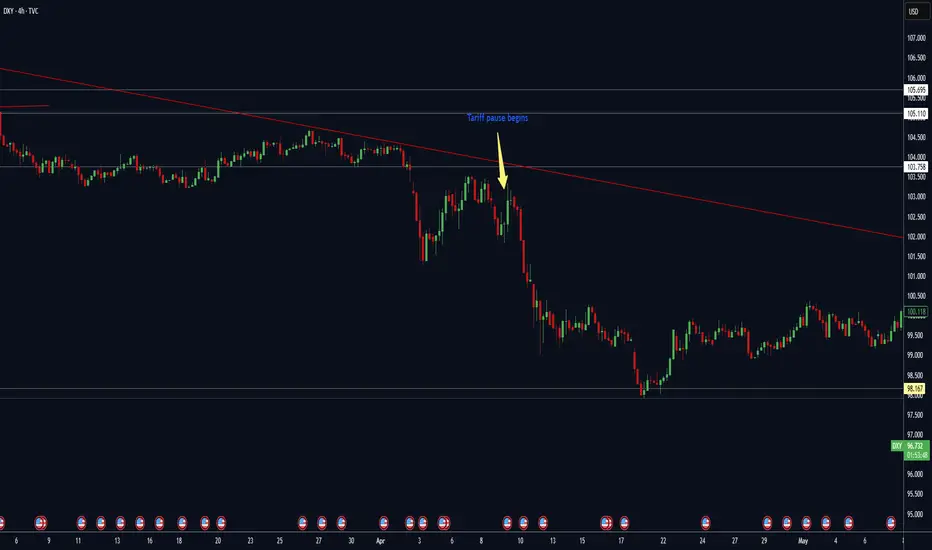
Tariffs your time is up!
Tariff pauses are ending on July 9th. Even if expected deals aren't reach, it's expect that we won't pause again. Expecting the dollar to regain strength into this date.
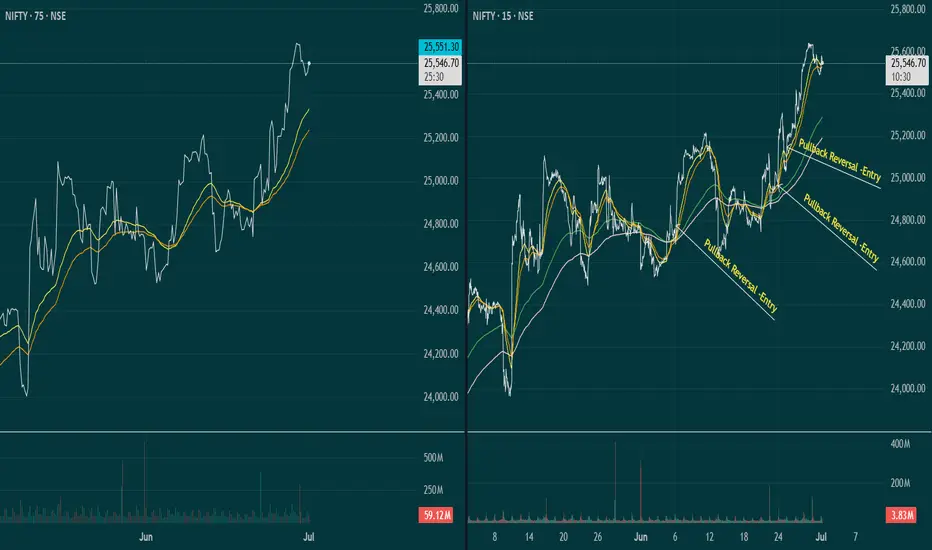
Multi timeframe Pullback reversal entriesThis is very simple but yet effective way of trading. Entry through Multi timeframe analysis. Price riding on MA ( respecting MA levels) and at Pullback - we can enter at reversal in lower time frame once price started riding MA. Though this is very basic - but very effective as this can be applied in timeframe. The sync between higher and lower timeframe for entry. We can exit as per out trade rules - either lower TF MA breach or Higher TF. Entry with proper calculation of Risk Reward only. This is the basic strategy of trend following specially for learners and practicing trading. Even season traders use this. MA period can be arranged as per suitability. Here I have applied 30/50.
This for educational and learning purpose only. Enter trading post proper practice only.
Views are highly welcome.
S&P 500 Outlook. Best Quarter Since 2023… But What Next?The S&P 500 just logged its best quarterly performance since Q4 2023 , surging on optimism around global trade negotiations and growing expectations that the Fed may begin cutting rates as early as September. US futures are green this morning, thanks to developments like Canada backing off digital taxes, ongoing dialogues with China ahead of the July 9 deadline, and risk-on sentiment is pushing yields and the dollar lower.
But as traders, we need to ask:
Are we witnessing a genuine economic inflection point? Or is this just a liquidity-driven rally that’s pricing in a best-case scenario?
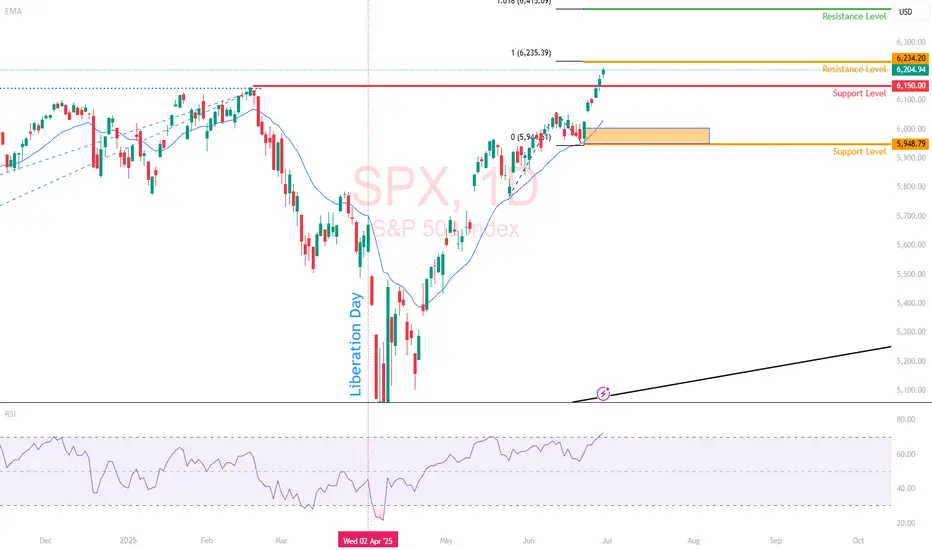
Technical View
Support Zone: 6,150 was just broken through. And 6000, the round number level, coinciding with the 20-day EMA and previous swing level.
Resistance Levels: 6,235 is the next critical ceiling, a clean breakout could see price reach the extension level of 6,415.
Momentum Indicators: RSI remains elevated and is creeping toward the overbought. While momentum is strong, watch out for the possible development of a divergence.
Possible Scenarios
The 'Soft Landing’ Is Now the Base Case
Markets are trading as if the Fed has successfully engineered a soft landing. But that’s now fully priced in, and historically, the most dangerous trades are the ones everyone agrees on. If trade talks stall, inflation re-accelerates, or earnings disappoint, the reversal could be brutal and fast.
Risk-on Sentiment Without Volume Is a Yellow Flag
Despite the price strength, volume has been tapering off. The S&P’s recent leg up occurred on lighter-than-average participation, suggesting institutions may be watching, not chasing. That’s often the case in low-volatility summers, but it also implies that any negative catalyst could cause outsized downside moves.
Macro-Fundamentals May Not Justify Valuation Expansion
Yes, inflation is slowing, and the Fed might cut. But if they do, it’s likely because growth is weakening, not because the economy is roaring. So the very condition that triggers rate cuts could also cap earnings growth!
Projection
Bullish Scenario: A confirmed breakout above 6,280 could carry us toward 6,400–6,500 by mid-Q3, especially if the trade deals progress, July inflation comes in soft, and the Fed signals accommodation.
Bearish Risk: If price fails to hold above 6,120, especially if trade optimism fades, or inflation growth spikes or Fed rhetoric shifts hawkish again, this could then open a quick pullback toward 6,000 or lower, which also aligns with the 50-day SMA.
Key Events to Watch
July 9 Trade Talks Deadline: Any sign of stalling could bring volatility back fast.
June CPI Print (July 10): Crucial for confirming the Fed's next move.
Earnings Season Kickoff (mid-July): Tech-heavy expectations may not be easy to beat after such a strong run.
Conclusion
A record-setting quarter is impressive but not necessarily predictive. This quarter’s rally has been built more on relief and expectations than hard data. When expectations (not earnings) are doing the heavy lifting, any misstep from central banks or geopolitics could unravel gains rapidly.
A rate cut might be delayed, or inflation re-accelerates, or trade talks stall; any of these could leave equities hanging. Remember: the higher the climb without real earnings growth, the harder the fall when sentiment shifts. It's not just about the chart. It is about the narrative behind the price.
What’s your bias for Q3?
Are you buying this breakout or fading the optimism? Drop your thoughts below.
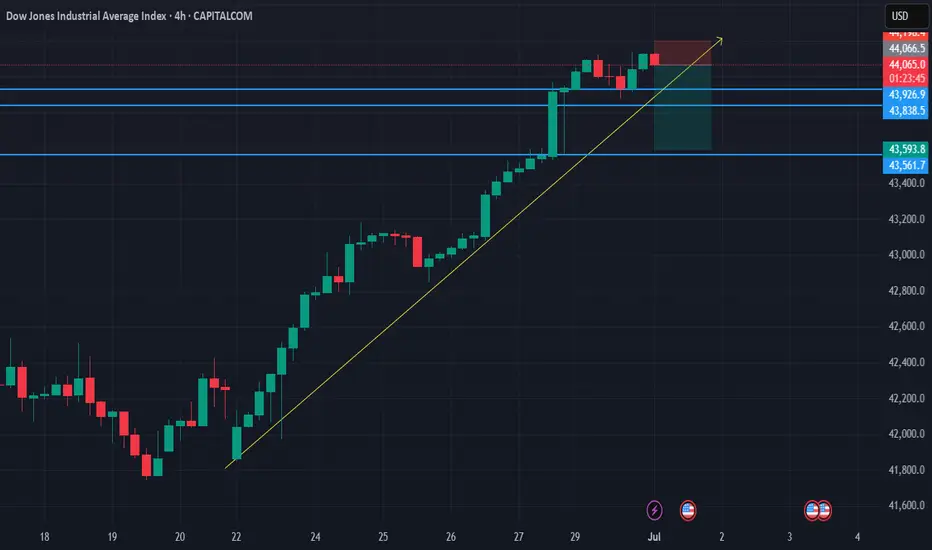
SELL SIGNAL IS HEREUS30 initiates a trend line from 22nd June, 2025, on its 4hr chart, and current price action faces resistance, as such, leading to a temporary sell in a bullish trend. The most possible TP's for the sell signals are on the support lines that the trend line passes through.
tp 1- 43926.9
tp 2 - 43838.5
tp 3 - 43,561.7
Sl - 44200.
Risk wisely.......
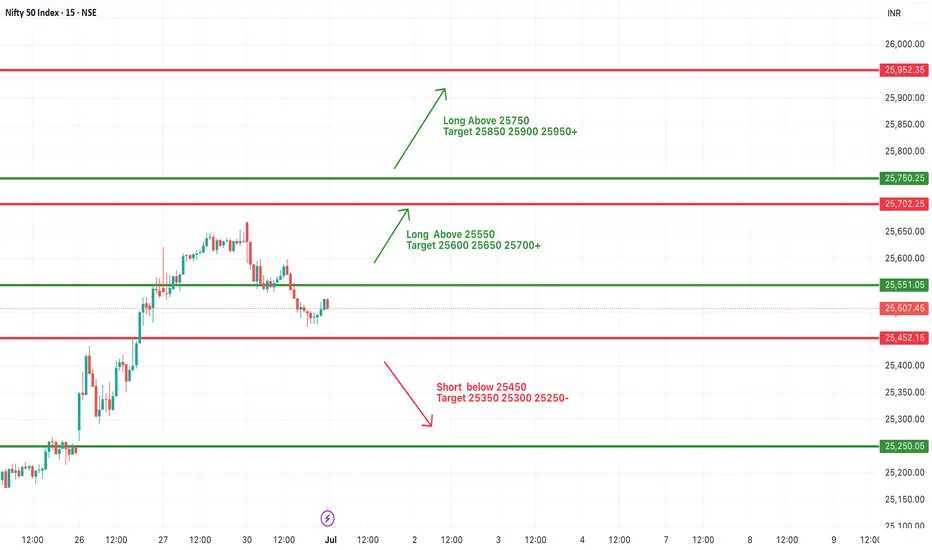
#NIFTY Intraday Support and Resistance Levels - 01/07/2025Nifty is expected to open with a slight gap up near the 25,550 level, which lies close to a minor resistance zone. If the index manages to sustain above this region, we may see a continuation of bullish momentum with potential upside levels at 25,600, 25,650, and 25,700. Holding above 25,550 would signal strength, supported by recent recovery attempts from lower levels.
However, if the index fails to hold above 25,550 and starts slipping below 25,450, weakness may creep in. A fall below 25,450 could open the door for downside targets of 25,350, 25,300, and possibly 25,250. Traders should stay cautious around the 25,550–25,600 zone for a clear directional move, with strict stop losses on both sides.
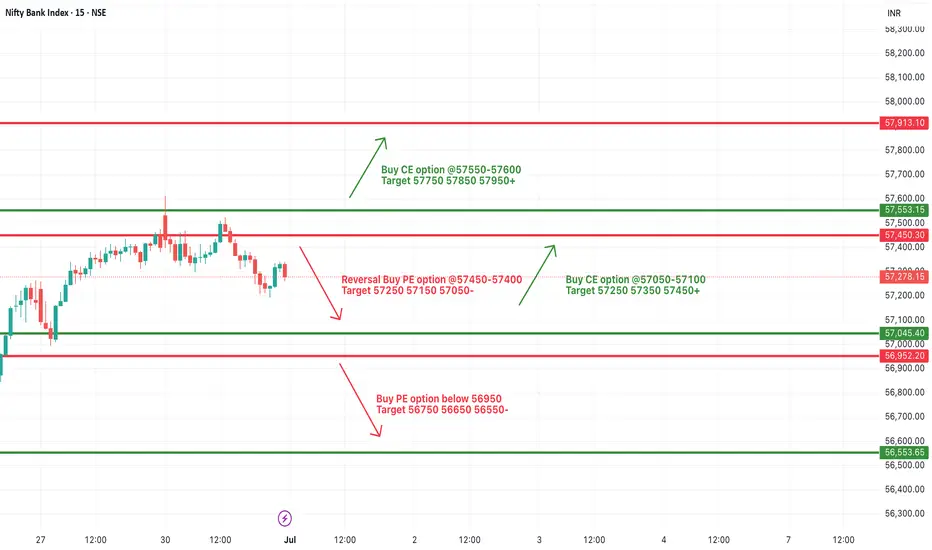
[INTRADAY] #BANKNIFTY PE & CE Levels(01/07/2025)Bank Nifty is expected to open slightly gap up near the 57,450 level, which lies close to an important resistance zone. If the index manages to sustain above this level, a further upside movement may be seen toward 57,750, 57,850, and 57,950. Strength above 57,500 could indicate bullish momentum continuation and may attract fresh buying interest.
On the flip side, if Bank Nifty fails to hold above the 57,450–57,400 zone and shows signs of reversal, a decline toward 57,250, 57,150, and 57,050 is possible. A breakdown below 56,950 will likely trigger further downside levels toward 56,750, 56,650, and 56,550. It is advised to observe price action around the 57,450–57,500 level for directional clarity in today’s session.
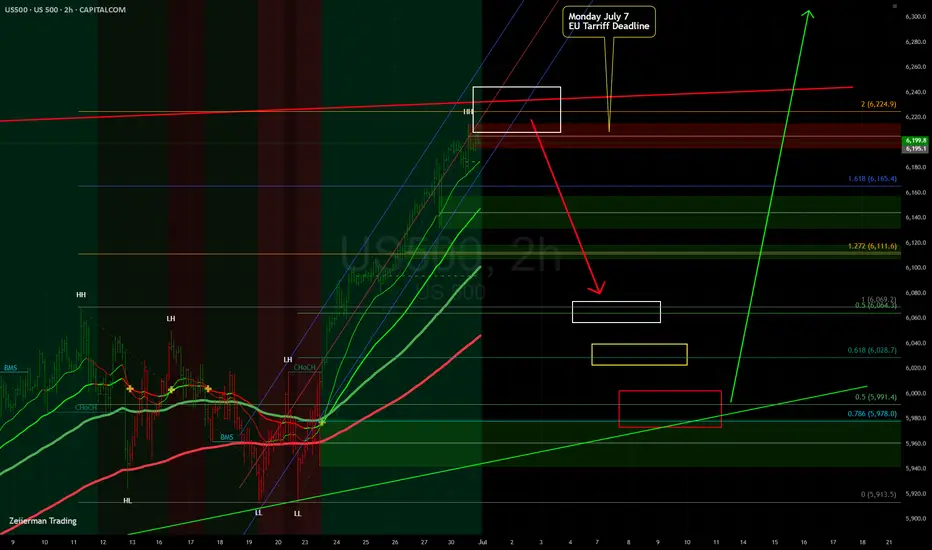
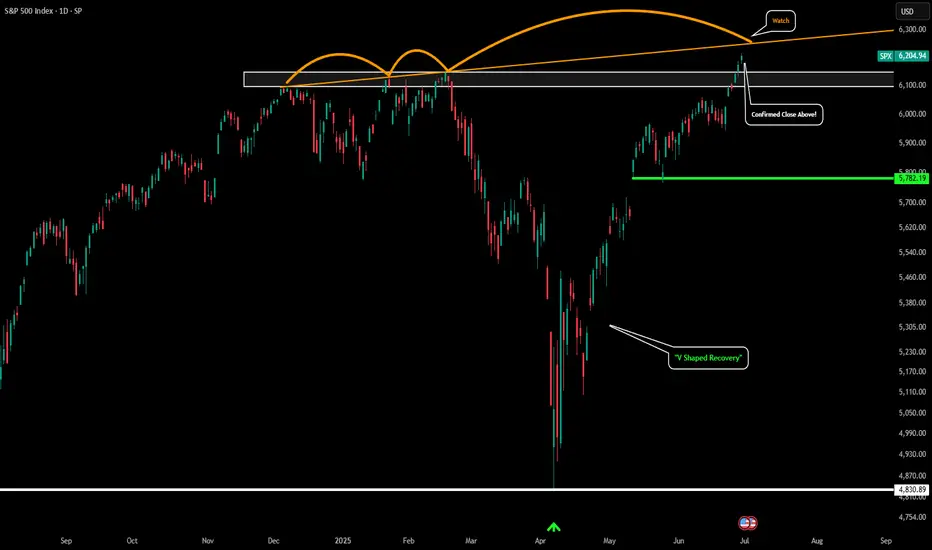
Possible "DIP" into Monday July 7 Tarrif DeadlineHello everyone,
Well we made it. ATH! Well all things must eventually dip. I see a good possibility into next Monday July 7 Tarif deadline plus we are hitting the ATH's prior tops trendline (Red Line)....
I highlight with colored boxes 3 different price targets I think it could dip to before resuming its march higher.
Let's see what happens!
dxy looks on critical juncture dxy looks on critical juncture consolidation near 95 can lead to higher side but if it do not happen than lowerside can be the target
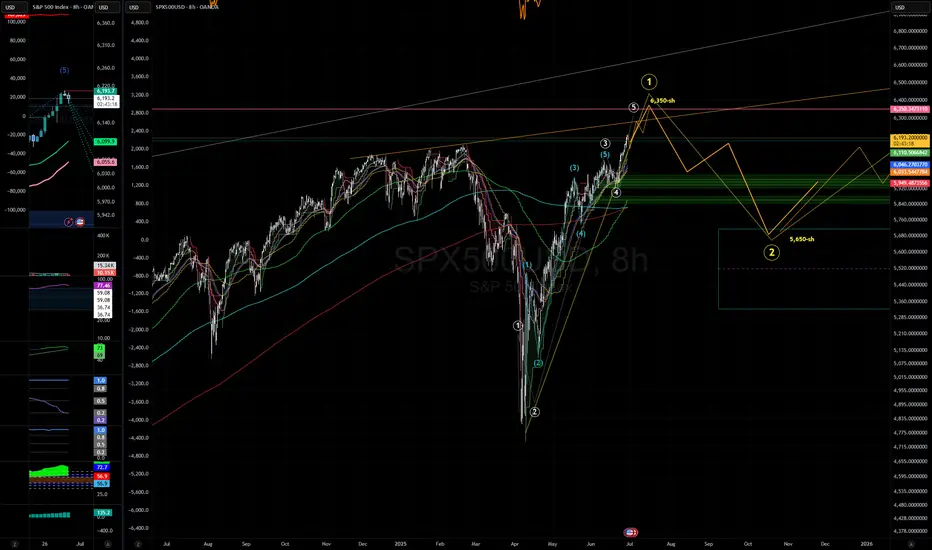
SPX nearing profit pivotSeems SPX is nearing profit pivot. expect a few more waves higher. Then a larger 8%-10% correction. will likely hold through or with some profit around 6350-ish. This expected wave-02 correction will likely be the last real opportunity to close any remaining short positions.
DXY QUITE BEARISH ON WEEKLY DXY might just drop to previous low of May 2021 at the 89 if this weekly downtrend continues
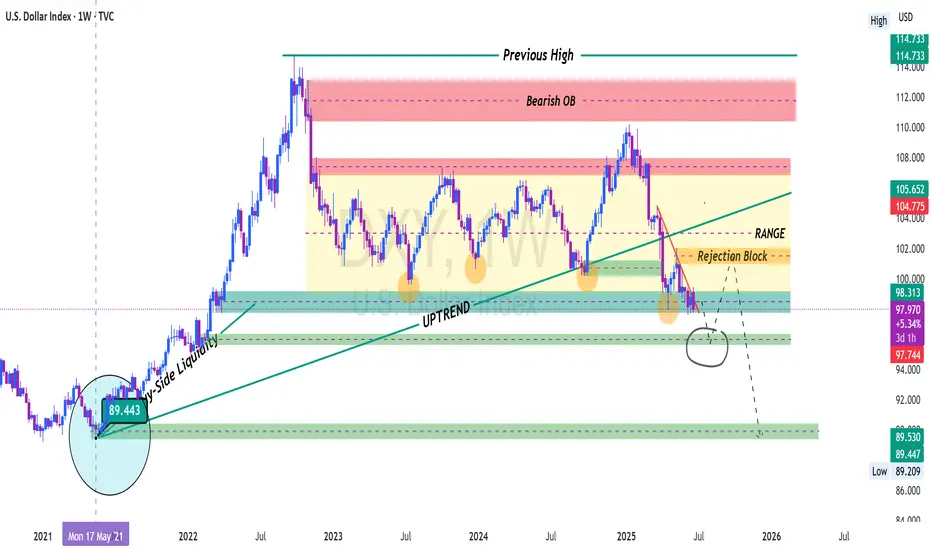
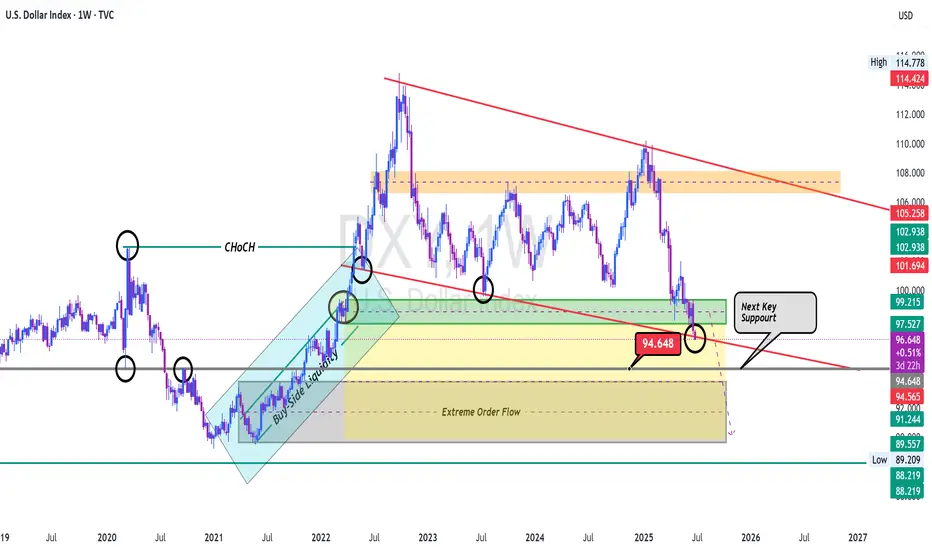
DXY HAS VIOLATED KEY SUPPORT ZONE As DXY has violated key support zone. 94.648 which appears to be the next key level must hold, otherwise we may be approaching the 89 zone.
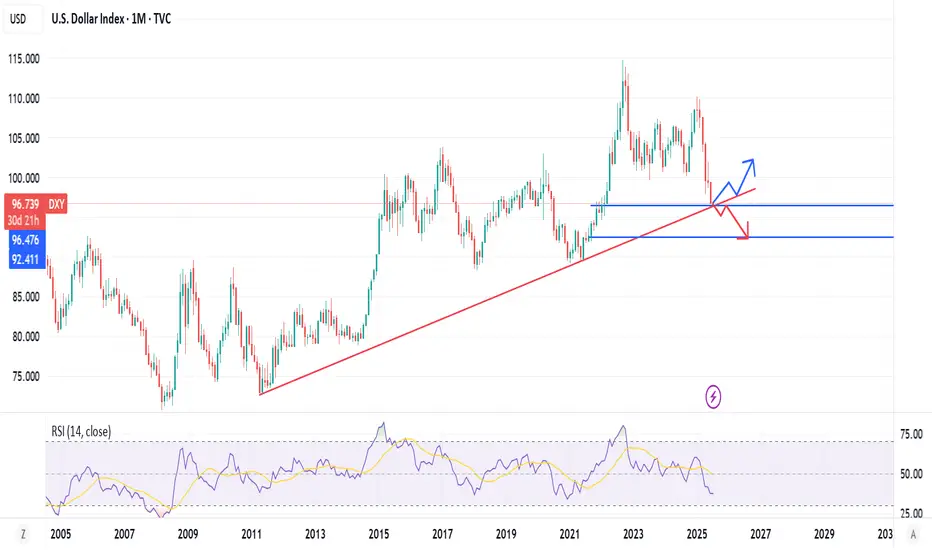
DXY Risk Reversal Blueprint: Monthly Chart Analysis
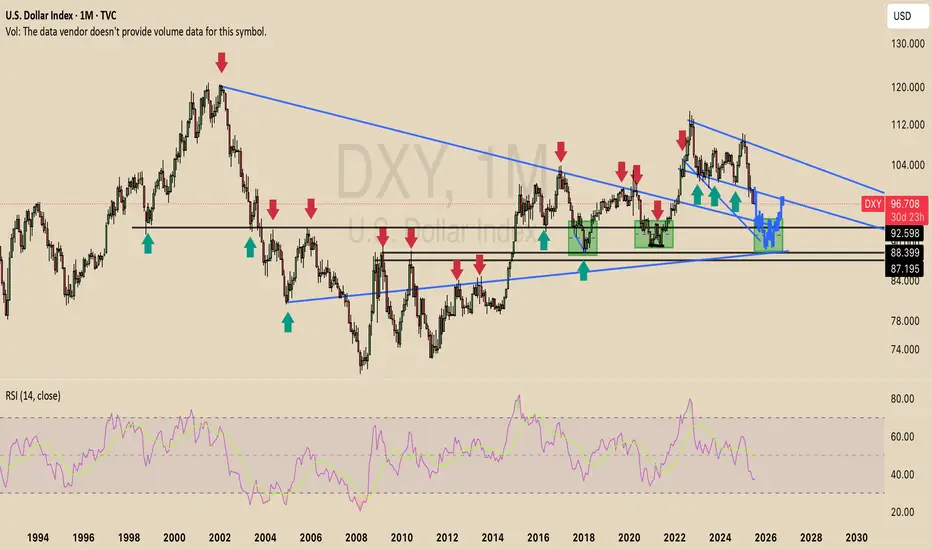
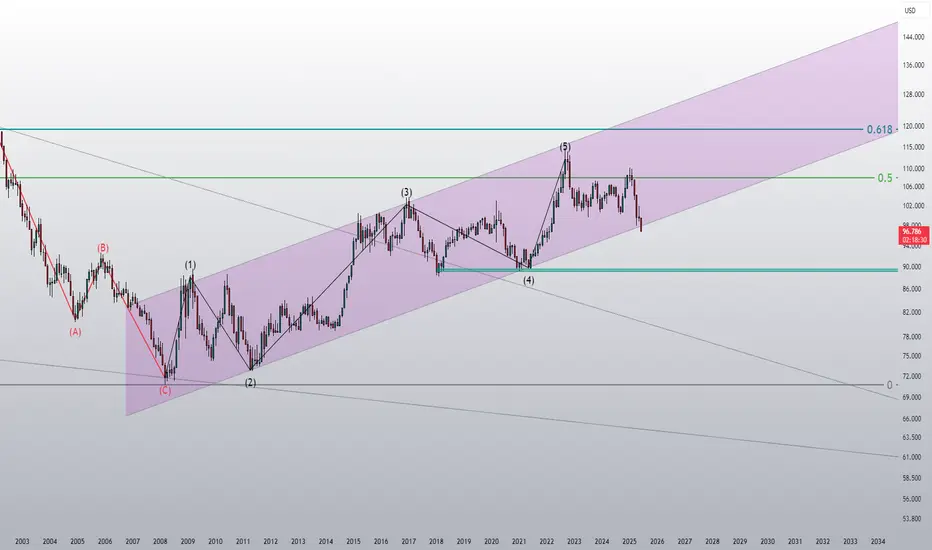
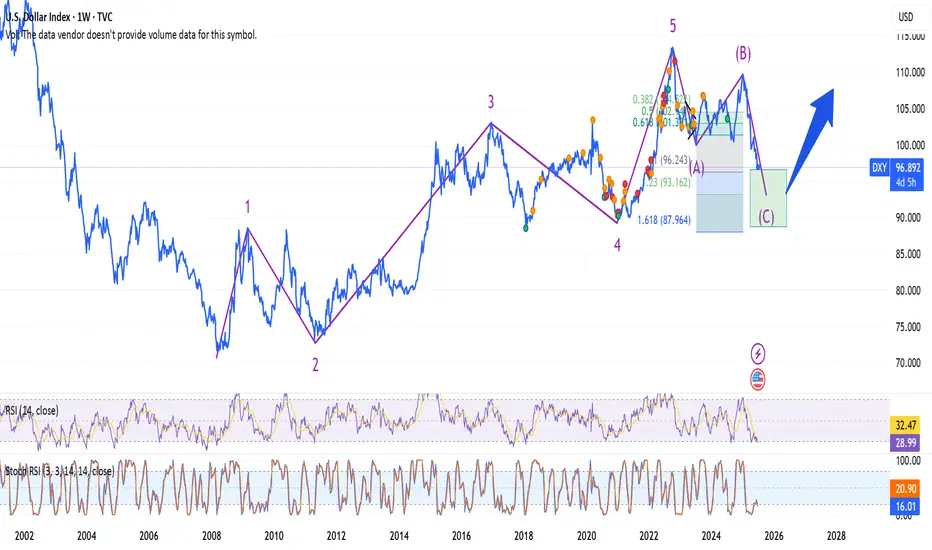
The DXY is currently 6.5% above the midpoint of a critical confluence zone ("the box") on the monthly chart, where multiple trendlines and a key 50%/61.8% Fibonacci retracement level align to form a powerful support/resistance area. The monthly timeframe amplifies this zone’s strength, with price repeatedly respecting these trendlines (marked with arrows), confirming their reliability. The recent large retracement in the DXY signals a potential major move as it approaches this mega support. In 2017 and 2020, the DXY entered the box, consolidated for ~300 days, and then reclaimed higher, resuming an upward trend. I expect a similar pattern this time: a 6.5% drop to the box’s midpoint (aligned with the 50%/61.8% Fib zone), followed by ~300 days of consolidation and an upside breakout, potentially signaling a market top for risk assets. This high-conviction setup serves as a blueprint to de-risk and guide portfolio decisions, such as trimming or adding to positions in stocks and crypto. Given the DXY’s inverse correlation with risk assets, a move into the box could favor accumulating risk asset positions, while an upside reclamation could prompt trimming to reduce exposure. Once the DXY nears this mega support, I’ll analyze lower timeframes (e.g., weekly, daily) for bottoming signals to confirm the reversal. Monitoring price action, volume, and candlestick patterns near the box is crucial for precise timing.
#DXY #TechnicalAnalysis #Fibonacci #Stocks #Crypto #HighConviction
S&P 500 - Confirmed New All Time HighPlease refer to our last post:
The S&P could now be gearing up for the run towards our 1.618 extension around $7k.
We just had a confirmed daily candle breakout above our white box which we have been eyeing for so long. This is the first signal of a major ATH breakout rally for the S&P.
However there is only one thing that could potentially hinder this rally. That would be the orange trendline I have drawn. If price gets rejected somewhere along this orange trendline and price falls back below the white box that would signal a few warning signs. The first would be a failed breakout and the second would be a massive bearish divergence forming on the HTF. With higher highs in price but strength continuing to get weaker keep an eye out for that.
So far things just look great, but just wanted to point that out as a potential scenario.
This look promising for Crypto!The DXY breaking below its trend channel is a really positive sign for risk assets like Bitcoin and Altcoins. Usually, a weak dollar means more money flows into risk assets. The DXY's technical target is 89, which is the level to watch for the end of the crypto bull run.
The fate has already been written, it's in your hands Neo. ;)Fate has already been written and their is no return, get ready ;)
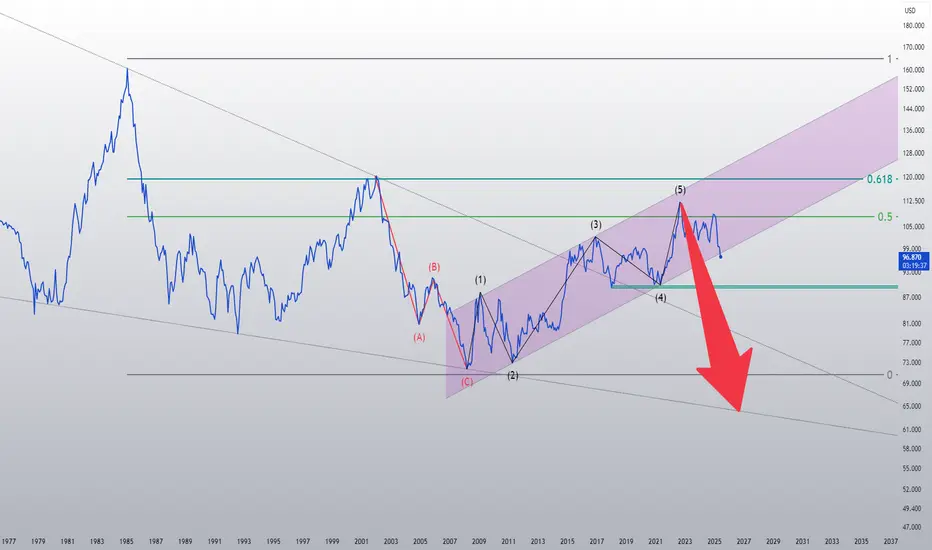
The DXY looks doomedI drew this chart in September 2022. Now, almost three years later, the DXY has broken below its channel.
Overfitting Will Break Your Strategy — Here’s Why█ Why Your Backtest Lies: A Quant’s Warning to Retail Traders
As a quant coder, I’ve seen it time and again: strategies that look flawless in backtests but fall apart in live markets.
Why? One word: overfitting.
Compare the signals in the images below. They’re from the same system, but one is overfitted, showing how misleading results can look when tuned too perfectly to the past.
⚪ Overfitting is what happens when you push a strategy to perform too well on historical data. You tweak it, optimize it, and tune every rule until it fits the past perfectly, including every random wiggle and fluke.
To retail traders, the result looks like genius. But to a quant, it’s a red flag .
█ Trading strategy developers have long known that “curve-fitting” a strategy to historical data (overfitting) creates an illusion of success that rarely holds up in live markets. Over-optimizing parameters to perfectly fit past price patterns may produce stellar backtest results, but it typically does not translate into real profits going forward.
In fact, extensive research and industry experience show that strategies tuned to past noise almost inevitably disappoint out-of-sample.
The bottom line: No one succeeds in markets by relying on a strategy that merely memorized the past — such “perfect” backtests are fool’s gold, not a future edge.
█ The Illusion of a Perfect Backtest
Overfitted strategies produce high Sharpe ratios, beautiful equity curves, and stellar win rates — in backtests. But they almost never hold up in the real world.
Because what you’ve really done is this:
You built a system that memorized the past, instead of learning anything meaningful about how markets work.
Live market data is messy, evolving, and unpredictable. An overfit system, tuned to every quirk of history, simply can’t adapt.
█ A Warning About Optimization Tools
There are many tools out there today — no-code platforms, signal builders, optimization dashboards — designed to help retail traders fine-tune and "optimize" their strategies.
⚪ But here’s the truth:
I can't stress this enough — do not rely on these tools to build or validate your strategy.
They make it easy to overfit.
They encourage curve-fitting.
They give false hope and lead to false expectations about how markets actually work.
⚪ The evidence is overwhelming:
Decades of academic research and real-world results confirm that over-optimized strategies fail in live trading. What looks good in backtests is often just noise, not edge.
This isn’t something I’ve made up or a personal theory.
It’s a well-documented, widely accepted fact in quantitative finance, supported by decades of peer-reviewed research and real-world results. The evidence is overwhelming. It’s not a controversial claim — it’s one of the most agreed-upon truths in the field.
█ Why Overfitting Fails
Let me explain it like I do to newer coders:
Random patterns don’t repeat: The patterns your strategy "learned" were noise. They won't show up again.
Overfitting kills the signal: Markets have a low signal-to-noise ratio. Fitting the noise means you've buried the signal.
Markets change: That strategy optimized for low-volatility or bull markets? It breaks in new regimes.
You tested too many ideas: Try enough combinations, and something will look good by accident. That doesn’t make it predictive.
█ The Research Backs It Up
Quantopian’s 888-strategy study:
Sharpe ratios from backtests had almost zero predictive power for live returns.
The more a quant optimized a strategy, the worse it performed live.
Bailey & López de Prado’s work:
After testing enough variations, you’re guaranteed to find something that performs well by chance, even if it has no edge.
█ My Advice to Retail Traders
If your strategy only looks great after a dozen tweaks… It’s probably overfit.
If you don’t validate on out-of-sample data… you’re fooling yourself.
If your equity curve is “too good” to be true… it probably is.
Real strategies don’t look perfect — they look robust. They perform decently across timeframes, markets, and conditions. They don’t rely on lucky parameter combos or obscure filters.
█ What to Do Instead
Use out-of-sample and walk-forward testing
Stick to simpler logic with fewer parameters
Ground your system in market rationale, not just stats
Risk management over performance maximization
Expect drawdowns and variability
Treat backtest performance as a rough guide, not a promise
Overfitting is one of the biggest traps in strategy development.
If you want your trading strategy to survive live markets, stop optimizing for the past. Start building for uncertainty. Because the market doesn’t care how well your model memorized history. It cares how well it adapts to reality.
-----------------
Disclaimer
The content provided in my scripts, indicators, ideas, algorithms, and systems is for educational and informational purposes only. It does not constitute financial advice, investment recommendations, or a solicitation to buy or sell any financial instruments. I will not accept liability for any loss or damage, including without limitation any loss of profit, which may arise directly or indirectly from the use of or reliance on such information.
All investments involve risk, and the past performance of a security, industry, sector, market, financial product, trading strategy, backtest, or individual's trading does not guarantee future results or returns. Investors are fully responsible for any investment decisions they make. Such decisions should be based solely on an evaluation of their financial circumstances, investment objectives, risk tolerance, and liquidity needs.
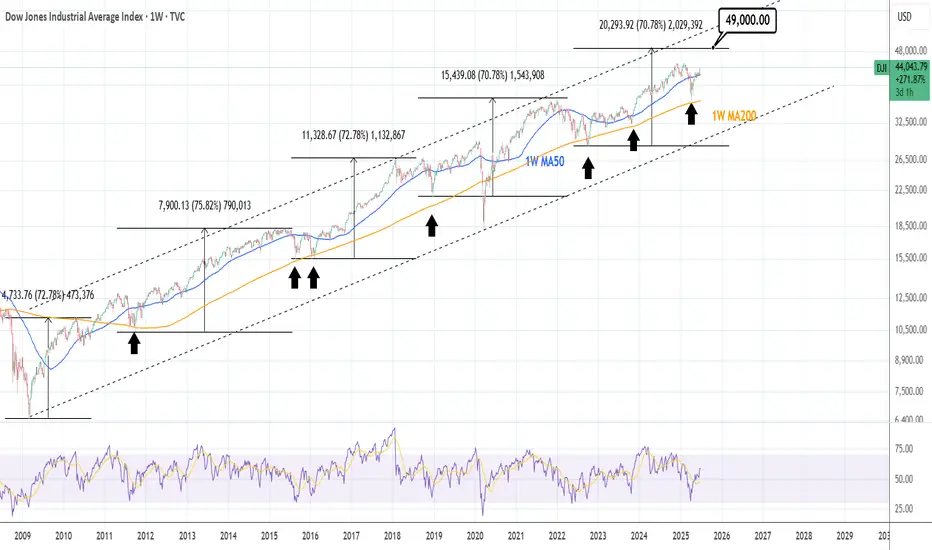
DOW JONES: Final phase of bullish wave has started.Dow is practically overbought on its 1D technical outlook (RSI = 69.306, MACD = 518.450, ADX = 36.217) but that should little affect the heavily bullish price action on the long term. The reason is that after the April bounce on the 1W MA200, Dow entered the final phase of the Bull Cycle that started on the October 2022 bottom and according to all prior bullish waves inside the 16 year Channel Up, it should rise by a minimum of +71%. That gives a TP = 49,000.
## If you like our free content follow our profile to get more daily ideas. ##
## Comments and likes are greatly appreciated. ##
DXY USD Dollar Bearish Short term, then bullishI am not a financial advisor. This is not meant to be and does not constitute financial, investment, trading, or any other types of advice or recommendation.
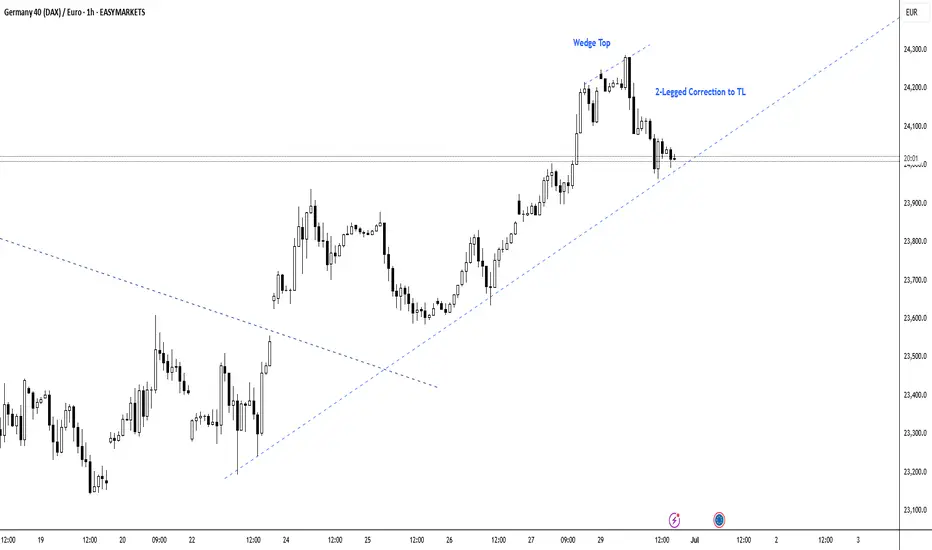
DAX Long Position ManagementI'm long on DAX since last week, but market made a sharp and strong correction today. Bears showed a lot of strength today, so tomorrow is going to be key.
If the market bounces of the bull trendline me might see another leg up to the previous high. But given the strength of this pullback, the probability of getting to the All Time High in the next few days is much lower than I thought. This way, I'm watching closely to see if the market is going to bounce. Even if it does, if the momentum is not extremely strong, I'll be trailing my SL and exit with a smaller profit.
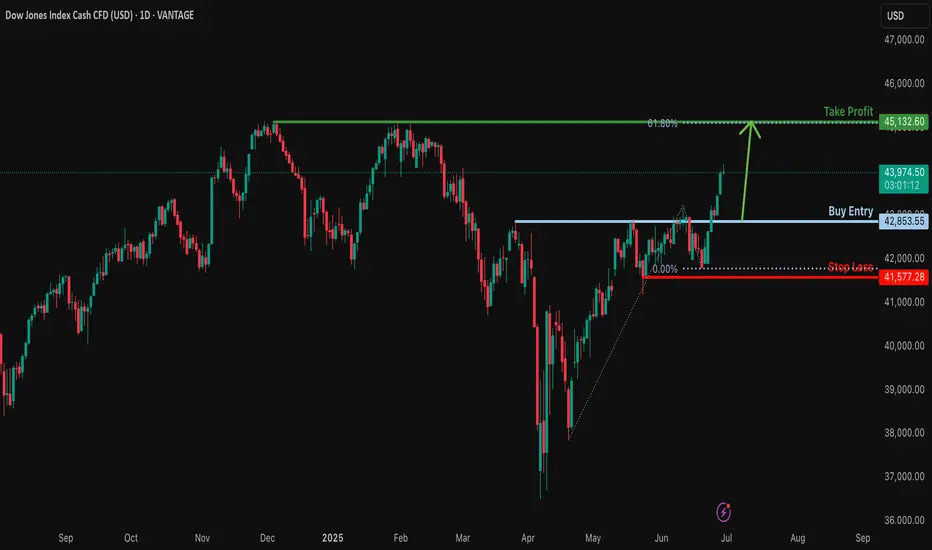
Bullish momentum to extend?DJ30 is falling towards the support level which is a pullback support and could bounce from this level to our take profit.
Entry: 42,853.55
Why we like it:
There is a pullback support level.
Stop loss: 41,577.28
Why we like it:
There is a pullback support level.
Take profit: 45,132.60
Why we like it:
There is a pullback resistance that lines up with the 61.8% Fibonacci projection.
Enjoying your TradingView experience? Review us!
Please be advised that the information presented on TradingView is provided to Vantage (‘Vantage Global Limited’, ‘we’) by a third-party provider (‘Everest Fortune Group’). Please be reminded that you are solely responsible for the trading decisions on your account. There is a very high degree of risk involved in trading. Any information and/or content is intended entirely for research, educational and informational purposes only and does not constitute investment or consultation advice or investment strategy. The information is not tailored to the investment needs of any specific person and therefore does not involve a consideration of any of the investment objectives, financial situation or needs of any viewer that may receive it. Kindly also note that past performance is not a reliable indicator of future results. Actual results may differ materially from those anticipated in forward-looking or past performance statements. We assume no liability as to the accuracy or completeness of any of the information and/or content provided herein and the Company cannot be held responsible for any omission, mistake nor for any loss or damage including without limitation to any loss of profit which may arise from reliance on any information supplied by Everest Fortune Group.