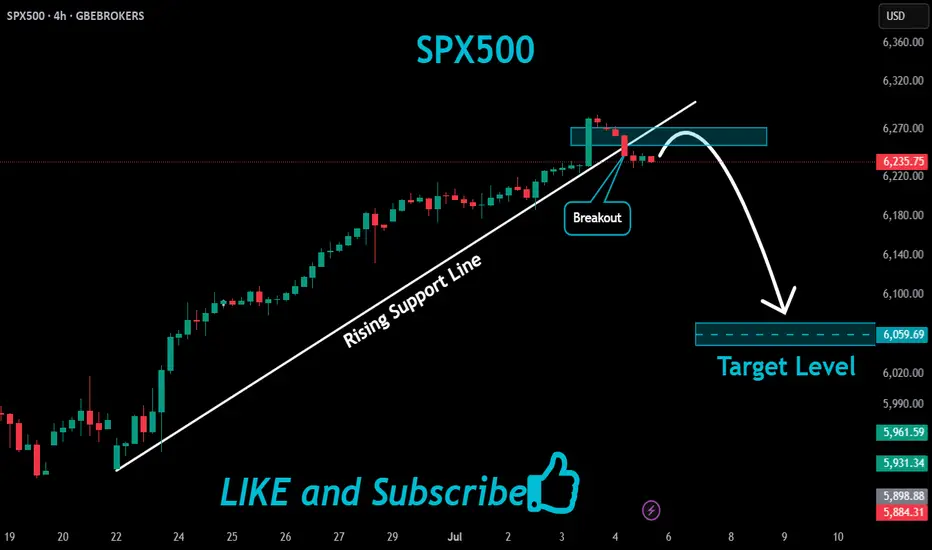
SPX500 Bearish Breakout!
HI,Traders !
#SPX500 was trading along
The rising support line but
Now we are seeing a bearish
Breakout so we are bearish
Biased and we will be expecting
A further bearish move down !
Comment and subscribe to help us grow !
Market indices
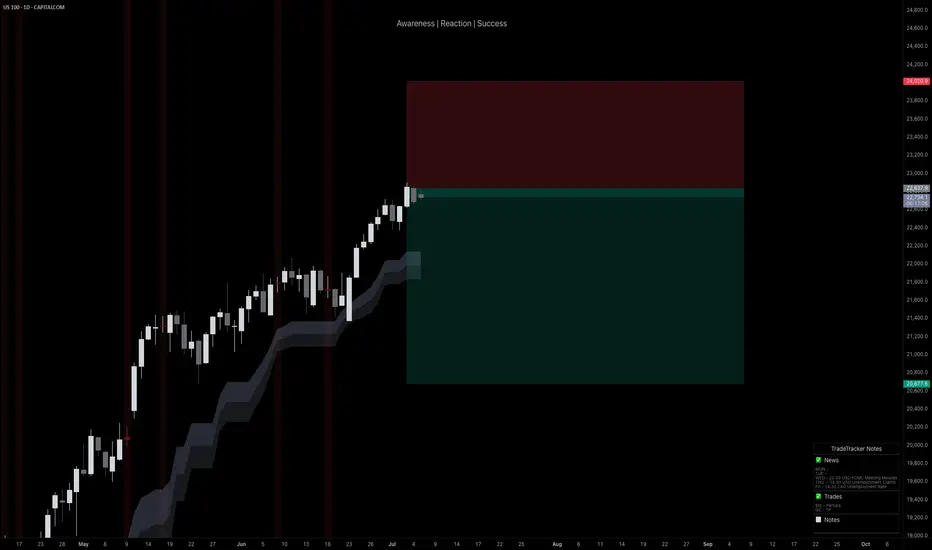
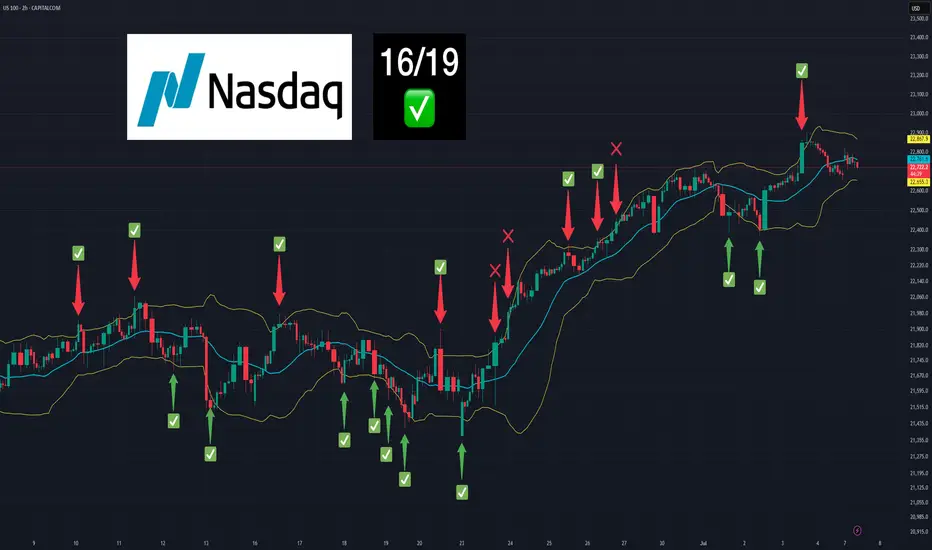
NASDAQ After the Fireworks: Bearish Setup LoadedAfter the classic 4th of July rally, I stepped in on the short side of Nasdaq, targeting 22,000 and 21,400 zones. The market structure shows exhaustion, and with the cloud retest failing to hold new highs, I positioned accordingly.
Technical:
• Price stalled at prior expansion highs with tight compression near 23,000.
• Daily FibCloud offered resistance confirmation.
• Bearish risk-reward skew forms after extended rally and thin retraces.
• Volume divergence spotted.
Fundamentals:
Multiple overlapping uncertainties:
• Trump confirmed tariffs will take effect on August 1, threatening a 10% surcharge on BRICS-aligned nations.
• Treasury Secretary Bessent anticipates several trade deal announcements within 48h—but stresses quality over quantity.
• Bank of America maintains its base case of 0 rate cuts in 2025, citing strong economic data and sticky inflation risks.
The combination of tariff escalation, hawkish monetary expectations, and global trade friction creates a perfect backdrop for volatility and correction—especially in overextended tech indices like the Nasdaq.
Note: Please remember to adjust this trade idea according to your individual trading conditions, including position size, broker-specific price variations, and any relevant external factors. Every trader’s situation is unique, so it’s crucial to tailor your approach to your own risk tolerance and market environment.
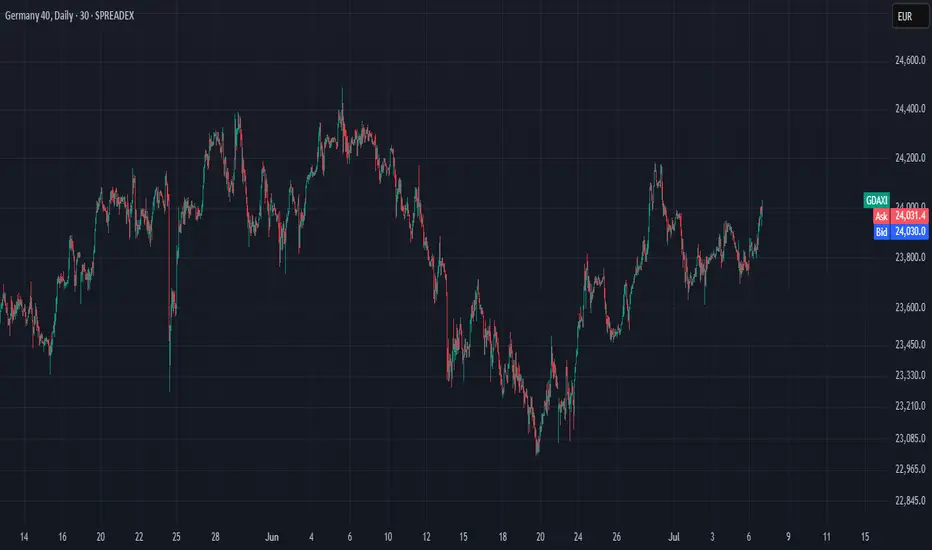
Technical Weekly AnalysisStart your week by identifying the key price levels and trends.
The SpreadEx Research team has analysed the most popular markets, including stocks, indices, commodities & forex.
--------------------------------------------------------------------------------------------------------------
Analysis
Germany 40 is currently in a neutral trend, moving within a range phase. It's trading at 23,851, holding above its VWAP of 23,582, suggesting limited directional conviction. The RSI at 53 indicates a balanced market. Support is at 22,985, while resistance is at 24,179.
UK 100 remains in a neutral trend and range phase, hovering around its VWAP at 8,800, with price at 8,805. This shows a lack of strong momentum. The RSI at 53 confirms indecision. Support lies at 8,734, while resistance is at 8,881.
Wall Street continues its bullish trend and is in an extended impulsive phase, trading at 44,681, significantly above its VWAP of 43,119. This highlights ongoing upside strength. The RSI at 72 suggests the market has entered overbought conditions. Support is seen at 41,002, with resistance at 45,236.
Brent Crude is in a neutral trend and range phase, trading at 6,802, still below the VWAP of 7,045 following the steep correction. This implies modest weakness. The RSI at 48 supports the lack of strong momentum. Support is at 6,217, while resistance is at 7,873.
Gold remains in a neutral range-bound trend underneath record highs, currently priced at 3,310, just under its VWAP of 3,347. The RSI at 46 signals a lack of directional conviction. Support is at 3,262, with resistance at 3,432.
EUR/USD is bullish and in an impulsive phase, with price at 1.1748, well above its VWAP of 1.1646 and at a multi-year high. The RSI at 65 after reaching overbought conditions is a warning sign. Support is at 1.1402, with resistance extending to 1.8897.
GBP/USD holds a bullish trend and is in a pullback phase after hitting a multi-year high, trading at 1.3606, right in line with its VWAP. RSI at 51 indicates neutral momentum with signs of bearish divergence from price. Support is seen at 1.3373, with resistance at 1.3818.
USD/JPY is in a neutral trend and range phase, trading at 145.06, matching its VWAP level. This equilibrium reflects indecision. The RSI at 53 aligns with a directionless market. Support sits at 143.28, with resistance at 146.34.
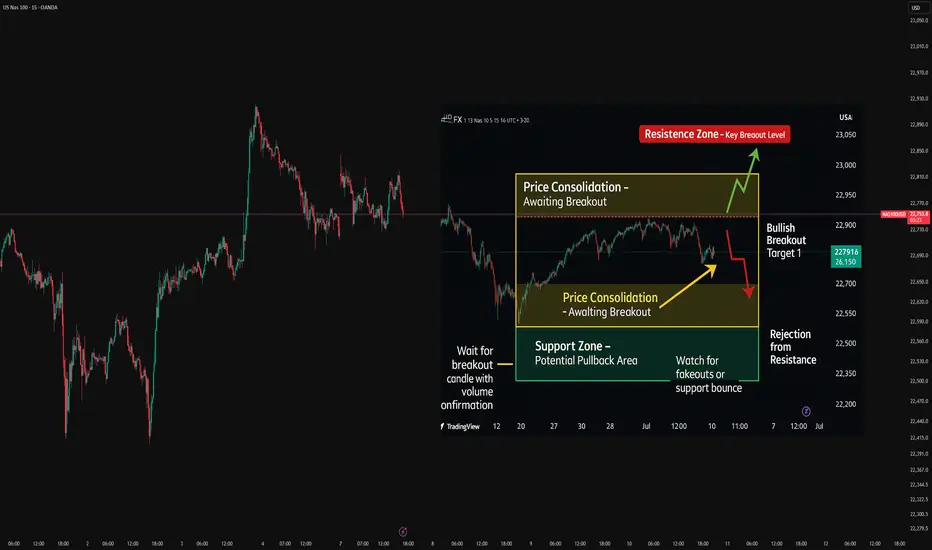
Technical Analysis – NAS100 (15min)Chart Overview Date: July 7, 2025
Market: NAS100 (US Tech 100 Index)
Timeframe: 15-Minute
Chart Context: Clean with Price Action Focus
🧠 Market Structure
Overall uptrend structure since June 21st – higher highs and higher lows.
Key resistance zone: 22,900 – price was rejected here multiple times.
Support area: 22,500 – formed after bullish impulsive move and retest.
🎯 Entry Scenario
Currently in a sideways consolidation between 22,700 – 22,900.
A break above 22,900 with strong volume can lead to a bullish continuation.
Alternatively, a rejection near 22,900 with bearish engulfing candle may offer a short scalp back toward 22,700.
📈 Bias & Confirmation
Trend Bias: Bullish
Wait for:
Breakout and close above resistance for long.
Rejection and bearish signal at resistance for short.
📌 Plan
Type Trigger SL TP Target 1 TP Target 2
Long Break & close >22,900 <22,800 23,050 23,150
Short Rejection @22,900 >22,950 22,720 22,600
"📊 Clean and structured technical analysis on NAS100 – Currently consolidating after a strong uptrend. Watching key levels around 22,900 for breakout or rejection scenario.
Trade safe. 📈 #ALIPFX #TechnicalAnalysis #NAS100"
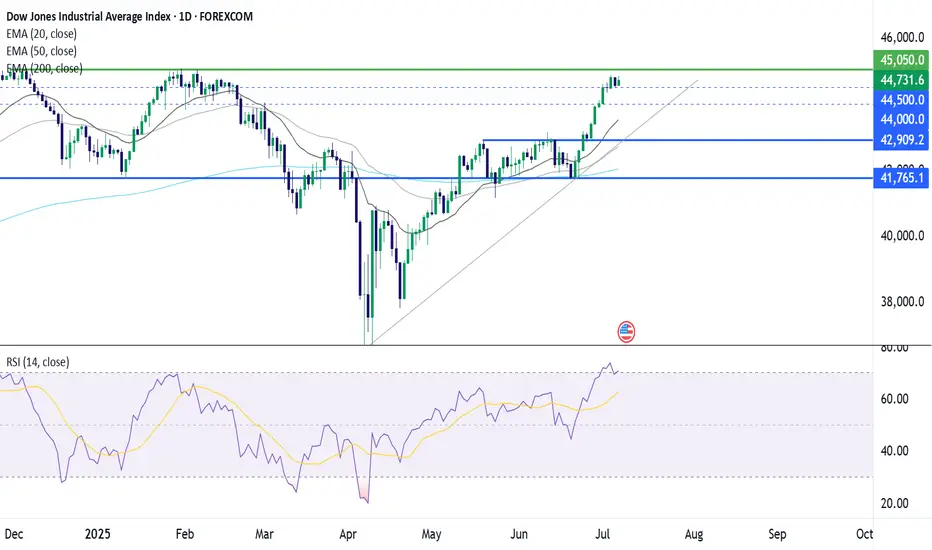
Dow Jones approaches 45kThe Dow Jones has extended its recovery to 44,800, just shy of its 45,000 record high reached in January. The RSI is tipping into overbought territory, so some consolidation could be on the cards. Buyers will look to extend the bullish run above 45,0000 to fresh record highs. Meanwhile, immediate support is at 44,500. Below here, 44,000 could offer some support. It would take a drop below 42,900 to negate the near-term bull trend.
FC
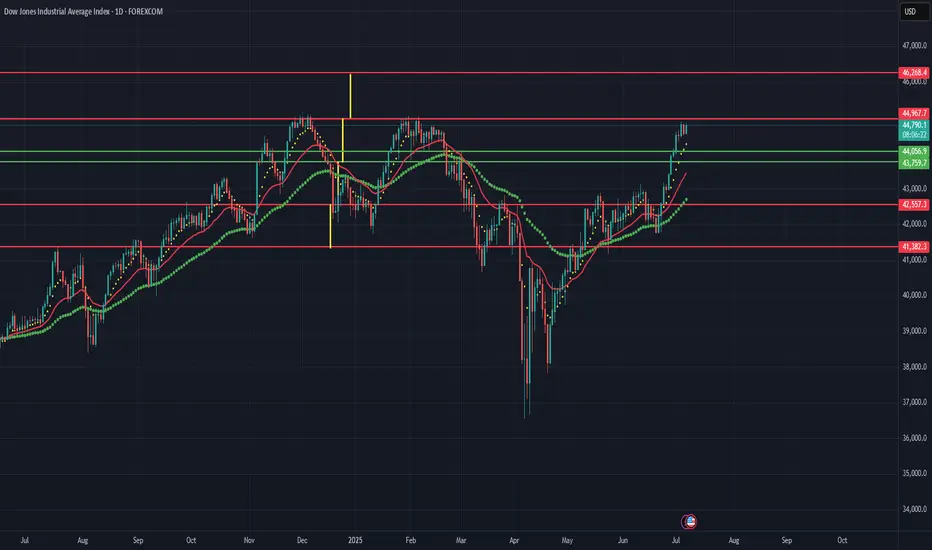
US30 // There is a strong resistance point at 44.967 level. In case you consider short trading at the level I mentioned, our take profit point is 8 ema.
Nasdaq Analysis 07-Jul-25In this video we are discussing the main fundamental reason behind Nasdaq bullish momentum.
In addition to area if interest with possible scenarios.
Disclaimer: easyMarkets Account on TradingView allows you to combine easyMarkets industry leading conditions, regulated trading and tight fixed spreads with TradingView's powerful social network for traders, advanced charting and analytics. Access no slippage on limit orders, tight fixed spreads, negative balance protection, no hidden fees or commission, and seamless integration.
Any opinions, news, research, analyses, prices, other information, or links to third-party sites contained on this website are provided on an "as-is" basis, are intended only to be informative, is not an advice nor a recommendation, nor research, or a record of our trading prices, or an offer of, or solicitation for a transaction in any financial instrument and thus should not be treated as such. The information provided does not involve any specific investment objectives, financial situation and needs of any specific person who may receive it. Please be aware, that past performance is not a reliable indicator of future performance and/or results. Past Performance or Forward-looking scenarios based upon the reasonable beliefs of the third-party provider are not a guarantee of future performance. Actual results may differ materially from those anticipated in forward-looking or past performance statements. easyMarkets makes no representation or warranty and assumes no liability as to the accuracy or completeness of the information provided, nor any loss arising from any investment based on a recommendation, forecast or any information supplied by any third-party.

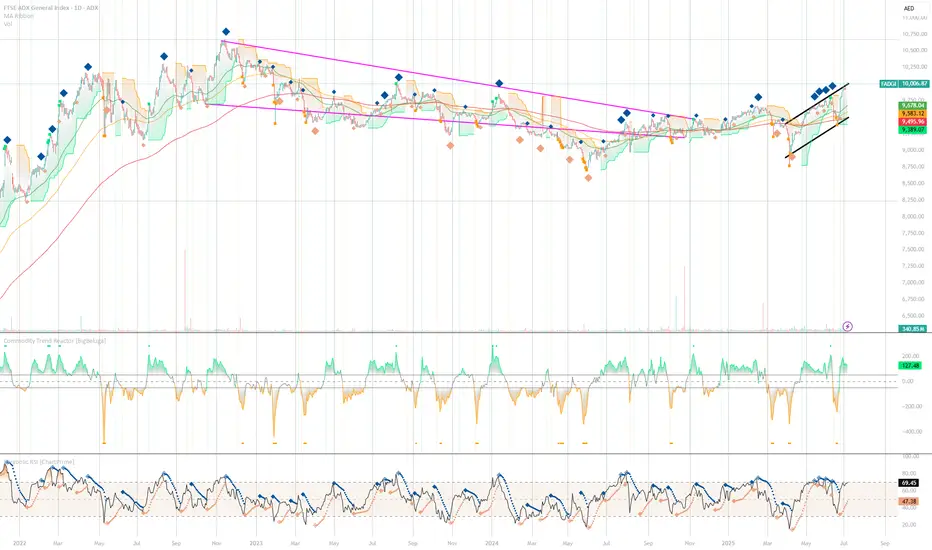
ADX ready for take off?📈 Current Price & Volume
• The index closed most recently around 9,981.5 AED—near its 52‑week high of 10,000.87 AED
• Today’s trading volume was unusually strong—roughly triple the 3‑month average—which often signals a potential trend shift ().
⸻
🔍 Technical Summary (Investing.com)
• Overall stance: Strong Buy across daily, weekly, and monthly timeframes .
• Oscillators (RSI, MACD, ADX) are bullish:
• RSI at ~68 indicating bullish momentum (just below overbought)
• ADX trend strength at ~36 
• Moving Averages: All key averages (5, 10, 20, 50, 100, 200) show Buy signals .
⸻
📊 Chart Pattern Insights
• TradingView commentary suggests a breakout from a falling wedge—a bullish reversal pattern.
• The index has moved into a confirmation phase, consolidating near all-time highs before the next leg up ().
⸻
⚙️ Support & Resistance Levels
• Resistance: Around pivot zone of 10,001–10,021 AED (R1–R2 from pivot points) .
• Support: Established near the 9,800 AED range, close to prior breakout point.
⸻
🧭 Summary of Technical Trend
• Strong uptrend momentum, validated by multi-timeframe buy signals.
• Fresh breakout from wedge pattern suggests further upside potential.
• Elevated volume supports sustainability of this rally.
⸻
➤ NOTES:
• Bullish Momentum: Strong buy signals across oscillators and moving averages; trend strength confirmed by ADX.
• Pattern Breakout: Completion and breakout above falling wedge indicates reversal into bullish phase.
• Support Surround: Healthy volume and solid support around 9,800 AED reduce short-term downside risk.
⸻
🗂️ Tactical Setup
• Entry: On a clean break above 10,021 AED (R2 pivot) with sustained volume.
• Target: Next resistance zone near 10,200–10,300 AED.
• Stop-loss: Below 9,800 AED support area.
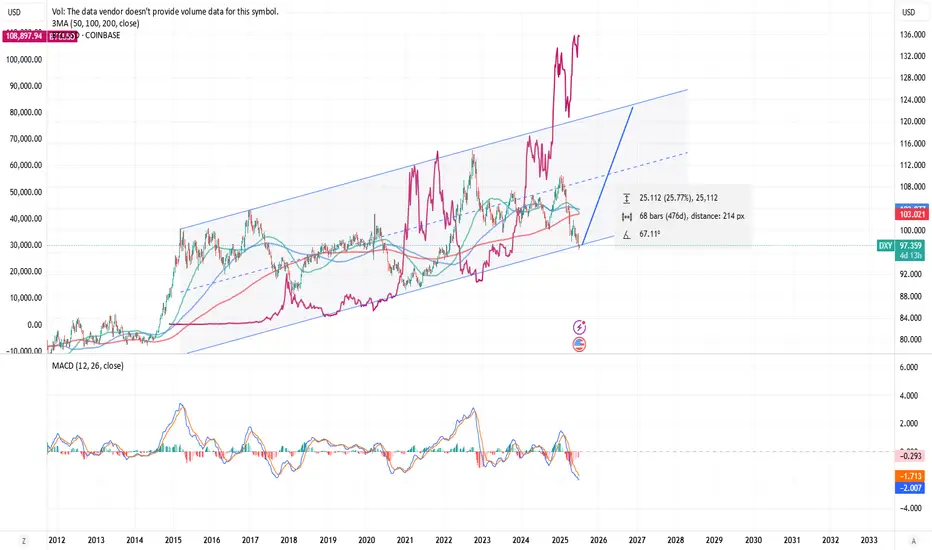
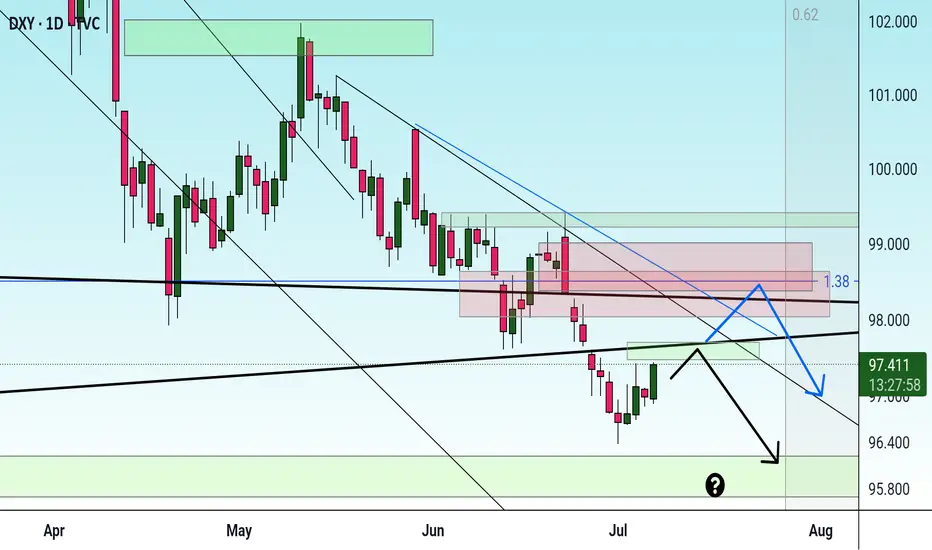
Potential USD Strengthening Ahead | DXY vs BTCUSD Outlook
⚡ The DXY has now reached the lower boundary of its long-term ascending channel, a historically significant technical zone where rebounds have occurred in the past.
💡 If this pattern holds, a strong rebound towards the 121 level on the DXY looks probable in the coming months.
What does this mean for BTC?
Historically, a strengthening USD has often resulted in a reciprocal effect on BTCUSD, leading to downward pressure on Bitcoin prices. The chart suggests that if the DXY rebounds as expected, BTCUSD could witness a significant decline proportionate to the USD's strength.
Key Takeaways:
✅ DXY at crucial technical support – rebound likely.
✅ Target for DXY: 121 zone.
✅ BTCUSD may face downside pressure as USD strengthens.
✅ MACD showing early signs of bullish reversal potential for DXY.
Note: This is a technical analysis-based view. Always use risk management and combine multiple factors before trading decisions. For Educational purpose only.
💬 What are your thoughts? Will the USD rally put pressure on Bitcoin again? Share below!
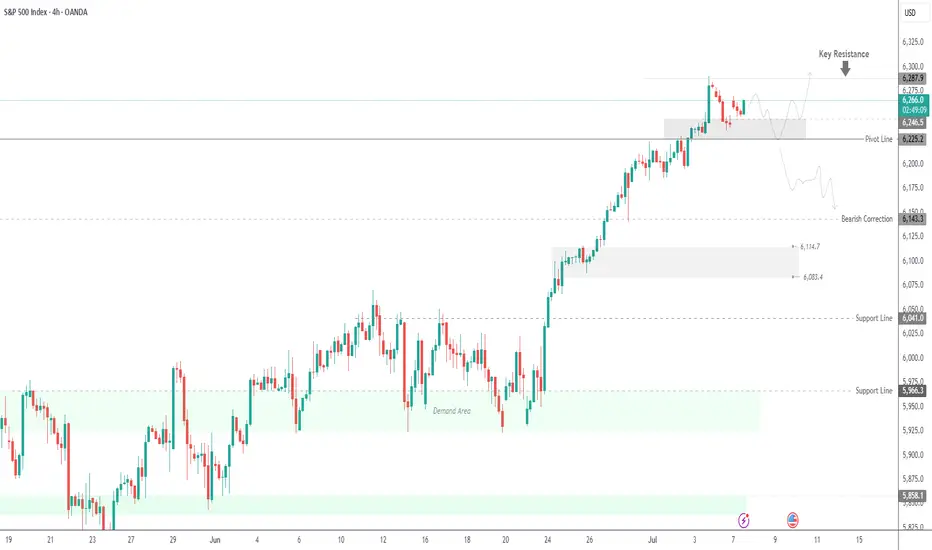
SPX500 Holding Bullish Structure – Eyes on 6287 BreakoutSPX500
The price maintains bullish momentum as long as it remains above 6225 and 6246.
Currently, the market is approaching the 6287 resistance level. A confirmed 4H candle close above 6287 is required to validate continuation of the bullish trend toward 6325.
However, a rejection from 6287 may trigger a short-term bearish correction, with potential pullbacks toward 6246 and 6225.
A sustained break below 6225 would shift the momentum to the downside, targeting the 6143 support level.
Pivot Level: 6264
Resistance: 6287 – 6325
Support: 6246 – 6225 – 6143
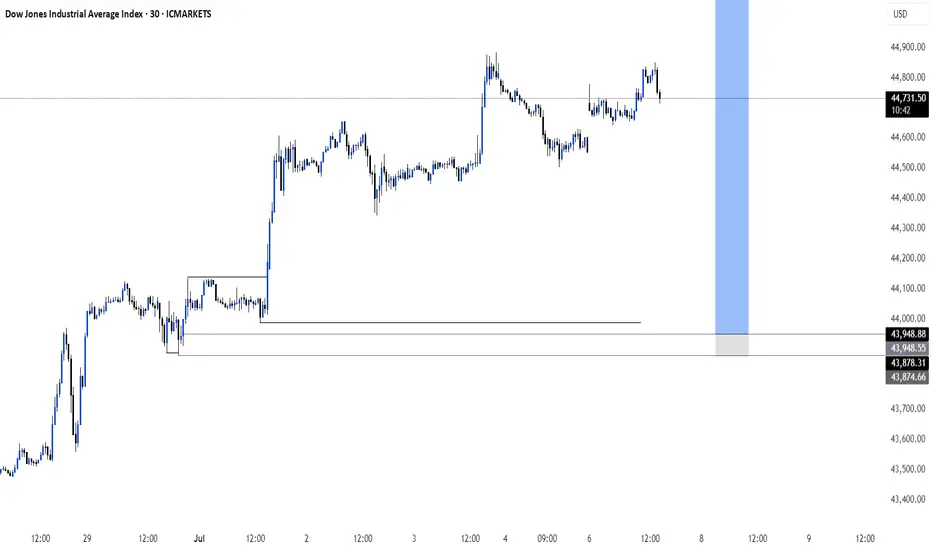
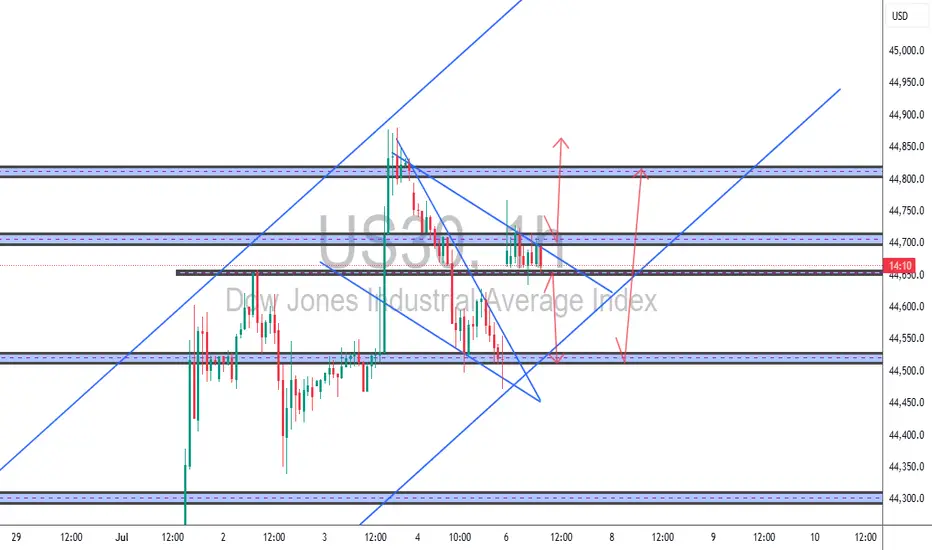
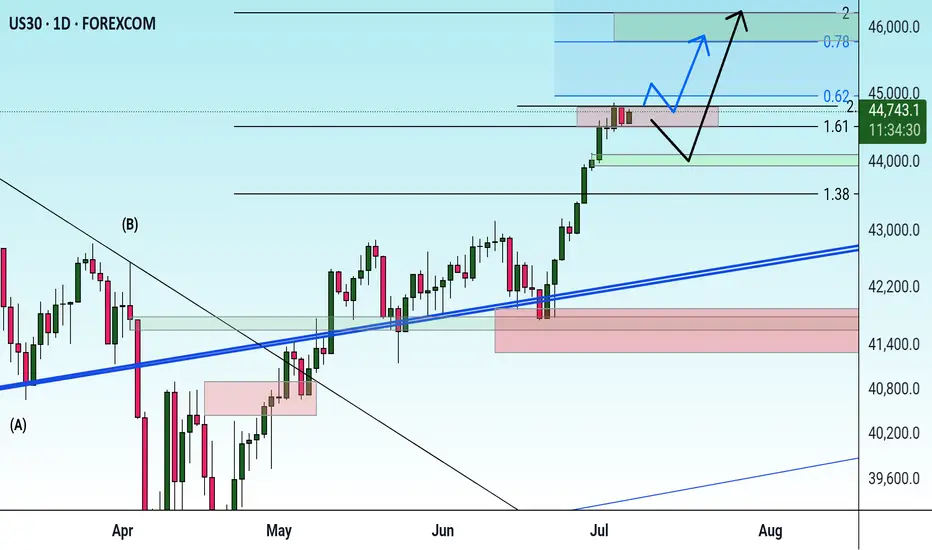
US30 – Bullish Breakout Retest Play (1H + 15M Confluence)US30 – Bullish Breakout Retest Play (1H + 15M Confluence)
Price has broken out of descending channel and is now retesting the 44,671–723 zone. 1H chart confirms bullish momentum within a broader uptrend. Watching for clean retest → continuation move towards 44,850+. Checklist Score: ✅ 9/10.
#US30 #DowJones #TCBstrategy #BreakoutRetest #SmartMoney #PriceAction
📌 Journal Summary Entry:
US30 Compression Play – July 7
Watching 44,723.1 key supply zone for decision. Price consolidating under zone with descending trendline. Two options: (1) Short on rejection with 2R+ to 44,512.3 demand or (2) Long breakout above 44,723 with target at 44,850–900 zone. Scored 8/10 on TCB checklist. Awaiting confirmation candle during NY session.
NIFTY 50 CHART ANALYSIS INTRADAYHere I give you a chart analysis on Nifty 50 for 8th July 2025. intraday trend is neutral and
mid trend is Berish but price to shifted to bullish trend. let's see what will happen in upcoming days.
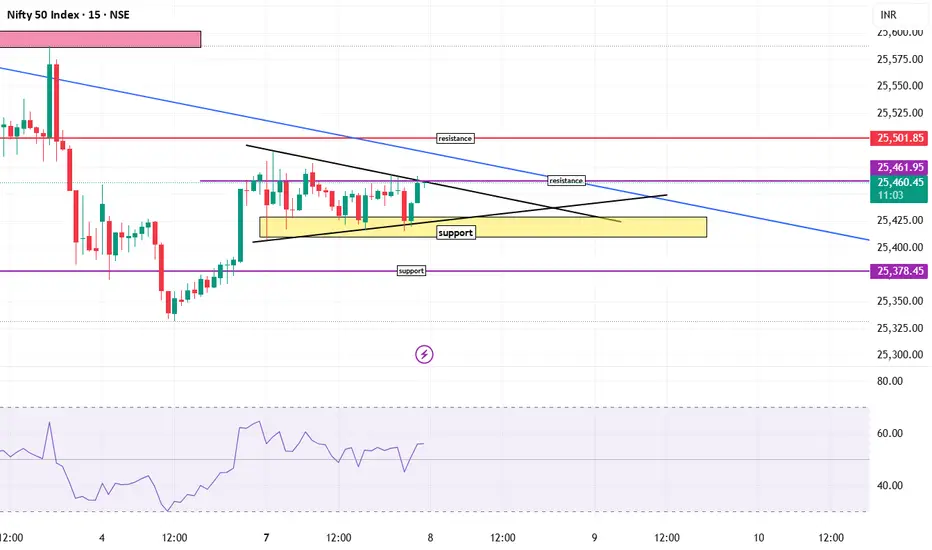
Check the trend It is expected that a trend change will form at the current resistance level and a continuation of the downtrend will form. Otherwise, the continuation of the uptrend to the specified resistance levels will be possible and then there will be a possibility of a trend change at the specified resistance levels.
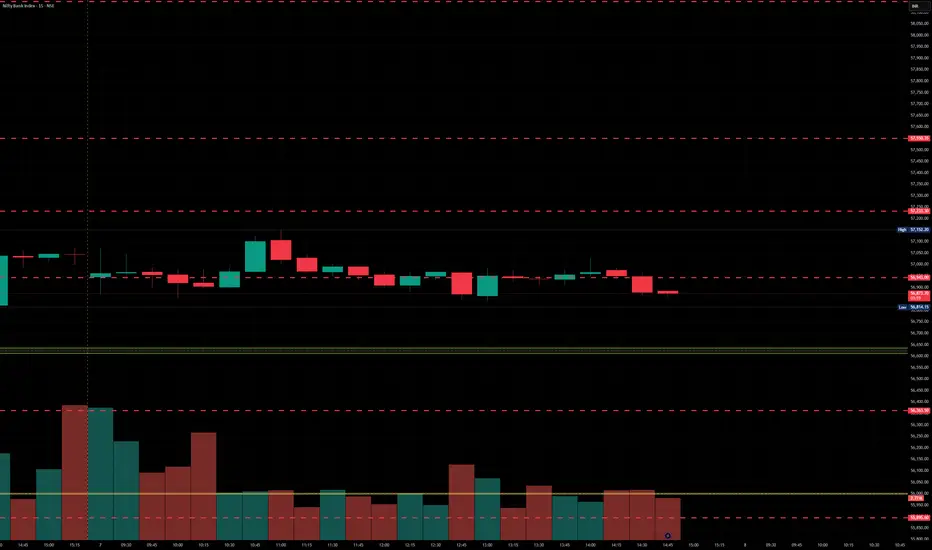
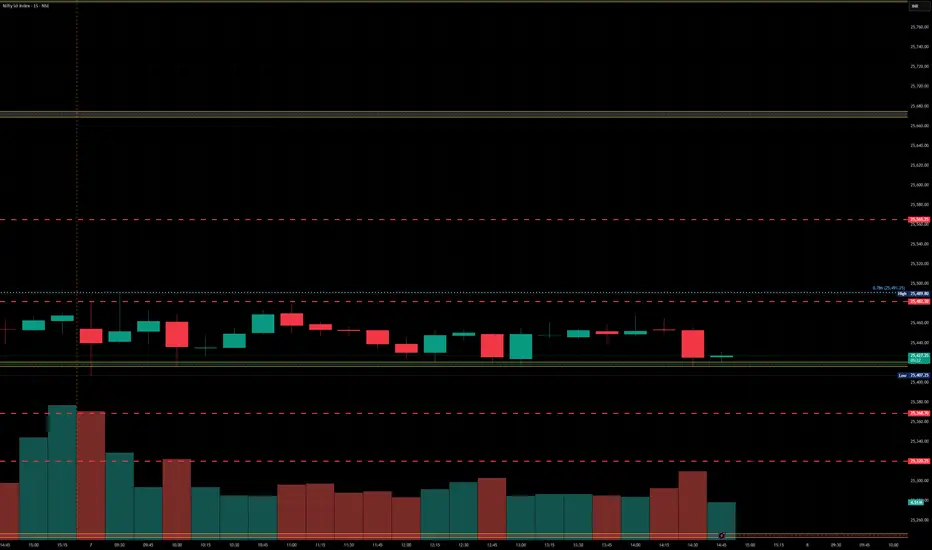
BankNifty levels - Jul 08, 2025Utilizing the support and resistance levels of BankNifty, along with the 5-minute timeframe candlesticks and VWAP, can enhance the precision of trade entries and exits on or near these levels. It is crucial to recognize that these levels are not static, and they undergo alterations as market dynamics evolve.
The dashed lines on the chart indicate the reaction levels, serving as additional points of significance. Furthermore, take note of the response at the levels of the High, Low, and Close values from the day prior.
We trust that this information proves valuable to you.
* If you found the idea appealing, kindly tap the Boost icon located below the chart. We encourage you to share your thoughts and comments regarding it.
Wishing you successful trading endeavors!
Upward trend Given the behavior of the index within the current resistance range, possible scenarios have been identified. It is expected that a trend change will take place and we will witness the beginning of a correction. With consolidation above the resistance range, the continuation of the upward trend will be likely.
Nifty levels - Jul 08. 2025Nifty support and resistance levels are valuable tools for making informed trading decisions, specifically when combined with the analysis of 5-minute timeframe candlesticks and VWAP. By closely monitoring these levels and observing the price movements within this timeframe, traders can enhance the accuracy of their entry and exit points. It is important to bear in mind that support and resistance levels are not fixed, and they can change over time as market conditions evolve.
The dashed lines on the chart indicate the reaction levels, serving as additional points of significance to consider. Furthermore, take note of the response at the levels of the High, Low, and Close values from the day prior.
We hope you find this information beneficial in your trading endeavors.
* If you found the idea appealing, kindly tap the Boost icon located below the chart. We encourage you to share your thoughts and comments regarding it.
Wishing you success in your trading activities!
Bollinger Bands: How to Stop Being a Slave to the Markets.Bollinger Bands are a technical analysis indicator widely used in trading to assess the volatility of a financial asset and anticipate price movements. Created in the 1980s by John Bollinger, they consist of three lines superimposed on the price chart:
The middle band: a simple moving average, generally calculated over 20 periods.
The upper band: the moving average to which two standard deviations are added.
The lower band: the moving average to which two standard deviations are subtracted.
These bands form a dynamic channel around the price, which widens during periods of high volatility and narrows when the market is calm. When a price touches or exceeds a band, it can signal an overbought or oversold situation, or a potential trend reversal or continuation, depending on the market context.
What are Bollinger Bands used for?
Measuring volatility: The wider the bands, the higher the volatility.
Identify dynamic support and resistance zones.
Detect market excesses: A price touching the upper or lower band may indicate a temporary excess.
Anticipate reversals or consolidations: A tightening of the bands often heralds an upcoming burst of volatility.
Why is the 2-hour time frame so widely used and relevant?
The 2-hour (H2) time frame (TU) is particularly popular with many traders for several reasons:
Perfect balance between noise and relevance: The H2 offers a compromise between very short time frames (often too noisy, generating many false signals) and long time frames (slower to react). This allows you to capture significant movements without being overwhelmed by minor fluctuations.
Suitable for swing trading and intraday trading: This TU allows you to hold a position for several hours or days, while maintaining good responsiveness to take advantage of intermediate trends.
Clearer reading of chart patterns: Technical patterns (triangles, double tops, Wolfe waves, etc.) are often clearer and more reliable on H2 than on shorter time frames, making decision-making easier.
Less stress, better time management: On H2, there's no need to constantly monitor screens. Monitoring every two hours is sufficient, which is ideal for active traders who don't want to be slaves to the market.
Statistical relevance: Numerous backtests show that technical signals (such as those from Bollinger Bands) are more robust and less prone to false signals on this intermediate time frame.
In summary, the 2-hour time frame is often considered "amazing" because it combines the precision of intraday trading with the reliability of swing trading, thus providing superior signals for most technical strategies, particularly those using Bollinger Bands.
To summarize
Bollinger Bands measure volatility and help identify overbought/oversold areas or potential reversals.
The 2-hour timeframe is highly valued because it filters out market noise while remaining sufficiently responsive, making it particularly useful for technical analysis and trading decision-making.
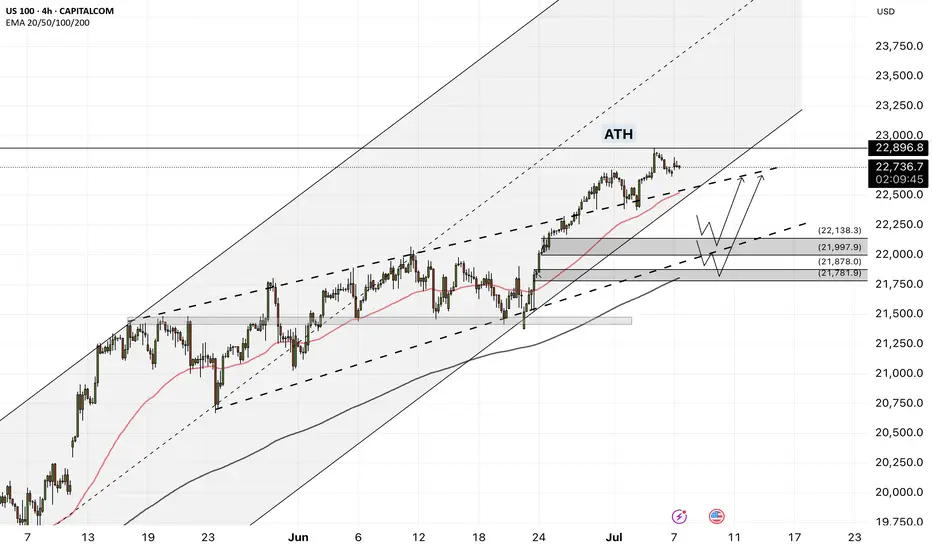
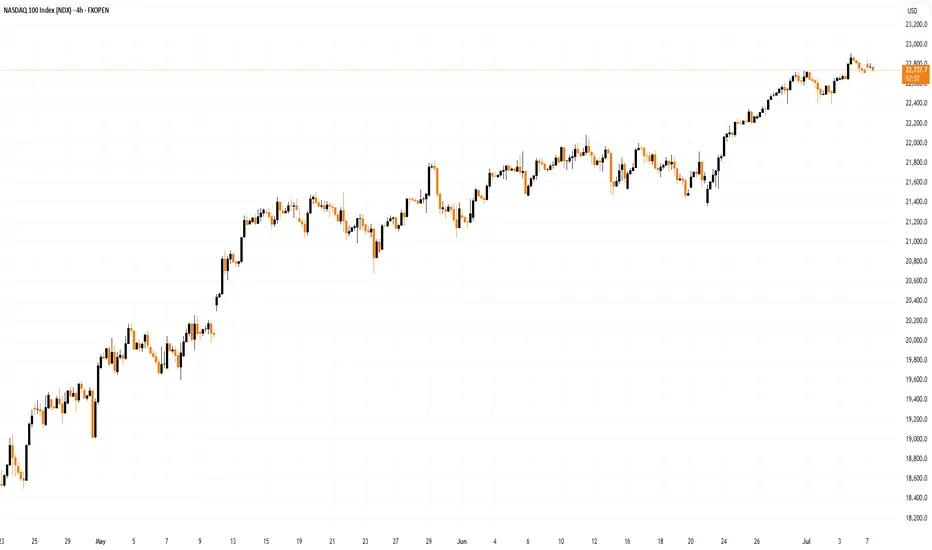
Nasdaq 100: Bearish Signals Near the All-Time HighNasdaq 100: Bearish Signals Near the All-Time High
As the 4-hour chart of the Nasdaq 100 (US Tech 100 mini on FXOpen) shows, the index reached a new all-time high last week. However, the price action suggests that the current pace of growth may not last.
Last week’s strong labour market data triggered a significant bullish impulse. However, the upward momentum has been entirely retraced (as indicated by the arrows).
The tax cut bill signed on Friday, 4 July, by Trump — which is expected to lead to a significant increase in US government debt — contributed to a modest bullish gap at today’s market open. Yet, as trading progressed during the Asian session, the index declined.
This suggests that fundamental news, which could have served as bullish catalysts, are failing to generate sustainable upward movement — a bearish sign.
Further grounds for doubt regarding the index's continued growth are provided by technical analysis of the Nasdaq 100 (US Tech 100 mini on FXOpen) chart, specifically:
→ a bearish divergence on the RSI indicator;
→ price proximity to the upper boundary of the ascending channel, which is considered resistance.
It is reasonable to suggest that the market may be overheated and that bullish momentum is waning. Consequently, a correction may be forming — potentially involving a test of the 22,100 level. This level acted as resistance from late 2024 until it was broken by strong bullish momentum in late June.
This article represents the opinion of the Companies operating under the FXOpen brand only. It is not to be construed as an offer, solicitation, or recommendation with respect to products and services provided by the Companies operating under the FXOpen brand, nor is it to be considered financial advice.
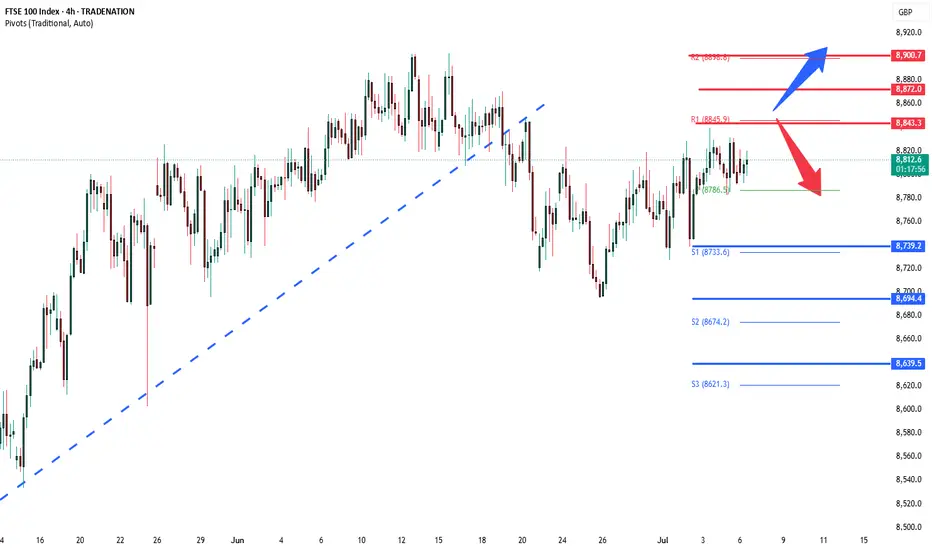
FTSE 8840 resistance retestThe FTSE remains in a bullish trend, with recent price action showing signs of a corrective pullback within the broader uptrend.
Support Zone: 8740 – a key level from previous consolidation. Price is currently testing or approaching this level.
A bullish rebound from 8740 would confirm ongoing upside momentum, with potential targets at:
8840 – initial resistance
8870 – psychological and structural level
8900 – extended resistance on the longer-term chart
Bearish Scenario:
A confirmed break and daily close below 8740 would weaken the bullish outlook and suggest deeper downside risk toward:
8695 – minor support
8640 – stronger support and potential demand zone
Outlook:
Bullish bias remains intact while the FTSE holds above 8740. A sustained break below this level could shift momentum to the downside in the short term.
This communication is for informational purposes only and should not be viewed as any form of recommendation as to a particular course of action or as investment advice. It is not intended as an offer or solicitation for the purchase or sale of any financial instrument or as an official confirmation of any transaction. Opinions, estimates and assumptions expressed herein are made as of the date of this communication and are subject to change without notice. This communication has been prepared based upon information, including market prices, data and other information, believed to be reliable; however, Trade Nation does not warrant its completeness or accuracy. All market prices and market data contained in or attached to this communication are indicative and subject to change without notice.
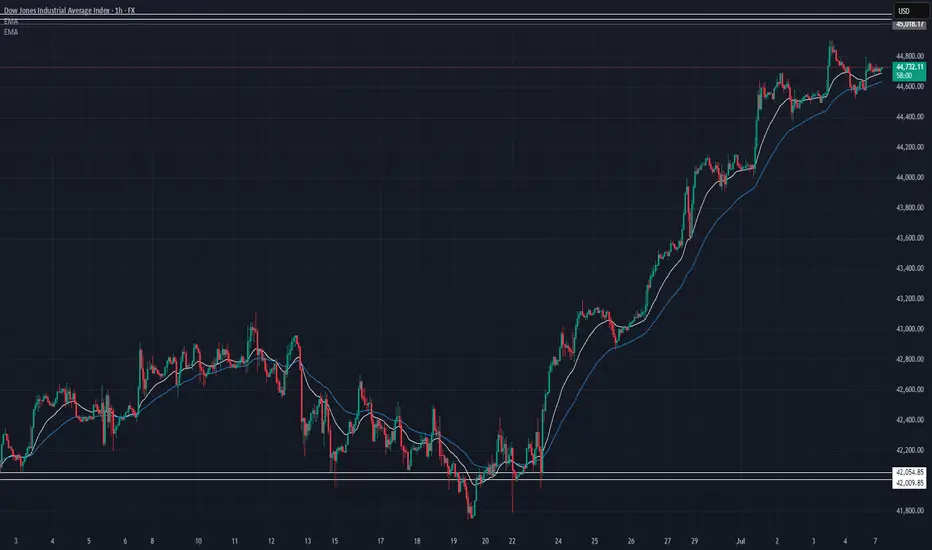
US30 Technical Outlook – 07/07/2025📍 US30 Technical Outlook – 07/07/2025
The bulls are holding it down 💪
We’re pushing back near the top of the range — New high at 45,018 tapped!
Price is comfortably riding above both EMAs (20 & 50), showing strong trend continuation 🚀
🧠 Key Observations:
Clear breakout from previous consolidation (44,700 zone)
New higher high → momentum remains intact
EMAs continue to act as dynamic support (especially 44,688 area)
📊 Key Price Zones:
🔼 Resistance: 45,018 → Next psychological level: 45,200
🔽 Support: 44,688 → 44,500 → 44,250
📈 Trade Setup Ideas:
🔹 Long Setup (Primary Play):
Pullback entries near 44,688 EMA zone
Confirmation: Bullish engulfing or bounce on 15min/1H
Targets: 45,000 → 45,200
SL: Below 44,500
🔻 Short Setup (Cautious/Counter):
Only if strong rejection from 45,018 with breakdown back below 44,700
Target: 44,500 → 44,250
Lower TF confirmation required
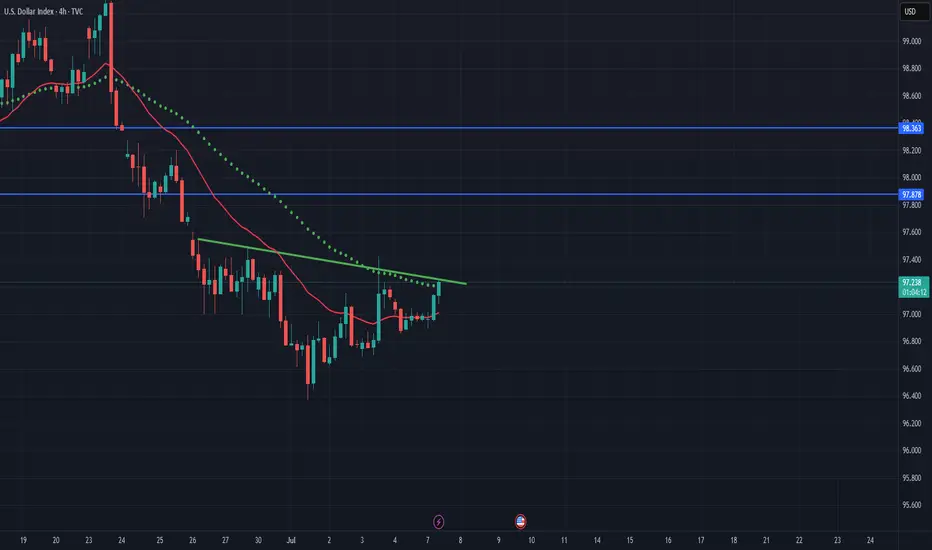
DXY // Inverted head and shoulders formationIf we can see closings above the green line, the first target exit is 97.878, which corresponds to Fibo 1.414, and the main target is 98.363.
NAS100 - Stock market is waiting for tariffs!The index is above the EMA200 and EMA50 on the four-hour timeframe and is trading in its ascending channel. Maintaining the ascending channel will lead to the continuation of the Nasdaq's upward path to higher targets, but if it does not rise and corrects towards the demand limits, you can buy the Nasdaq index with appropriate reward and risk.
Three months ago, Donald Trump postponed the imposition of severe retaliatory tariffs, granting America’s major trading partners more time to reach new agreements that Washington views as “fairer.” Now, as the White House’s July 9 deadline approaches, only two official trade deals have been finalized—one with the United Kingdom and another with Vietnam. As for China, merely a fragile temporary truce has been reached, which has so far prevented any additional tariffs from being enforced.
Although reports suggest promising progress in negotiations with India, Japan, and South Korea, no final agreements have been secured with these countries yet. Interestingly, talks with the European Union—which had previously stalled—have suddenly taken a positive turn, and prospects for a deal with Canada in the coming days have also improved.
However, given the limited time left, it seems unlikely that trade agreements with all of America’s 18 key partners will be reached before the deadline. This situation has raised a critical question for the markets: Will Trump set a new deadline for the remaining countries, or will the suspended tariffs be reinstated?
The prevailing view is that the U.S. president will once again resort to threats before granting any extensions—this time not merely by reviving the “Liberation Day” tariffs, but also by promising even heavier tariffs to extract the last concessions from the remaining trade partners.
U.S. Treasury Secretary Scott Bassett stated that if no agreements are reached by August 1, tariffs will revert to the levels announced in April. He also emphasized that Washington’s core strategy in these trade talks is to apply maximum pressure. According to Bassett, letters will be sent to various countries, outlining the August 1 deadline for reaching deals. This news, which broke during the market’s closing hours, sparked a wave of risk appetite in the financial markets.
In a week when the U.S. economic calendar is notably devoid of major data releases, investors are focusing their attention on the minutes from the Federal Reserve’s June FOMC meeting—a document that could offer fresh insights into the trajectory of interest rates for the second half of the year.
June’s strong employment report, which exceeded market expectations, has effectively dashed hopes for an interest rate cut this month. Now, if the positive economic momentum persists, the likelihood of a rate cut in the September meeting may also gradually be priced out by the markets.
According to data from Challenger, Gray & Christmas, U.S. employers announced 47,999 job cuts in June, marking a sharp decline from 93,816 in the previous month. Compared to June of last year, layoffs have dropped by 2%. However, total job cuts in the second quarter of 2025 reached 247,256—a 39% increase from the same period last year (177,391) and the highest second-quarter layoff figure since 2020.
With no significant economic reports scheduled for the coming days, investors will be closely analyzing Wednesday night’s Fed minutes and the limited remarks from central bank officials—statements where every word has the potential to significantly move the markets.