US30 short bias- 9th July 2025
I have conducted a comprehensive multi-timeframe analysis of the US30 index, with particular focus on its recent price action and structural context.
Quarterly Timeframe:
On the three-month timeframe, the second quarter’s candle close is notably bullish, having engulfed the previous ten quarterly candles. This significant engulfing pattern suggests strong underlying momentum. Importantly, there has not yet been a body closure above this quarterly candle, which indicates that price may attempt to break above its range to establish new all-time highs.
Recently, price action reached an all-time high near a major psychological level of 45,000 before retracing sharply to a liquidity region around 37,500. Since this retracement, there has been substantial accumulation of bullish orders, reinforcing the potential for price to retest and surpass prior highs.
Monthly Timeframe:
On the monthly timeframe, price has approached a key liquidity region around 44,500, where it is currently encountering resistance. While the higher timeframe bias remains firmly bullish, it is reasonable to expect healthy retracements before new all-time highs are made. It is worth noting that price has already broken above significant monthly levels at 41,750 and 42,600.
A retracement to these regions to collect further liquidity remains plausible, although this scenario is speculative rather than confirmed at present. Consequently, my bias on the monthly timeframe remains neutral in the short term, pending further developments.
Weekly Timeframe:
Price action on the weekly timeframe mirrors that of the monthly. There is little of note beyond the observation that price absorbed considerable bullish orders at 41,750 and has since encountered resistance near 44,750, leading to a modest retracement. Given this structure, I maintain a neutral outlook on the weekly timeframe.
Daily Timeframe:
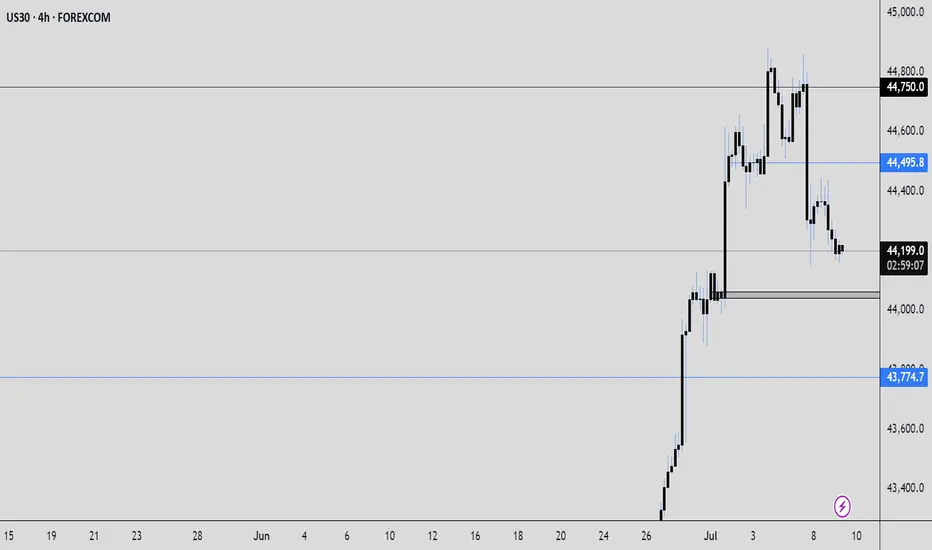
On the daily chart, we can observe that the bullish momentum initiated from the 43,000 order block region faced resistance at approximately 44,500. Price briefly broke above this region on Thursday, 3rd July, but quickly closed below it on Monday, indicating a lack of sustained buying interest to propel price higher.
This retracement suggests that the market is searching for a deeper liquidity area to support its next upward move. Notably, a bearish three-pin formation is present, implying that price may break below the recent lows around 44,150. Accordingly, my bias for today is bearish.
4-Hour Timeframe:
In alignment with the daily bias, the 4-hour timeframe indicates that price is likely to target Monday’s low at approximately 44,155. The next key liquidity region lies around 44,000, where substantial bullish orders were previously filled. I am currently waiting for price to offer a suitable entry region to sell towards 44,000.
I am also mindful that the FOMC minutes are scheduled for release today, which could introduce significant volatility. Should a valid setup emerge, I will look to enter a short position. Specifically, if the current 4-hour candle closes bearish, I intend to consider shorts from around 44,220.
---
Disclaimer:
This analysis is for educational purposes only and does not constitute financial advice. Always conduct your own research and manage risk accordingly.
Market indices
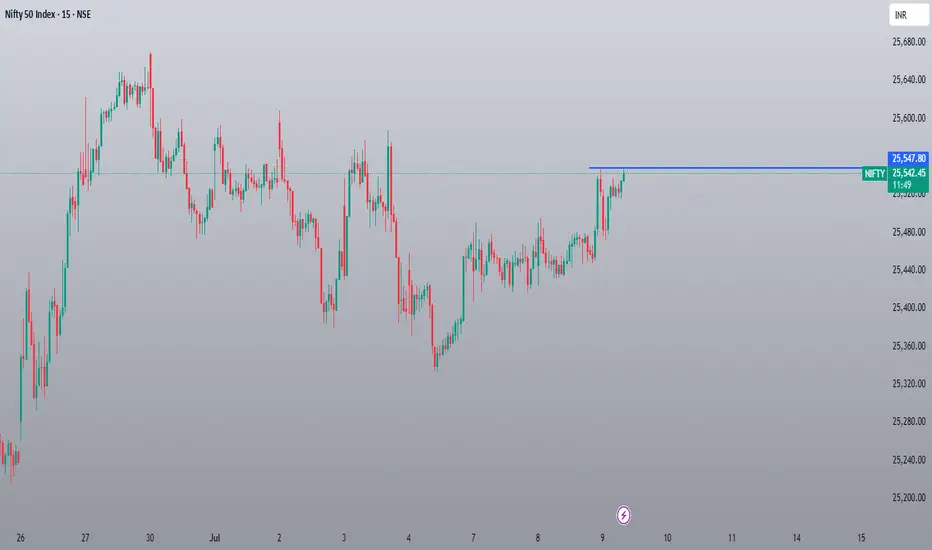
Nifty 50 Maybe Face RejectionCurrently, Nifty 50 appears to be experiencing rejection on its chart. An upside movement should be anticipated only if Nifty 50 remains above this observed level. Conversely, it would be advisable to avoid purchasing options premiums, as they are likely to depreciate if the market consolidates within its current range.
Today's Closing is Important.KSE100 (09-07-2025 10:20am)
Today's Closing is Important.
Either it has to Cross its Resistance. Otherwise , it may Test S1 atleast.
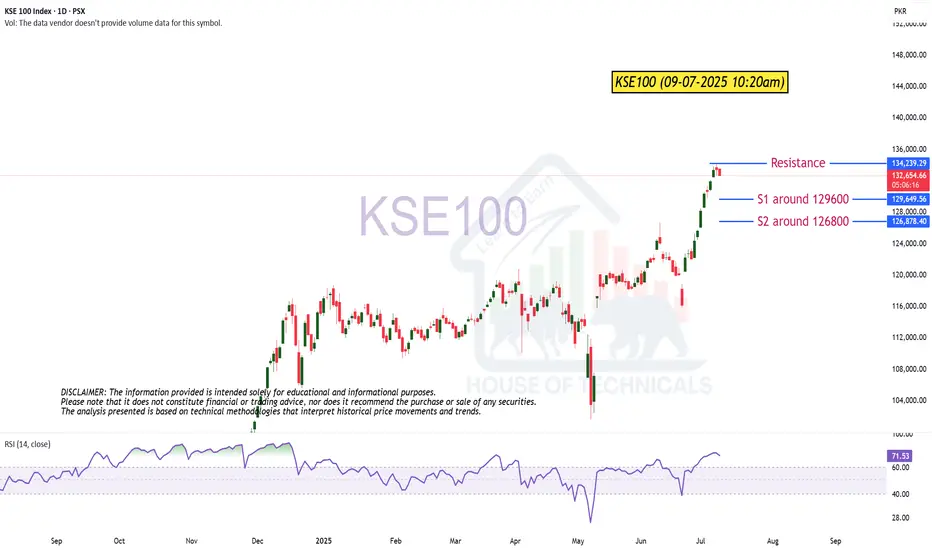
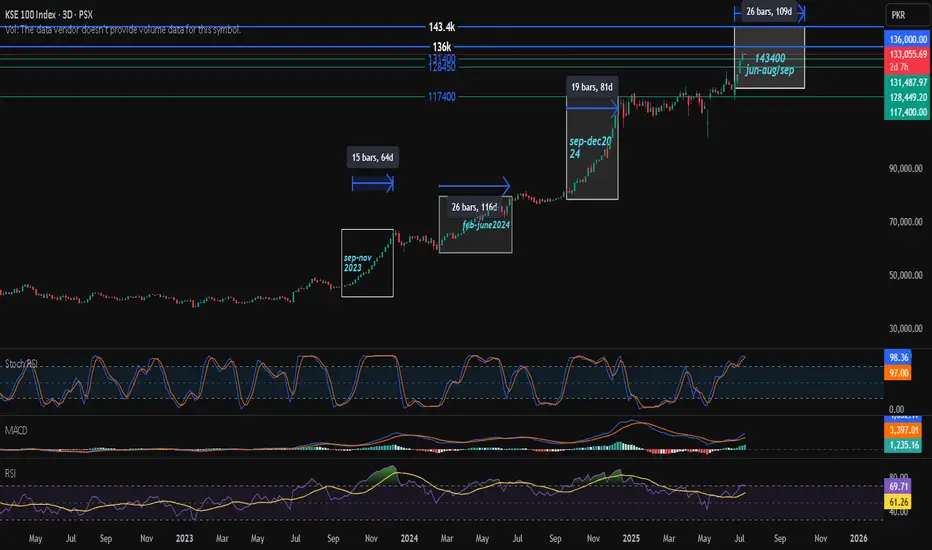
kse 100 indexKSE 100 index has started fresh rally this week. It is expected to break136k sooner after being range bound or taking some correction it will move toward 143k after the news of rate cut. if rate cut not announced then this momentum could slow down or index can take heavy correction but it will ultimately rise till 143k. all the other indicators support this move.
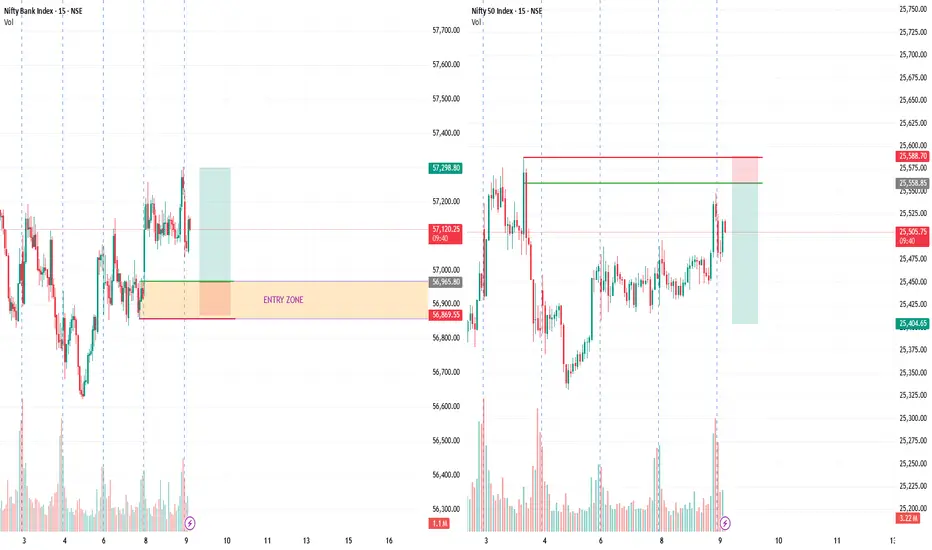
NIFTY AND BANK NIFTY OVERVIEWBoth the NIFTY 50 and BANK NIFTY indices are currently displaying major Order Block formations on the 15-minute timeframe. These institutional-level support and resistance zones indicate potential areas where significant buying or selling pressure may emerge.
BuyHigher Time Frame Reject Level
Bullish Previous Week
Market Structure Shift Bullish
Asian Session
Trade
Manage
Smile

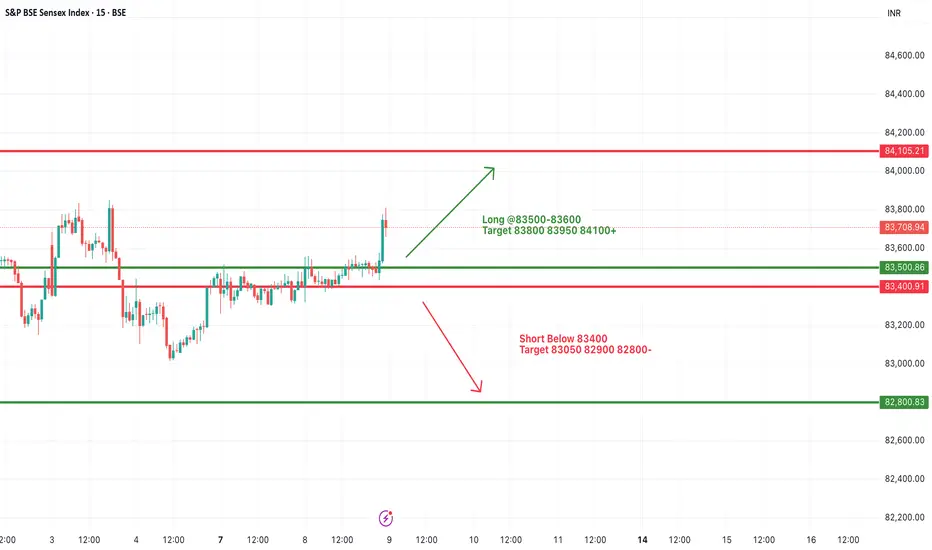
#SENSEX Intraday Support and Resistance Levels - 09/07/2025Sensex is expected to open slightly gap up near the 83500–83600 range, showing positive momentum as it breaks out from its recent consolidation zone. A sustained move above this level could trigger further upside, with immediate targets seen at 83800, 83950, and 84100+ levels. This zone will act as a crucial resistance-turned-support for the session.
However, if the index fails to hold above 83500 and slips below 83400, it may enter a corrective phase. A breakdown below 83400 could lead to a downward move toward 83050, 82900, and possibly 82800-. Overall, trend remains positive above 83600, and traders should watch for confirmation in the opening session.
#NIFTY Intraday Support and Resistance Levels - 09/07/2025Nifty is expected to open slightly gap up around the 25500–25520 zone, showing positive momentum from the previous day’s breakout above its recent consolidation range. If the index sustains above the 25550 level, we can expect bullish continuation toward the upside targets of 25600, 25650, and 25750+ levels. This zone may act as an intraday breakout trigger.
On the downside, 25450 will now act as immediate support. Any sharp move below 25450 could invite selling pressure, and we may see a downside slide toward 25350, 25300, and 25250-. The trend remains mildly bullish above 25550, while below 25450 the trend may turn weak intraday.

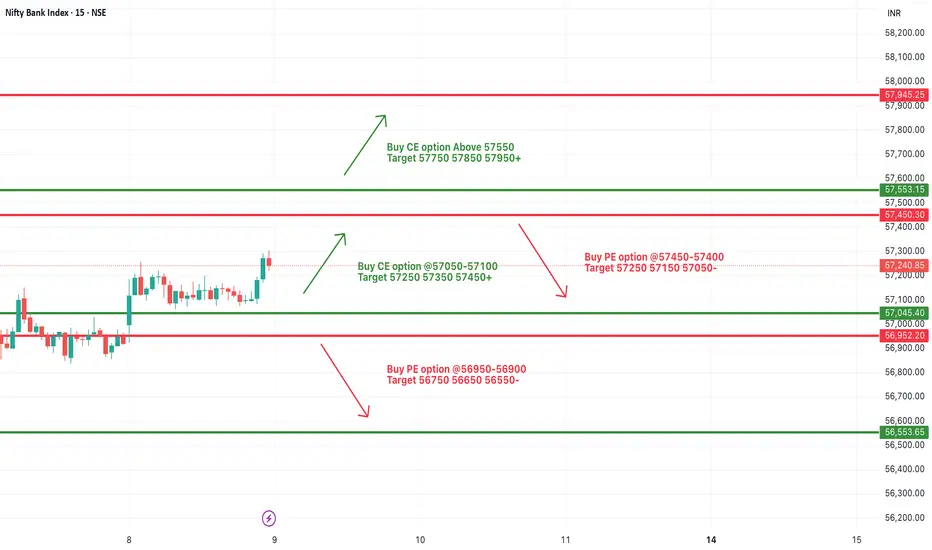
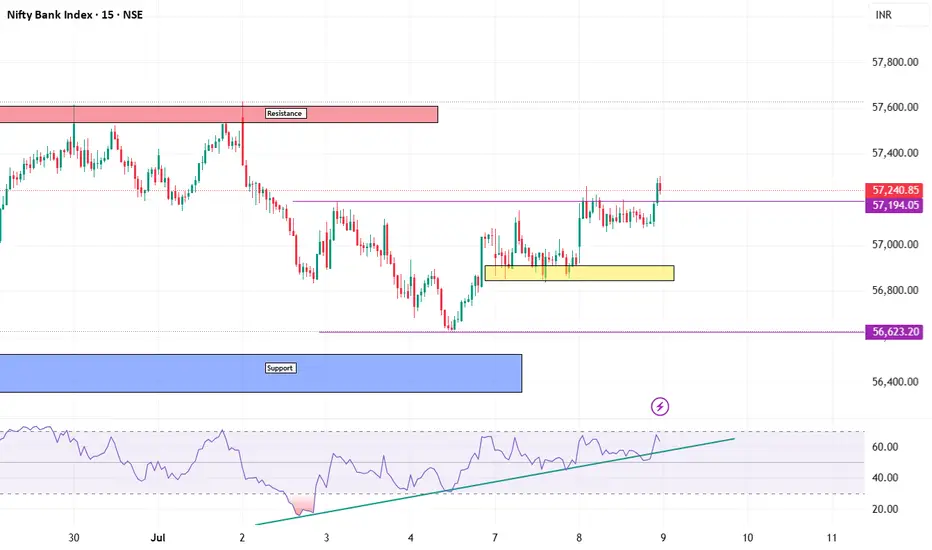
[INTRADAY] #BANKNIFTY PE & CE Levels(09/07/2025)Bank Nifty is expected to open slightly gap up today near the 57200-57250 zone, indicating mild bullish sentiment carrying over from the previous session. The index has broken out of the tight consolidation range and now approaches a key resistance near the 57400-57450 area.
A sustained move above 57550 could lead to a fresh upward rally toward 57750, 57850, and 57950+, supported by recent bullish momentum. However, if the index fails to sustain above 57400-57450, it may see a pullback, where traders should watch for possible selling pressure targeting 57250, 57150, and even 57050-.
If Bank Nifty drops below the 57100 level and especially under the 56950-56900 zone, it may turn bearish with potential downside targets at 56750, 56650, and 56550-. Overall, price action around the 57450 level will be key in defining intraday trend direction.
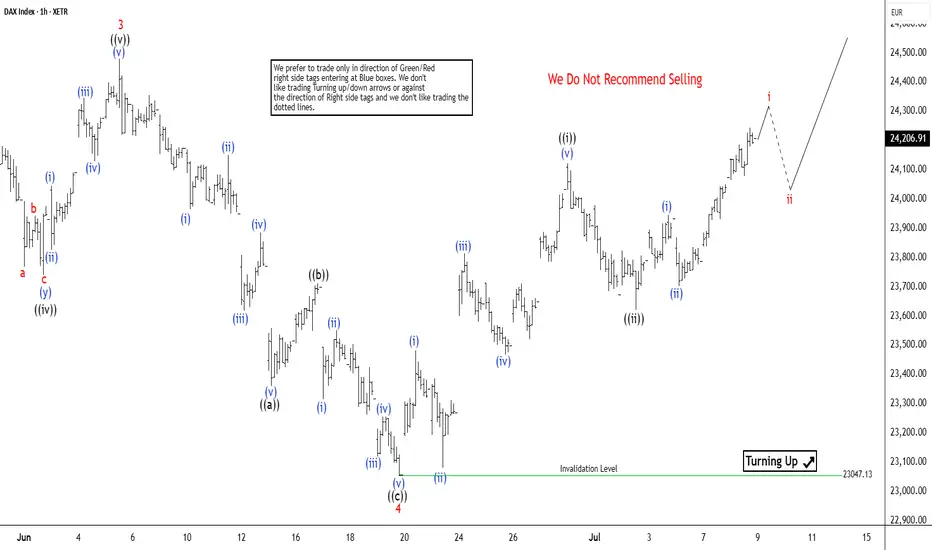
Elliott Wave Outlook: DAX Set to Rally Higher in Wave 5Since April 7, 2025, the DAX Index has been advancing in a clear impulsive cycle, originating from a low that has set the stage for a structured upward movement. The initial advance, wave 1, concluded at 20468.43. It was followed by a corrective pullback in wave 2, which found support at 19384.39. The subsequent rally in wave 3 was robust, peaking at 24479.42, as depicted on the 1-hour chart. Wave 4 unfolded as a zigzag Elliott Wave pattern, characterized by a decline in wave ((a)) to 23360.16. A recovery in wave ((b)) took place to 23711.73, and a final dip in wave ((c)) to 23047.13, completing the corrective wave 4.
The Index then resumed its upward trajectory in wave 5, structured as an impulse in a lesser degree. From the wave 4 low, wave (i) reached 23481.97. A minor pullback in wave (ii) followed which ended at 23080.29. The rally then continued with wave (iii) peaking at 23812.79, a slight correction in wave (iv) to 23466.73, and the final leg, wave (v), concluding at 241200.82, marking the completion of wave ((i)).
A corrective wave ((ii)) found support at 23620.42, and the Index has since turned higher in wave ((iii)). As long as the pivot low at 23407.13 holds, the DAX is expected to extend its gains, with pullbacks likely finding support in a 3, 7, or 11 swing structure. This analysis suggests continued bullish momentum in the near term, with key support levels providing opportunities for further upside.
DXY (LONG)
Elephant in room: To all the fake Business Development Managers in SA; claiming to have database/business they dont have, then jumping broker to broker every 3months to just get money knowing very well you cannot meet the requirement to claim you can
have caused the following
1) International brokers to not hire South Africans anymore
2) Some good brokers to leave the country therefore jobs opportunities to be lost.
We complain about lack of employment and opportunities while we are greatly the cause
Be Better have integrity, professionalism and be hournest, your selfish acts have a greater negative impact than you can imagine.
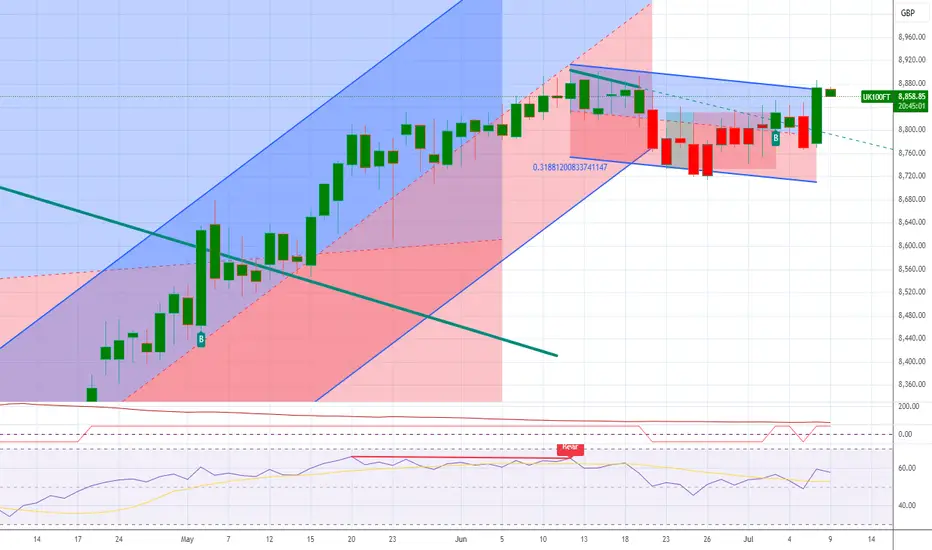
FSTE100 LongFSTE100 is now net long on the regression break.
There is a trade here with a stop at the swing low of the previous regression.
I am not sure if I will take this trade.
NASDAQ 100 – Is Upside Momentum Still Evident?Tough talk on tariffs at the back end of last week and over the weekend from President Trump ahead of his 90 day pause deadline, which is due to end tomorrow (July 9th), helped to put a small dent in trader sentiment, slightly undermining the recent strong upside momentum seen in the US 100 index.
This led to a sell off from fresh all time highs of 22908 registered on July 3rd to a low of 22600 yesterday evening, as the letters sent by the US administration outlining import tariffs of 25% sent to Japan, South Korea and another 12 nations were unveiled.
However, the moves have been relatively muted since then as traders remain optimistic that there is still time for negotiation to agree trade deals given that the new tariffs won’t go into effect until August 1st, providing a potential further 3 weeks to move things along.
Looking forward, in a relatively quiet week for data and central bank speakers, the next moves in the US 100 index towards the Friday close may be dictated by updates on trade deals between the US and EU, and the US and India, both of which have been reported as moving closer to agreement. Technical trends could also be an important factor.
Technical Update: Is Upside Momentum Still Evident?
Future tariff news has the potential to continue to be a very important sentiment driver for global equities, particularly within the tech sector, which the US 100 index reflects within its constituents.
As a result, it can be useful to assess potential support and resistance levels within the US 100 index that traders may be focusing on to gauge the next possible direction for prices.
Possible Resistance Levels:
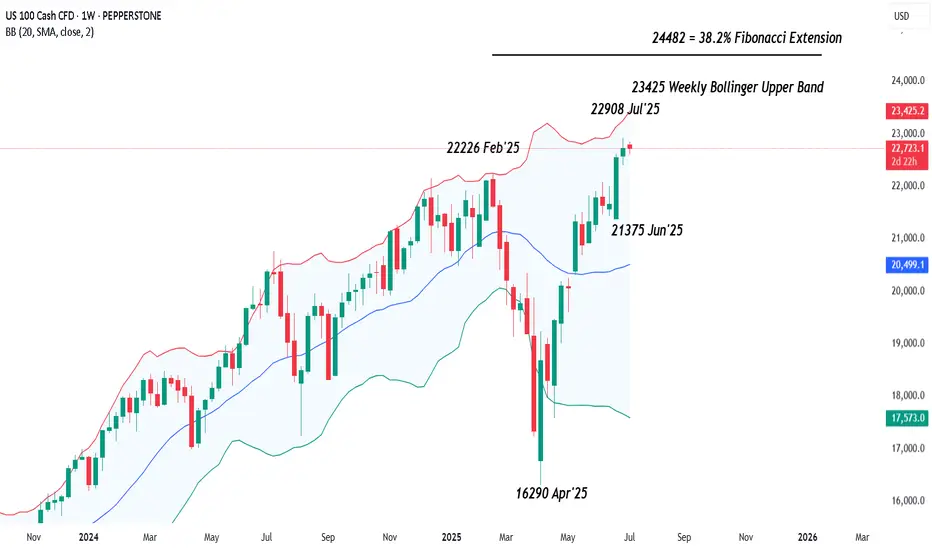
Since posting the April 2025 low at 16290, the US 100 index has rallied by over 40% in only a 13-week period. While this has reflected positive sentiment during this time, traders may well now be questioning if this upside momentum can continue, or if it might stall, even leading to price weakness.
As such, being aware of potential resistance levels against which to judge current price strength that might be able to hold and possibly reverse this latest activity back to the downside, may prove important.
Having previously been strong enough to hold recent price strength, the 22908 July 3rd all-time high, may now represent an area where sellers can be found again, and as such, this marks a potential first resistance focus.
However, closing breaks above 22908 might suggest a more extended phase of price strength, with traders then possibly looking to 23429, the upper weekly Bollinger band and on breaks above this, even towards 24482, which is equal to the 38.2% Fibonacci extension of the February to April 2025 price decline, as the next resistance levels.
Possible Support Levels:
Of course, just because a 40% advance in prices has been seen, doesn’t guarantee it will continue and traders may be trying to focus on support levels that if broken on a closing basis over the coming days, might suggest risks of a more extended decline in price.
Looking at the daily chart above, it might be suggested that the first support is currently represented by 22201, the level of the rising Bollinger mid-average. Closing breaks below 22201 could in turn lead to further price declines to test 22053, the 38.2% Fibonacci retracement of May 23rd to July 3rd price strength, even 21787, the deeper 50% retracement.
The material provided here has not been prepared accordance with legal requirements designed to promote the independence of investment research and as such is considered to be a marketing communication. Whilst it is not subject to any prohibition on dealing ahead of the dissemination of investment research, we will not seek to take any advantage before providing it to our clients.
Pepperstone doesn’t represent that the material provided here is accurate, current or complete, and therefore shouldn’t be relied upon as such. The information, whether from a third party or not, isn’t to be considered as a recommendation; or an offer to buy or sell; or the solicitation of an offer to buy or sell any security, financial product or instrument; or to participate in any particular trading strategy. It does not take into account readers’ financial situation or investment objectives. We advise any readers of this content to seek their own advice. Without the approval of Pepperstone, reproduction or redistribution of this information isn’t permitted.
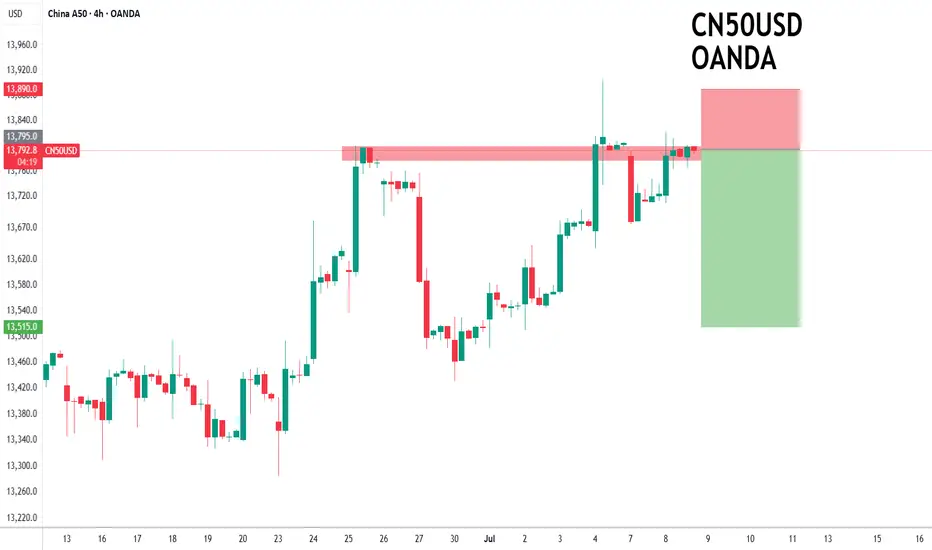
China50 to find sellers at current market price?CHN50 - 24h expiry
Selling posted close to the previous high of 13800.
13868 has been pivotal.
Bespoke resistance is located at 13800.
Early optimism is likely to lead to gains although extended attempts higher are expected to fail.
We look for a temporary move higher.
We look to Sell at 13795 (stop at 13890)
Our profit targets will be 13515 and 13435
Resistance: 13821 / 13905 / 14000
Support: 13764 / 13676 / 13638
Risk Disclaimer
The trade ideas beyond this page are for informational purposes only and do not constitute investment advice or a solicitation to trade. This information is provided by Signal Centre, a third-party unaffiliated with OANDA, and is intended for general circulation only. OANDA does not guarantee the accuracy of this information and assumes no responsibilities for the information provided by the third party. The information does not take into account the specific investment objectives, financial situation, or particular needs of any particular person. You should take into account your specific investment objectives, financial situation, and particular needs before making a commitment to trade, including seeking advice from an independent financial adviser regarding the suitability of the investment, under a separate engagement, as you deem fit.
You accept that you assume all risks in independently viewing the contents and selecting a chosen strategy.
Where the research is distributed in Singapore to a person who is not an Accredited Investor, Expert Investor or an Institutional Investor, Oanda Asia Pacific Pte Ltd (“OAP“) accepts legal responsibility for the contents of the report to such persons only to the extent required by law. Singapore customers should contact OAP at 6579 8289 for matters arising from, or in connection with, the information/research distributed.
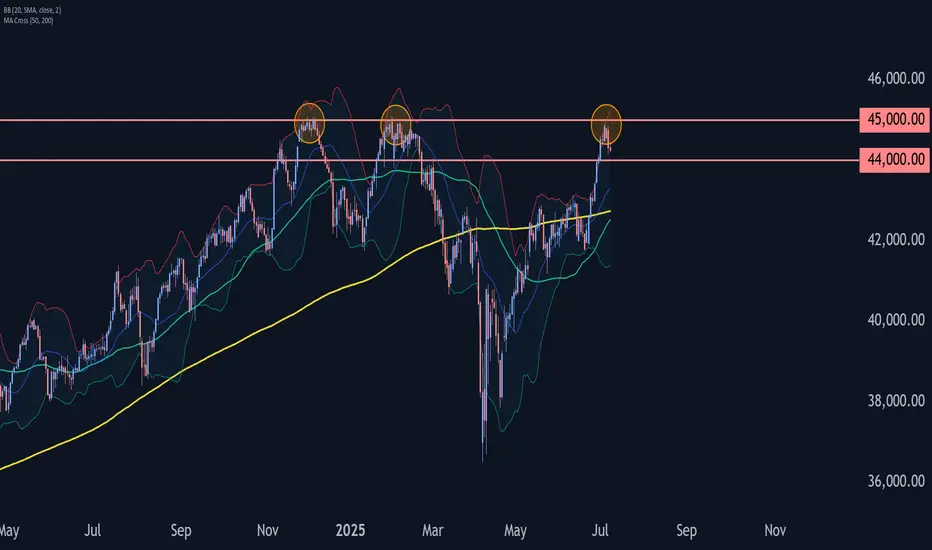
Dow Jones Wave Analysis – 8 July 2025- Dow Jones reversed from long-term resistance level 45000.00
- Likely to fall to support level 44000.00
Dow Jones index recently reversed down from the resistance zone located between the long-term resistance level 45000.00 (which has been steadily reversing the price from the end of November) and the upper daily Bollinger Band.
The downward reversal from this resistance zone stopped the previous medium-term ABC correction (2) from the start of April.
Given the strength of the resistance level 45000.00 and the overbought daily Stochastic, Dow Jones index can be expected to fall to the next support level 44000.00 (target price for the completion of the active impulse wave i).
SPX - Are you catching the rotation trends? SPX is still holding very bullish price action. Technicals are pointing towards higher price and todays inside consolidation day certainly helps digest recent gains.
Along with the flat indices market session, we did observe some massive capital rotation trends.
Financials saw a pretty strong down move across the board. JPM / BAC / C all saw large outflows. We were positioned on the short side of financials and took profits on JPM puts.
Even with the big selloff in financials, SPX held up surprisingly well.
Capital simply rotated instead of outright leaving the market. Bullish Signal.
Technology, Energy, Materials, Health care, Transports all saw capital inflow trends.
Rotation into under preforming sectors is a sign that markets could be staging another healthy leg up.
We still have an upside target over 6300 on SPX.

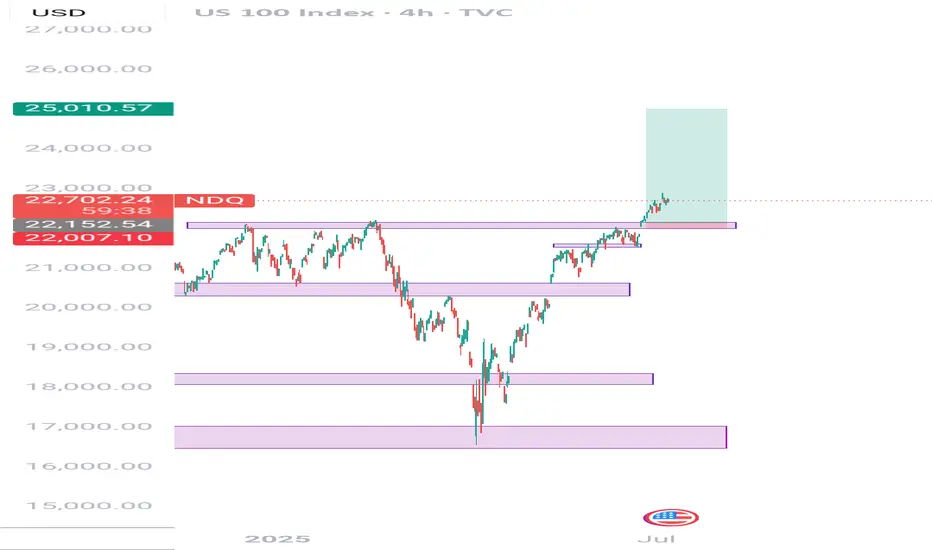
Long position idea on Nasdaq Simple and precise idea of Nasdaq. Bullish momentum in full swing. Nasdaq recently broke out of the previous High/Resistance and shows that the bulls are still in power. Take profit is at 25.000.00 because Nasdaq usually moves around 10.000 pips after a market crash so when doing my calculations from previous Low of 16300, my estimation is around 25000 which equals to 9,000 - 10,000 pips.
Banknifty chart analysis for tommorrowdosto
banknifty ka chart apko share kar raha hu jo apko kal ke liye help karega trading main.
aaj banknifty aur nifty dono ne hee ek breakout diaya.
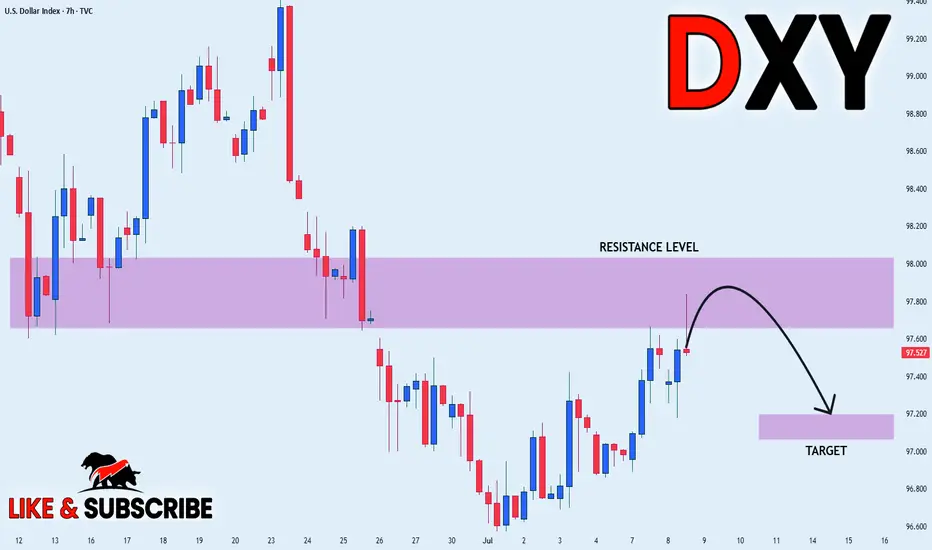
DXY LOCAL SHORT|
✅DXY is about to retest a key structure level of 98.000
Which implies a high likelihood of a move down
As some market participants will be taking profit from long positions
While others will find this price level to be good for selling
So as usual we will have a chance to ride the wave of a bearish correction
SHORT🔥
✅Like and subscribe to never miss a new idea!✅
Disclosure: I am part of Trade Nation's Influencer program and receive a monthly fee for using their TradingView charts in my analysis.
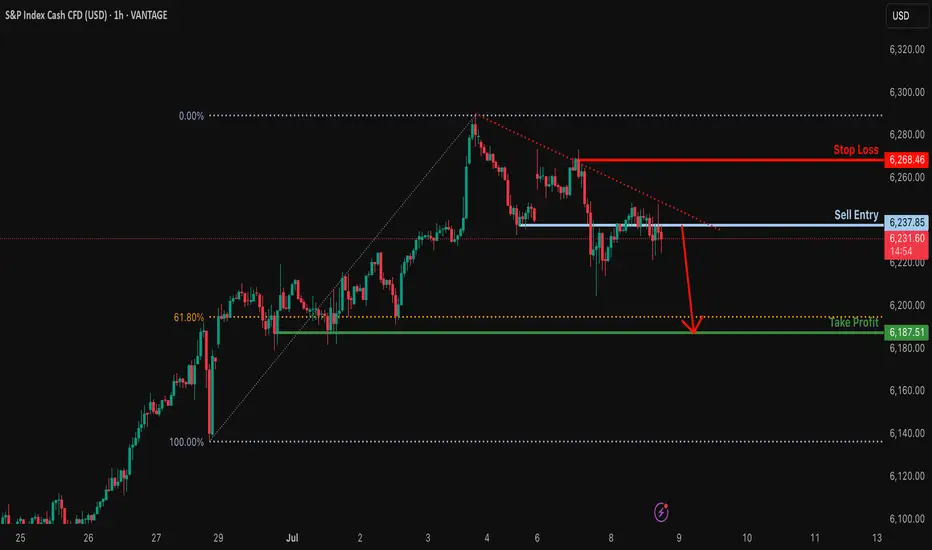
Bearish drop?S&P500 is reacting off the resistance level which is a pullback resistance and could drop from this level too ur take profit.
Entry: 6,237.85
Why we like it:
There is a pullback resistance level.
Stop loss: 6,268.46
Why we like it:
There is a pullback resistance level.
Take profit: 6,187.51
Why we like it:
There is a pullback support that is slightly below the 61.8% Fibonacci retracement.
Enjoying your TradingView experience? Review us!
Please be advised that the information presented on TradingView is provided to Vantage (‘Vantage Global Limited’, ‘we’) by a third-party provider (‘Everest Fortune Group’). Please be reminded that you are solely responsible for the trading decisions on your account. There is a very high degree of risk involved in trading. Any information and/or content is intended entirely for research, educational and informational purposes only and does not constitute investment or consultation advice or investment strategy. The information is not tailored to the investment needs of any specific person and therefore does not involve a consideration of any of the investment objectives, financial situation or needs of any viewer that may receive it. Kindly also note that past performance is not a reliable indicator of future results. Actual results may differ materially from those anticipated in forward-looking or past performance statements. We assume no liability as to the accuracy or completeness of any of the information and/or content provided herein and the Company cannot be held responsible for any omission, mistake nor for any loss or damage including without limitation to any loss of profit which may arise from reliance on any information supplied by Everest Fortune Group.
Institutional Adoption of Cryptocurrencies and Regulatory ReformIn 2025, the cryptocurrency market entered a new phase of maturity, driven by the active participation of institutional players and global regulatory reforms. Just a few years ago, cryptocurrencies were associated with decentralized anarchism, but today they are being integrated by major banks, investment funds, and even governments.
The U.S. and the Digital Dollar
A pivotal moment came when the U.S. passed a law establishing the legal status of stablecoins, especially those backed by fiat currency and regulated at the federal level. Some of these are now regarded as digital versions of the U.S. dollar and have received support from the Federal Reserve. This enabled banks to use such tokens for settlements, cross-border transfers, and liquidity storage.
With the growing legitimacy of cryptocurrencies like Ethereum and Bitcoin, large-scale investments from institutional players became feasible. Funds such as BlackRock and Fidelity not only launched their own Bitcoin-based ETFs but also began offering tokenized bonds and other hybrid financial instruments built on blockchain.
Europe and MiCA 2.0
The European Union is not lagging behind. In 2025, the updated MiCA 2.0 (Markets in Crypto-Assets) regulation came into force, expanding the scope of oversight to include DeFi, NFTs, and AI smart contracts. Exchanges and wallets are now required to comply with strict KYC/AML standards and provide proof of reserves. This significantly reduced fraudulent activity and increased trust in the industry.
The digital euro, though limited in circulation, has become part of the EU's economic ecosystem. It is actively used for distributing social benefits, paying for government services, and piloting smart city projects.
Consequences and Outlook
New regulatory frameworks have spurred the emergence of unique hybrid solutions — for example, the tokenization of real estate and government bonds. Institutional investors are eager to acquire such assets, valuing their transparency, liquidity, and diversification potential.
This has also changed the behavior of retail investors: trust has increased, more educational platforms have appeared, and safer investment tools have become available.
Looking ahead, we can expect even deeper integration of cryptocurrencies with traditional finance. In the next two years, the launch of international CBDC platforms, new cryptobanks, and decentralized exchanges with institutional support is anticipated.

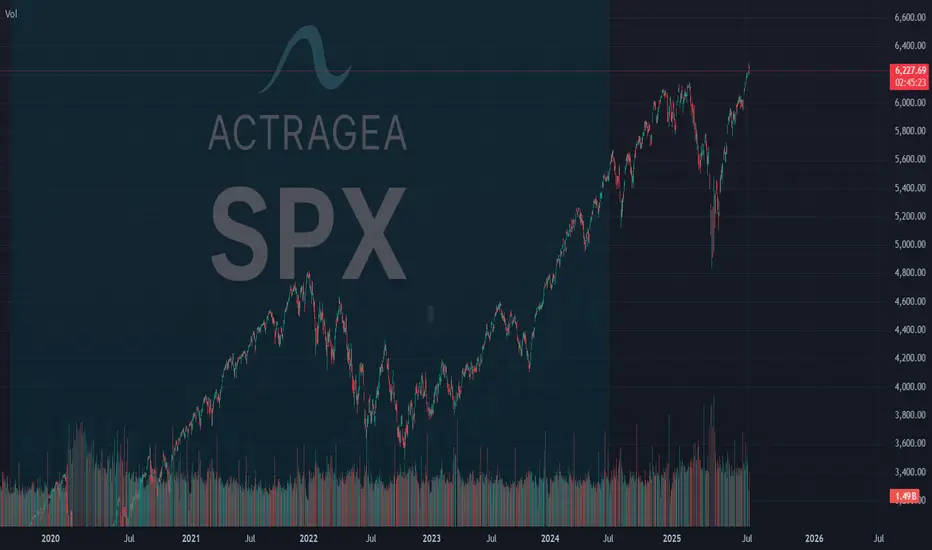
SPX: 75% chance Multi-Timeframe Reversal to 5,775-6,103 Zone **SPX MULTI-TIMEFRAME CYCLE CONFLUENCE ANALYSIS - SUPER VERSION**
**CURRENT SITUATION: July 7, 2025 - Price: 6,238**
Based on our quantitative cycle analysis across 4 timeframes, applying **ACTRAGEA hierarchical dominance principles** where ITM >> MTY >> TCY >> TYL.
---
## **CYCLE HIERARCHY STATUS**
| **Timeframe** | **Cycle Phase** | **Status** | **Hierarchy** | **Key Level** |
|---------------|-----------------|------------|---------------|---------------|
| **ITM (1D)** | Phase 2 | FLAT | **DOMINANT** | Max: 6,284.65 **awaiting confirmation** |
| **TCY (1H)** | Phase 2 | FLAT | Secondary | Max: 6,284.65 **awaiting confirmation** |
| **MTY (270m)** | Phase 1 | LONG (+1.64%) | Subordinate | Seeking max: 6,359 |
| **TYL (15m)** | Phase 2 | LONG (+0.11%) | Subordinate | Max: 6,242.7 **awaiting confirmation** |
---
## **PRIMARY SCENARIO (Probability: 75%)**
**DIRECTIONAL BIAS:** **Multi-timeframe reversal upon ITM maximum confirmation**
**RATIONALE:**
- **ITM timing**: 0 bars remaining from 50° percentile window → Maximum at 6,284.65 **awaiting confirmation** → Statistical pressure for confirmation increases daily
- **Hierarchical cascade**: **When ITM confirms maximum** → all subordinate cycles transition into Phase 3 (minimum search)
- **Current LONG positions** (MTY +1.64%, TYL +0.11%) face hierarchical override risk upon ITM maximum confirmation. Subordinate cycles will align regardless of current profitability.
**STATISTICAL PRICE LEVELS (50° Percentile):**
- **ITM**: 5,775.84
- **TCY**: 6,103.58
- **MTY**: 5,996.35
- **TYL**: 6,170.98
**STATISTICAL TIME WINDOWS (50° Percentile):**
- **ITM**: 65 bars | **TCY**: 58 bars | **MTY**: 62 bars | **TYL**: 81 bars
**EXTREME SCENARIOS (20° Percentile):**
- **ITM**: 5,420.71 | **TCY**: 5,934.73 | **MTY**: 5,728.16 | **TYL**: 6,084.71
---
## **⚠️ ALTERNATIVE SCENARIO (Probability: 25%)**
**DIRECTIONAL BIAS:** ITM extension toward 80° percentile before maximum confirmation
**CONDITION:** ITM exceeds statistical time boundaries, allowing subordinate cycles temporary independence
---
## **CRITICAL DECISION POINT**
**Confirmation Trigger:** ITM maximum validation at 6,284.65 → Phase 2→3 transition → Activation timeframe: Within 1-3 trading sessions (statistical pressure)
**Hierarchy Activation:** Immediate subordinate cycle alignment into Phase 3 upon ITM confirmation
**Invalidation:** Sustained break above 6,285 (negates ITM maximum thesis)
---
## ** PROBABILITY FOUNDATION**
**75% probability derived from:**
- ITM expired timing creating high statistical pressure for confirmation
- Historical dominance patterns (85%+ subordination rate upon ITM phase changes)
- Dual Phase 2 alignment (ITM + TCY at identical maximum level awaiting confirmation)
---
## **ACTRAGEA METHODOLOGY FOUNDATION**
Our **quantitative cycle framework** operates on **hierarchical dominance principles** where longer timeframes command shorter ones. Statistical levels represent **50° percentile probabilities**, not certainties. The **ITM critical juncture** at 6,284.65 creates high-probability setup for **coordinated multi-timeframe reversal initiation**.
**Performance Context:** Systems demonstrating 65.71% to 82.86% statistical reliability across timeframes.
---
*Analysis based on ACTRAGEA hierarchical cycle principles and statistical percentile distributions. All levels represent probabilities, not guaranteed outcomes.*
Dollar Index Analysis – Trump, Hegemony & a Dangerous Disconnect🇺🇸💣 Dollar Index Analysis – Trump, Hegemony & a Dangerous Disconnect 📉⚠️
Hey Traders,
FXPROFESSOR here with a deep-dive update on the Dollar Index (DXY) – and this one hits both technicals and macro geopolitics.
🧠 Macro Context:
For decades, the U.S. strategically outsourced much of its basic manufacturing capacity to China—everything from screws, cables, plastics, and circuit boards. This freed America to focus on high-margin sectors like technology, finance, and defense innovation.
But this efficiency came at a cost: dependency. You can't be the military and economic hegemon of the world if you don’t manufacture your own basic components. That’s the foundation of hard power—and Trump understands this well.
🔁 Now Trump is trying to reverse that.
He knows America can’t win long-term without reclaiming production and export competitiveness – and a strong dollar kills that dream.
So what’s the play?
✅ Trump brings the volatility
✅ Fed stays cautious
✅ Dollar weakens... but without actual rate cuts
That’s the scary part 👇
📉 💵 Dollar Strength vs. Treasury Stress
This is also why the U.S. Treasury market is under stress. If the U.S. wants to rebuild domestic production, reduce trade deficits, and support massive fiscal spending, it needs to weaken the dollar and attract internal capital—not depend on foreign buyers of debt.
A strong dollar = trade imbalance, hollowed industry, and rising debt service costs.
A normalized dollar = controlled exports, internal manufacturing, and a potential realignment of global capital flows.
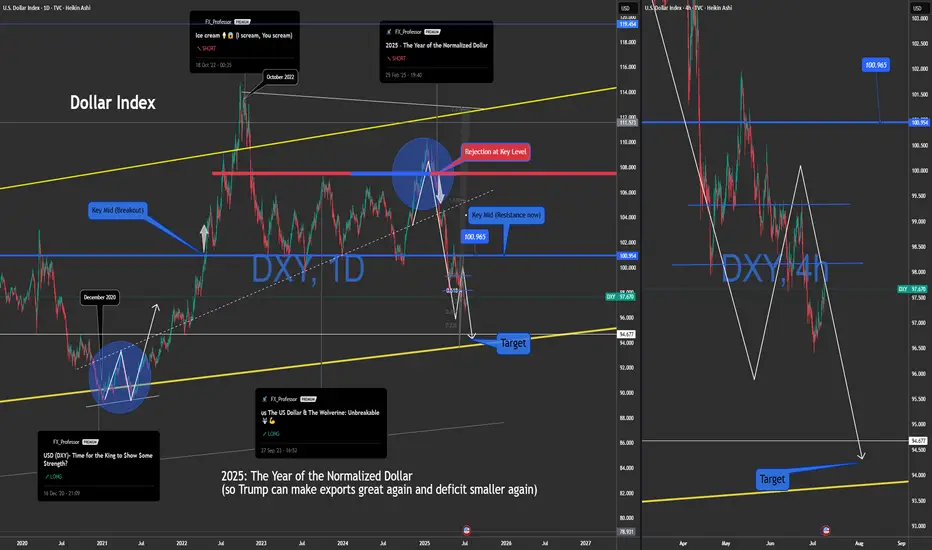
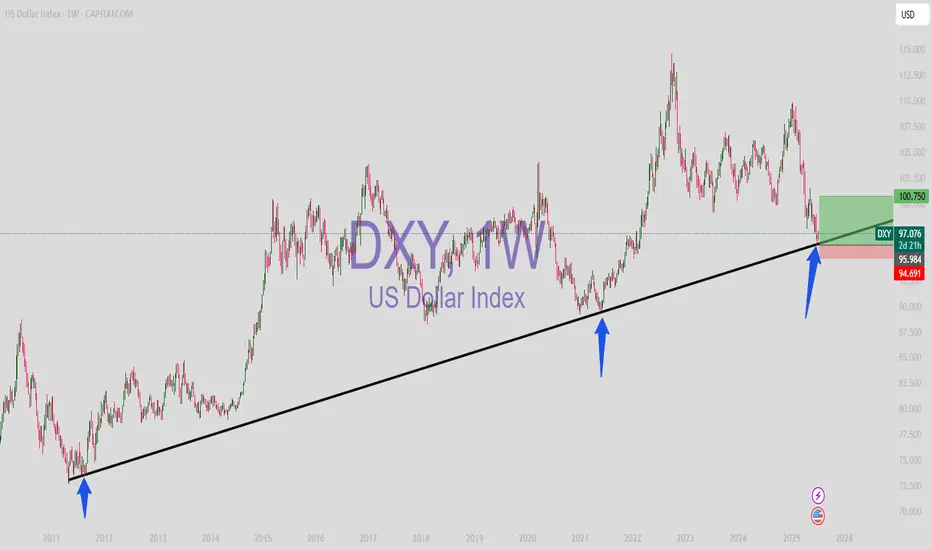
📉 The Chart: "The Year of the Normalized Dollar"
🟡 This is a continuation of the same chart I published over a year ago.
Key Rejection Zone: 100.965 (former support, now resistance)
Current Trajectory: Approaching my long-held target at 94.677
Macro Message: The dollar is dropping without a Fed pivot
Worrying Signal: If we hit major support while the Fed stays tight... the entire market may need to reprice expectations. That could shake equities and crypto alike.
🧊 This is not a clean-cut dollar short anymore . It’s already priced in, and that’s why I’m spooked.
🧭 What I’m Watching:
Will Trump’s trade war accelerate this move?
Will Powell finally cut in September—or double down?
Will the support at 94.5 hold, or break and open a much larger macro shift?
This chart is no longer just technical. It’s political. It’s strategic. It’s a chessboard for hegemony.
🎥 FULL 20-min video breakdown is now live!
I cover DXY, Bitcoin, tech stocks, gold, silver, DAX, BTC.D and much more
Watch it if you want the full map of what I’m thinking this week.
One Love,
The FXPROFESSOR 💙
Disclosure: I am happy to be part of the Trade Nation's Influencer program and receive a monthly fee for using their TradingView charts in my analysis. Awesome broker, where the trader really comes first! 🌟🤝📈