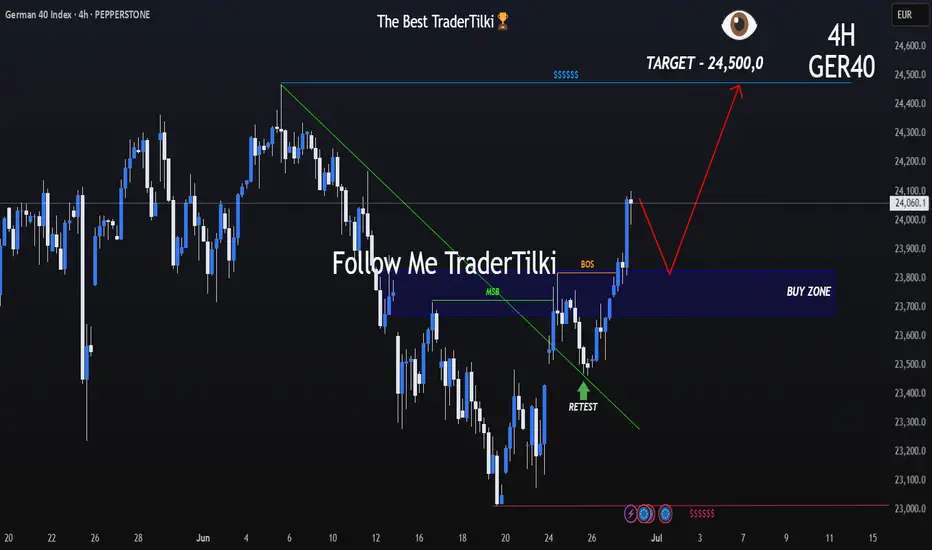
Is the Trend Intact? Key Signal Emerging on GER40 4H ChartHey Guys,
We could see a pullback on the GER40 index from the 24,060 level. If that happens, the 23,824 – 23,675 zone could present a potential buying opportunity. The primary trend still points upward, and bullish momentum remains intact.
Also worth noting—the rise in volume is quite striking, which supports my target level of 24,500.
I meticulously prepare these analyses for you, and I sincerely appreciate your support through likes. Every like from you is my biggest motivation to continue sharing my analyses.
I’m truly grateful for each of you—love to all my followers💙💙💙
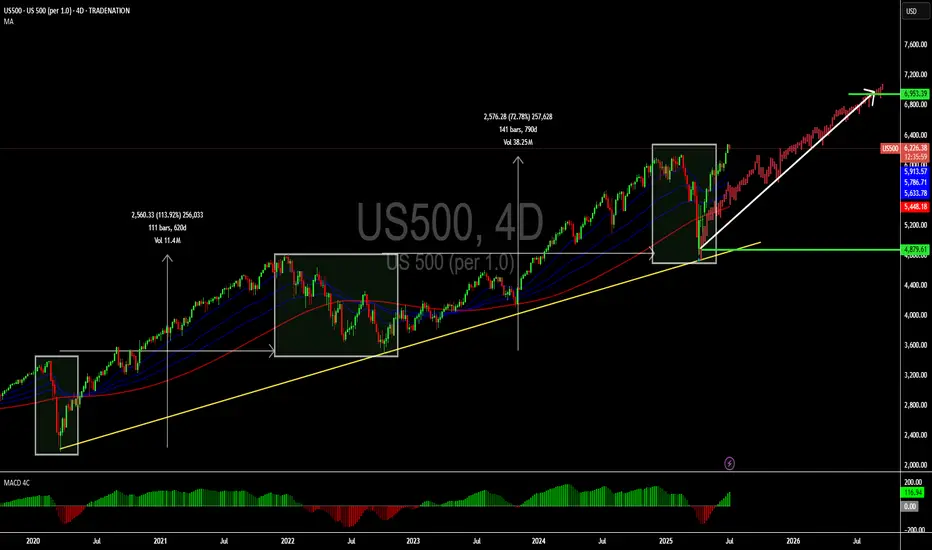
Market indices
uptrendIt is expected that the corrective pattern will end in the current support area and then the beginning of the upward trend will be formed.
If the index crosses the support area, the continuation of the corrective trend will be likely.
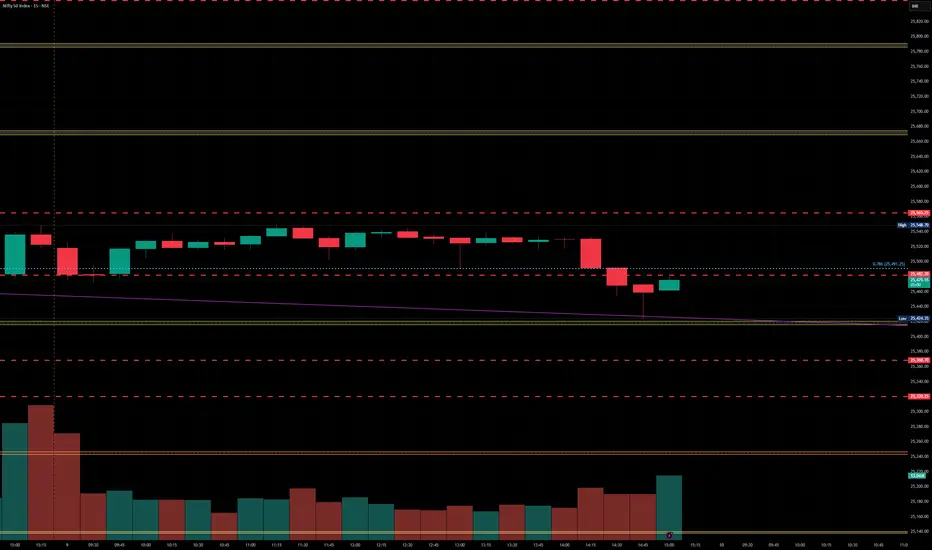
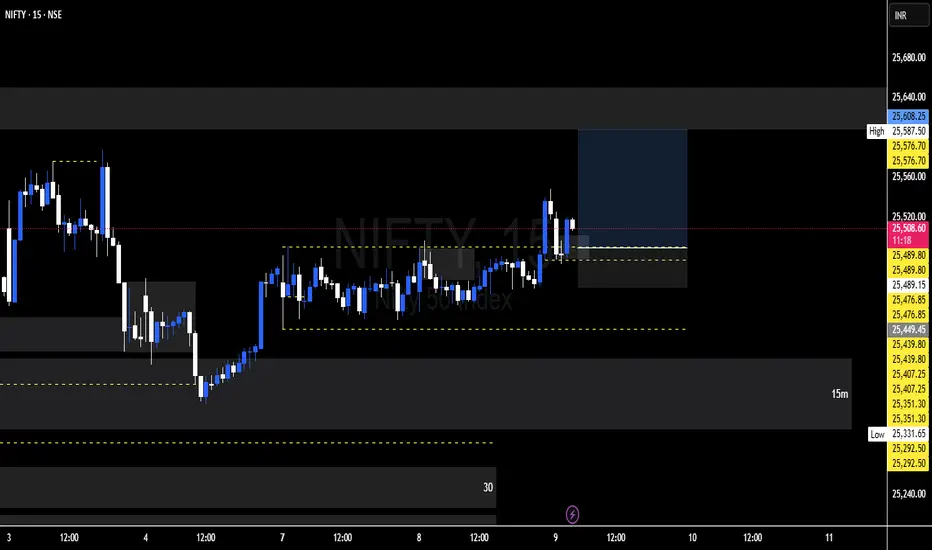
BankNifty levels - Jul 10, 2025Utilizing the support and resistance levels of BankNifty, along with the 5-minute timeframe candlesticks and VWAP, can enhance the precision of trade entries and exits on or near these levels. It is crucial to recognize that these levels are not static, and they undergo alterations as market dynamics evolve.
The dashed lines on the chart indicate the reaction levels, serving as additional points of significance. Furthermore, take note of the response at the levels of the High, Low, and Close values from the day prior.
We trust that this information proves valuable to you.
* If you found the idea appealing, kindly tap the Boost icon located below the chart. We encourage you to share your thoughts and comments regarding it.
Wishing you successful trading endeavors!
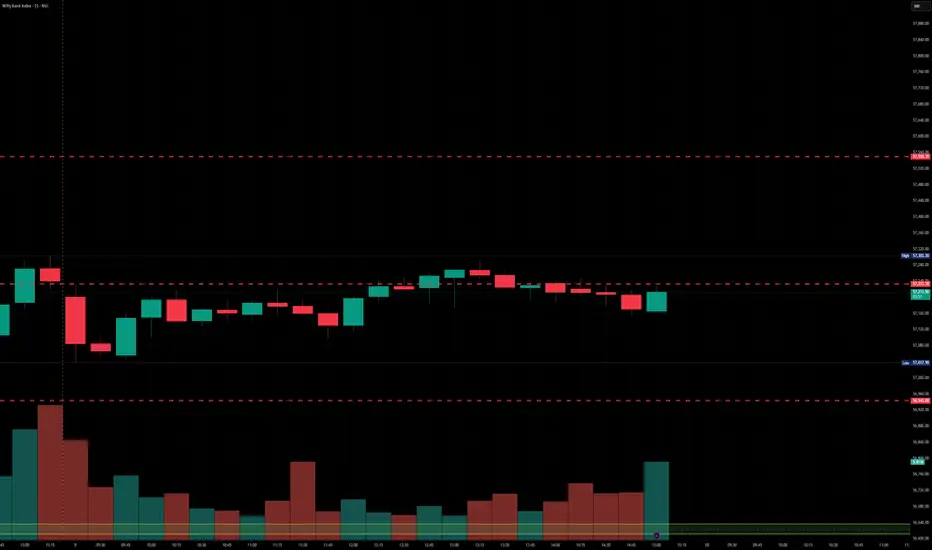
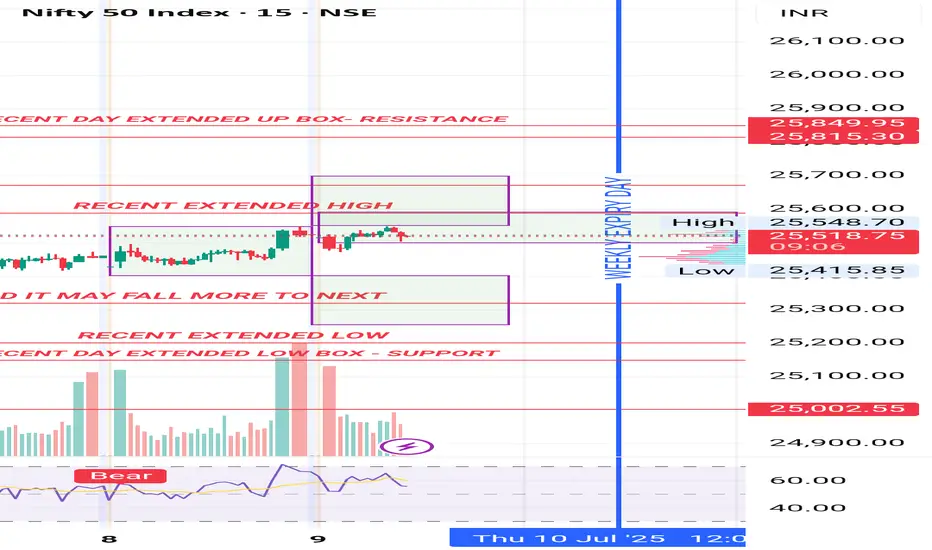
Nifty levels - Jul 10, 2025Nifty support and resistance levels are valuable tools for making informed trading decisions, specifically when combined with the analysis of 5-minute timeframe candlesticks and VWAP. By closely monitoring these levels and observing the price movements within this timeframe, traders can enhance the accuracy of their entry and exit points. It is important to bear in mind that support and resistance levels are not fixed, and they can change over time as market conditions evolve.
The dashed lines on the chart indicate the reaction levels, serving as additional points of significance to consider. Furthermore, take note of the response at the levels of the High, Low, and Close values from the day prior.
We hope you find this information beneficial in your trading endeavors.
* If you found the idea appealing, kindly tap the Boost icon located below the chart. We encourage you to share your thoughts and comments regarding it.
Wishing you success in your trading activities!
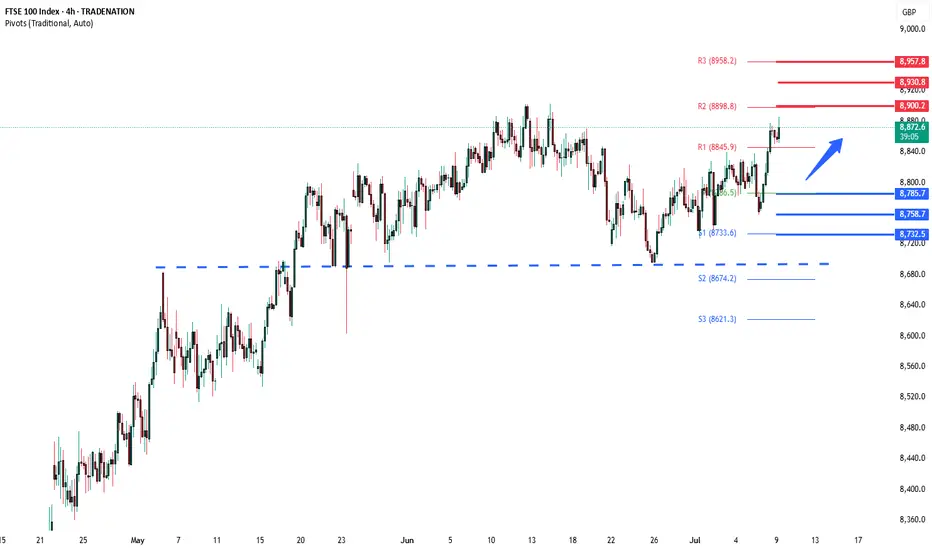
FTSE100 resistance breakoutThe FTSE remains in a bullish trend, with recent price action showing signs of a resistance breakout within the broader uptrend.
Support Zone: 8785 – a key level from previous consolidation. Price is currently testing or approaching this level.
A bullish rebound from 8785 would confirm ongoing upside momentum, with potential targets at:
8900 – initial resistance
8930 – psychological and structural level
8960 – extended resistance on the longer-term chart
Bearish Scenario:
A confirmed break and daily close below 8785 would weaken the bullish outlook and suggest deeper downside risk toward:
8760 – minor support
8730 – stronger support and potential demand zone
Outlook:
Bullish bias remains intact while the FTSE holds above 8785. A sustained break below this level could shift momentum to the downside in the short term.
This communication is for informational purposes only and should not be viewed as any form of recommendation as to a particular course of action or as investment advice. It is not intended as an offer or solicitation for the purchase or sale of any financial instrument or as an official confirmation of any transaction. Opinions, estimates and assumptions expressed herein are made as of the date of this communication and are subject to change without notice. This communication has been prepared based upon information, including market prices, data and other information, believed to be reliable; however, Trade Nation does not warrant its completeness or accuracy. All market prices and market data contained in or attached to this communication are indicative and subject to change without notice.
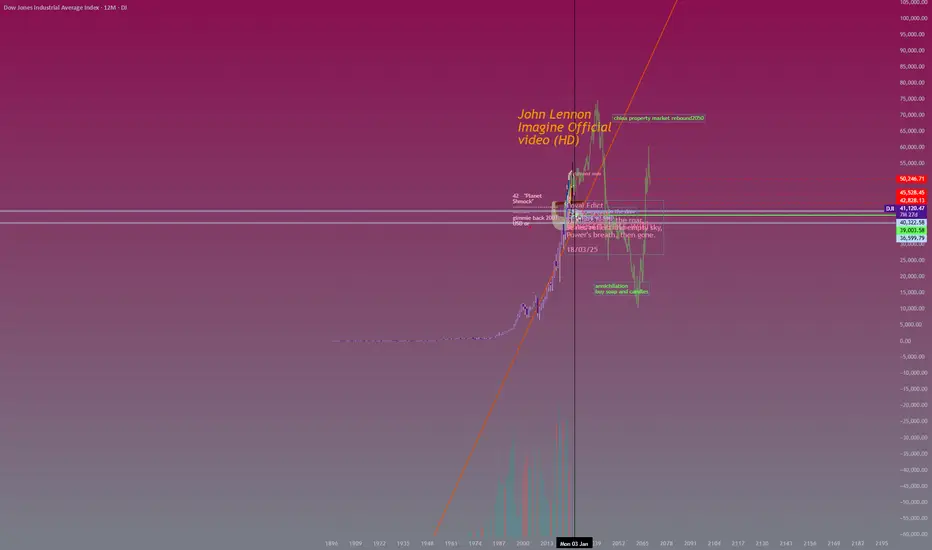
Dow Jons artistic outlook - a proposition for you to take or disWhen I'm looking at my chart, i like to know what this story is about.
This is what
the whole world is looking at,
some say between 1-5 years from, now we are all going to see what it is about.
Most of us want to prosper but there is a certain minority group who doesn't want that. Why? IDK tell me that.
--------------------------------------------------
The chart do not represent a prediction of any kind its more an invitation how to start thinking -about build.
---------------------------------------------------
Time is short although my chart is on 12 month time line
=================================================
they say 1-5 years but very unlikely now. I don't know if you can see that
there is a time in next 3 years when the trend goes up.
Its my 10 years of experience i and some hard challenging times. i tracked dow nearly 24/7 for 3 years now so i know what it is about. to explain it to you in full could take some time and here is not a place to do just that.
You can see some general shapes and possible traversals, it happens i track them quite correctly due to my different mind.
"I have good intuition when I'm true to myself
this is my point of view I hope to share with you."
SimonTheBeekeeper
PS:
when things starts to move fast
i have my map to find out
where and how.
--------------
thanks for watching I
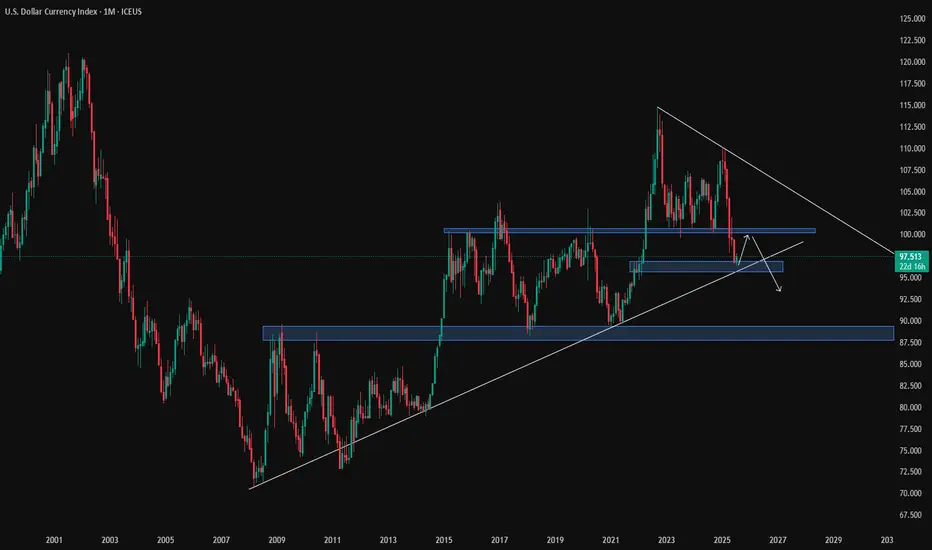
DOLLAR MONTHLYTHE monthly chart of dollar index reflect the economic health of the united states and the strength of the us dollar .
its key and critical to the direction and trade directional bias of AUDUSD,USDJPY,EURUSD,GBPUSD,USDZAR NZDUSD,USDCAD.
if this monthly chart is true expect a reversal on all the mentioned pairs.
GOLD could be exception as a top tier asset and store of value .
#dxy #dollar

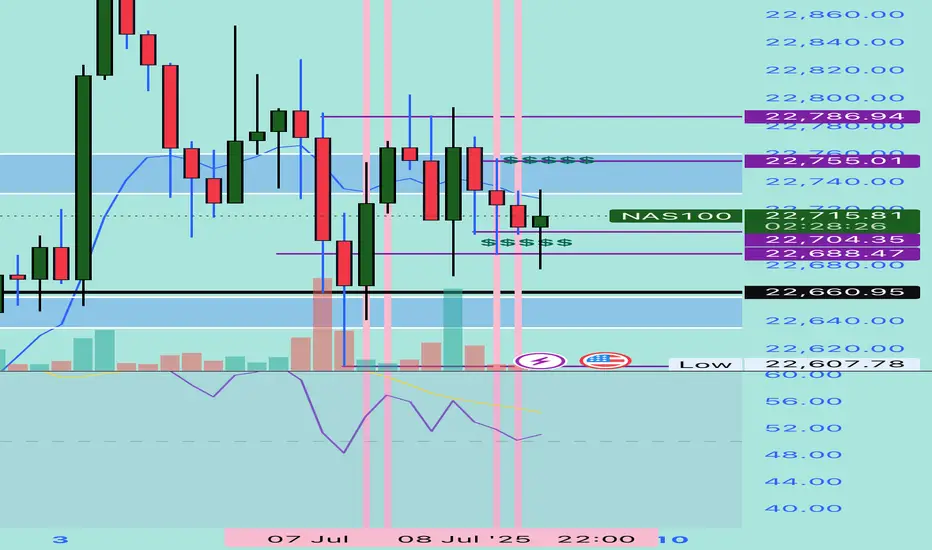
NASDAQ Potential DownsidesHey Traders, in today's trading session we are monitoring NAS100 for a selling opportunity around 22,750 zone, NASDAQ is trading in a downtrend and currently is in a correction phase in which it is approaching the trend at 22,750 support and resistance area.
Trade safe, Joe.
DXY DOLLAR INDEX The DXY has declined from its current high 114.54 to 96.59 reflecting a weaker dollar against a basket of major currencies including the euro, yen, pound, Canadian dollar, Swedish krona, and Swiss franc.
Despite this decline, the dollar remains supported by strong US economic growth and higher US 10-year bond yields, which have widened the yield gap with other developed economies .
The Federal Reserve’s monetary policy has been relatively hawkish, with fewer rate cuts priced in compared to other central banks, helping to underpin the dollar.
Trade tensions and tariff uncertainties continue to create volatility, but the dollar benefits from safe-haven demand amid global uncertainties
Composition of the DXY Basket:
Euro (EUR): 57.6%
Japanese Yen (JPY): 13.6%
British Pound (GBP): 11.9%
Canadian Dollar (CAD): 9.1%
Swedish Krona (SEK): 4.2%
Swiss Franc (CHF): 3.6%
context
Drivers: US economic strength, Fed policy, bond yield differentials, trade tensions, and safe-haven flows keeping dollar on support hold.
Ongoing US tariff announcements and trade policy changes have contributed to volatility and risk aversion, pressuring the dollar lower.
US Economic Policy the Market is concerned about fiscal policy, Federal Reserve independence, and rising US debt which have led to reduced demand for US assets, further weighing on the dollar.
Interest Rate Differential:
The US Fed funds rate remains at 4.50%-4.25%, but with global central banks adjusting policy, the relative appeal of the dollar has diminished.
Conversely, a sustained move above 98.00 could signal a reversal and renewed dollar strength.
hope we can get back to 100 aagin.
#dollar

Trading at the market topHello,
The stock market is back at an all-time high. This often brings excitement for existing investors—and a sense of anxiety or even FOMO (fear of missing out) for those who stayed on the sidelines when prices were lower.
It’s tempting to jump in, especially with headlines filled with optimism and portfolios showing green across the board. But this is also a time for caution and patience.
After a sustained rally, price levels often outpace fundamentals like earnings growth, economic stability, or interest rate trends. In such moments, valuations can become stretched, and investor sentiment overly euphoric conditions that typically precede short-term pullbacks or corrections.
Buying at the top locks in risk, not value.
If you're feeling late to the party, remember that good investors don’t chase prices—they wait for prices to come to them.
The best opportunities often come in moments of fear, not euphoria. And while this market high may go higher still, history shows that eventually, corrections come—and those prepared for them are the ones who win in the end.
Disclosure: I am part of Trade Nation's Influencer program and receive a monthly fee for using their TradingView charts in my analysis.
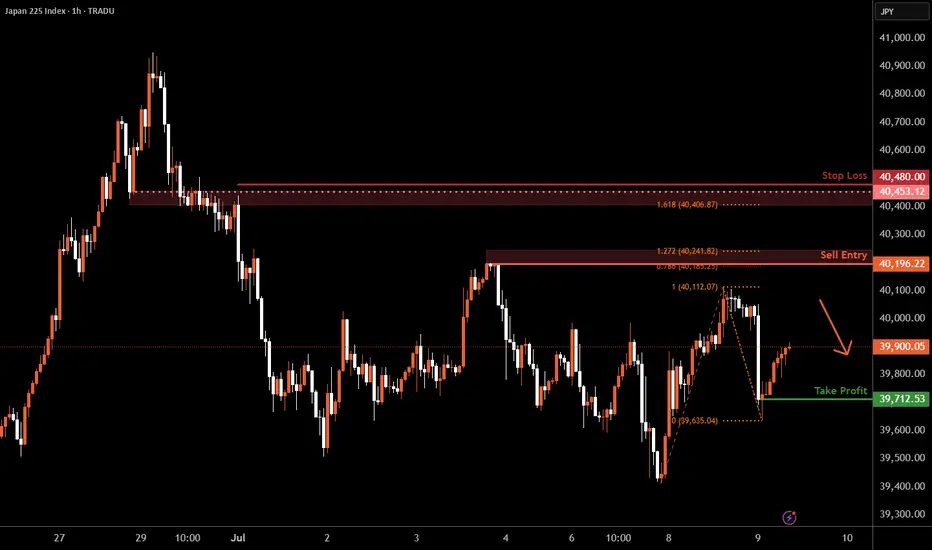
Nikkei 225 H1 | Swing-high resistance at a Fibo confluence zoneThe Nikkei 225 (JPN225) is rising towards a swing-high resistance and could potentially reverse off this level to drop lower.
Sell entry is at 40,196.22 which is a swing-high resistance that aligns with a confluence of Fibonacci levels i.e. the 78.6% projection and the 127.2% extension.
Stop loss is at 40,480.00 which is a level that sits above the 161.8% Fibonacci extension and an overlap resistance.
Take profit is at 39,712.53 which is a swing-low support.
High Risk Investment Warning
Trading Forex/CFDs on margin carries a high level of risk and may not be suitable for all investors. Leverage can work against you.
Stratos Markets Limited (tradu.com ):
CFDs are complex instruments and come with a high risk of losing money rapidly due to leverage. 63% of retail investor accounts lose money when trading CFDs with this provider. You should consider whether you understand how CFDs work and whether you can afford to take the high risk of losing your money.
Stratos Europe Ltd (tradu.com ):
CFDs are complex instruments and come with a high risk of losing money rapidly due to leverage. 63% of retail investor accounts lose money when trading CFDs with this provider. You should consider whether you understand how CFDs work and whether you can afford to take the high risk of losing your money.
Stratos Global LLC (tradu.com ):
Losses can exceed deposits.
Please be advised that the information presented on TradingView is provided to Tradu (‘Company’, ‘we’) by a third-party provider (‘TFA Global Pte Ltd’). Please be reminded that you are solely responsible for the trading decisions on your account. There is a very high degree of risk involved in trading. Any information and/or content is intended entirely for research, educational and informational purposes only and does not constitute investment or consultation advice or investment strategy. The information is not tailored to the investment needs of any specific person and therefore does not involve a consideration of any of the investment objectives, financial situation or needs of any viewer that may receive it. Kindly also note that past performance is not a reliable indicator of future results. Actual results may differ materially from those anticipated in forward-looking or past performance statements. We assume no liability as to the accuracy or completeness of any of the information and/or content provided herein and the Company cannot be held responsible for any omission, mistake nor for any loss or damage including without limitation to any loss of profit which may arise from reliance on any information supplied by TFA Global Pte Ltd.
The speaker(s) is neither an employee, agent nor representative of Tradu and is therefore acting independently. The opinions given are their own, constitute general market commentary, and do not constitute the opinion or advice of Tradu or any form of personal or investment advice. Tradu neither endorses nor guarantees offerings of third-party speakers, nor is Tradu responsible for the content, veracity or opinions of third-party speakers, presenters or participants.
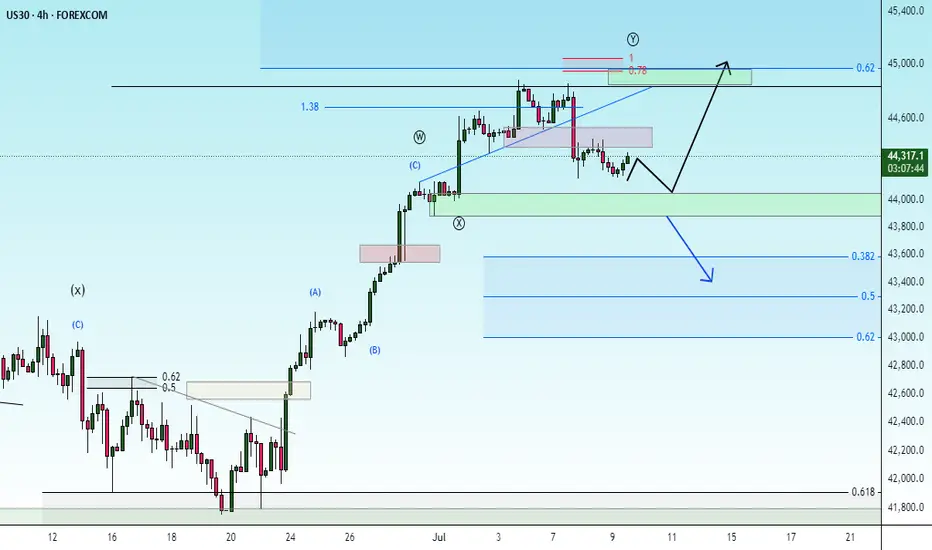
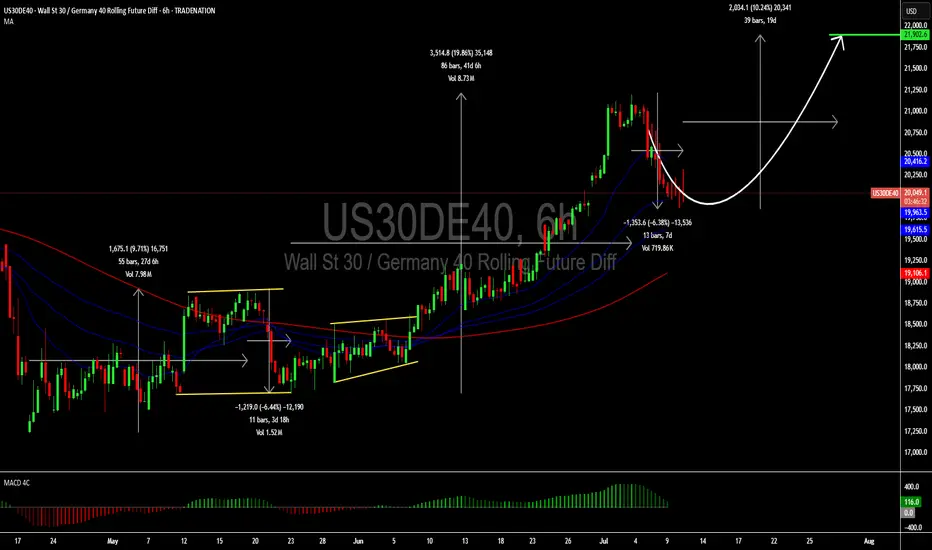
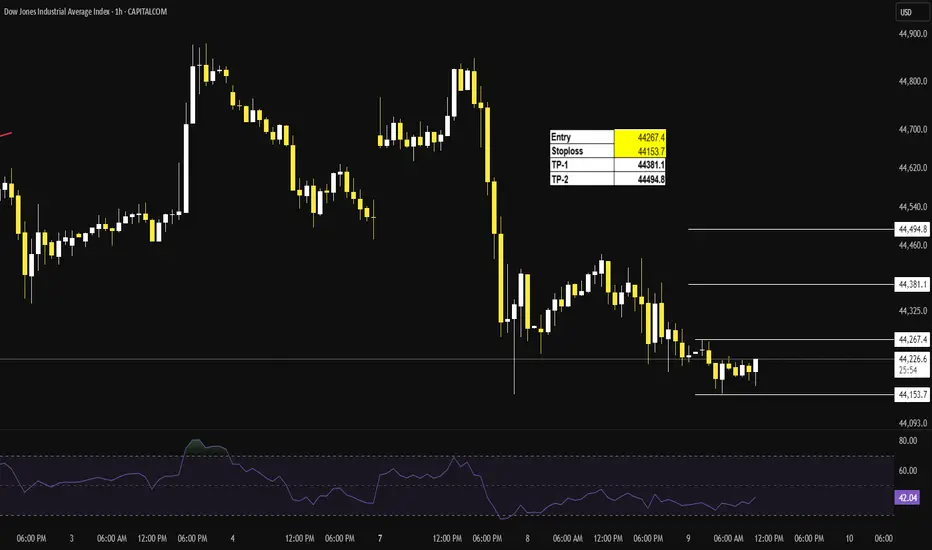
A small buy opportunity for US30DE40Hello,
The US30DE40 is on the rise since our last update. We see an opportunity for investors holding this asset to keep holding and those looking for short term opportunities to enter a small buy as we come closer to the moving average.
Those who were holding the asset from the bottom can look to manage their trades by at least moving the Stop loss to break even. The MACD Indicator is also getting close to zero reinforcing the upcoming bullish momentum.
Disclosure: I am part of Trade Nation's Influencer program and receive a monthly fee for using their TradingView charts in my analysis.
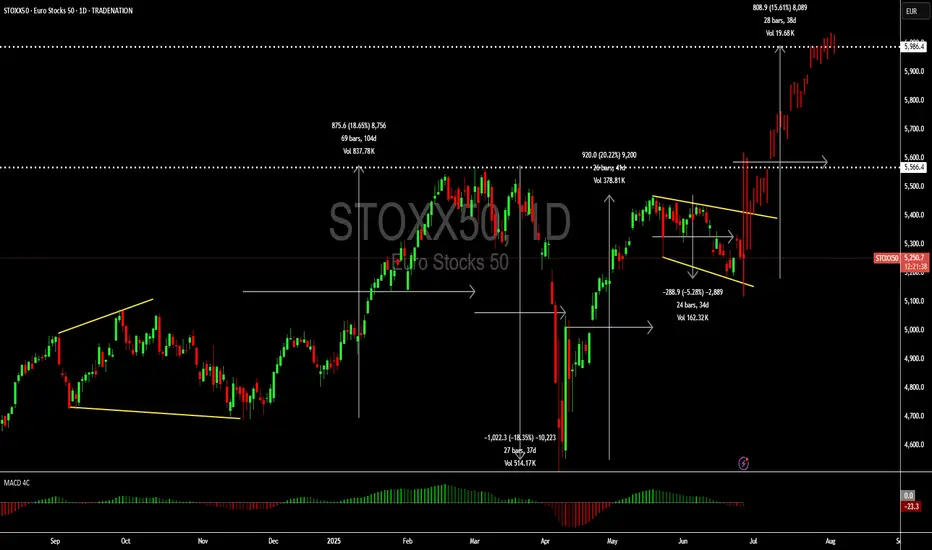
STOXX50: A great short term buyHello,
I see a short-term buying opportunity with a target of 6,000 for the Euro stocks 50. The EURO STOXX 50 is a stock index of Eurozone stocks designed by STOXX, an index provider owned by the Deutsche Börse Group. The index is composed of 50 stocks from 11 countries in the Eurozone.
EURO STOXX 50 represents Eurozone blue-chip companies considered as leaders in their respective sectors. It is made up of fifty of the largest and most liquid stocks. The index futures and options on the EURO STOXX 50, traded on Eurex, are among the most liquid products in Europe and the world.
With Europe gearing up for a rise as more money begins to flow into the European economies. The NATO has already had their meeting last week. After this development both the STOXX 50 and the STOXX 600 gained 0.3%, attempting to reverse losses from the previous sessions. NATO’s decision to raise defense spending targets from 2% to 5% of GDP by 2035 fueled a rally in European defense stocks, including Rheinmetall (1.4%) and BAE Systems (1.4%).
From a technical view the Euro stocks 50 is currently forming a correction and nearing a bullish crossover on the MACD indicator. We believe that the current price gives a great opportunity for short to medium buyers to take advantage.
Disclosure: I am part of Trade Nation's Influencer program and receive a monthly fee for using their TradingView charts in my analysis.
Nas100 is Still Correcting Nasdaq is Correcting
Long Term we are still Bullish
Remember that markets hunt liquidity
The short term trend is Lower Highs and Lower Lows
Price is still in Premium For Sells
Looking for a retest of previous short term high and my TP would be around 22580
The only way I would get into a buy trade if price would retest the current support and hold with very bullish price action. No little candles etc.
DXY - to provide short term bounce here DXY to bounce off key double confluence here to $100 before collapsing
SPX - short here to test pivot around 6,040hit key area on the backtest heading back down to 6k area
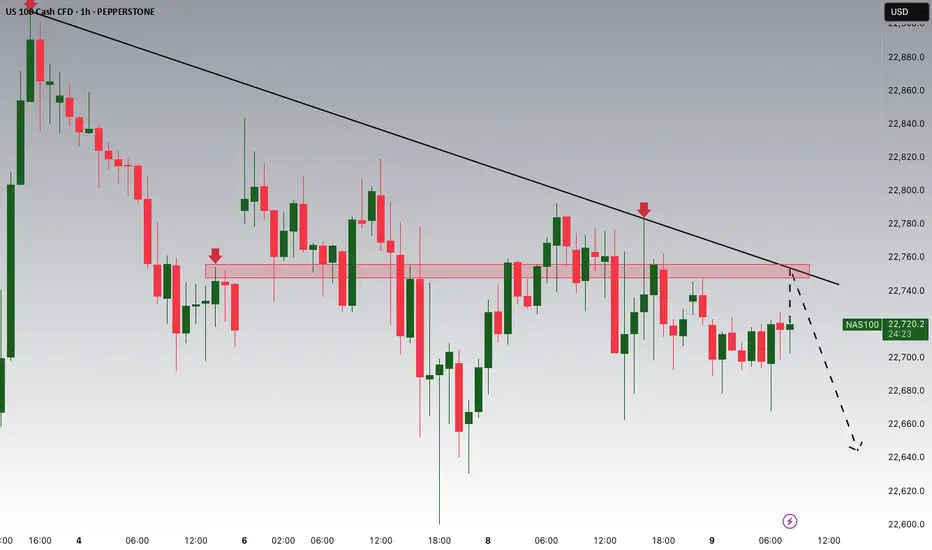
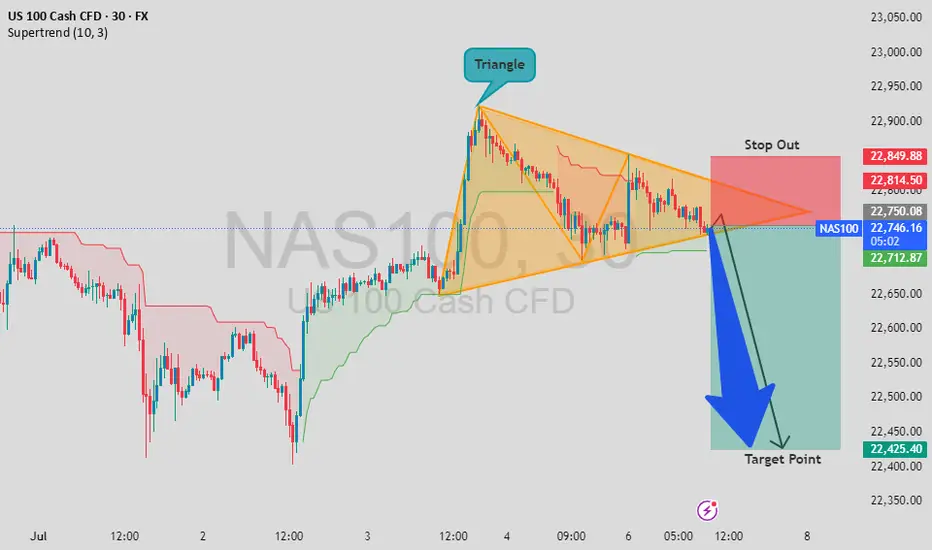
NAS100 - Bearish Triangle Breakdown Forming!NAS100 - Bearish Triangle Breakdown Forming!
A symmetrical triangle pattern has formed on the NAS100 30-min chart, signaling potential volatility ahead. We’re nearing the apex of the triangle, and price action suggests a possible bearish breakout.
🎯 Entry: 22,750.00
🎯Target: 22,400.40
⛔ Stop Out: 22,850.88
The risk/reward setup is favorable if the breakout follows through. Keep a close eye on volume confirmation as price exits the triangle.
What do you think about this triangle formation? Will the breakdown hold, or could bulls trap the shorts again?
💬 Share your opinion below and let’s discuss the setup!
🙏 If you find this helpful, please give it a like and follow for more technical ideas!
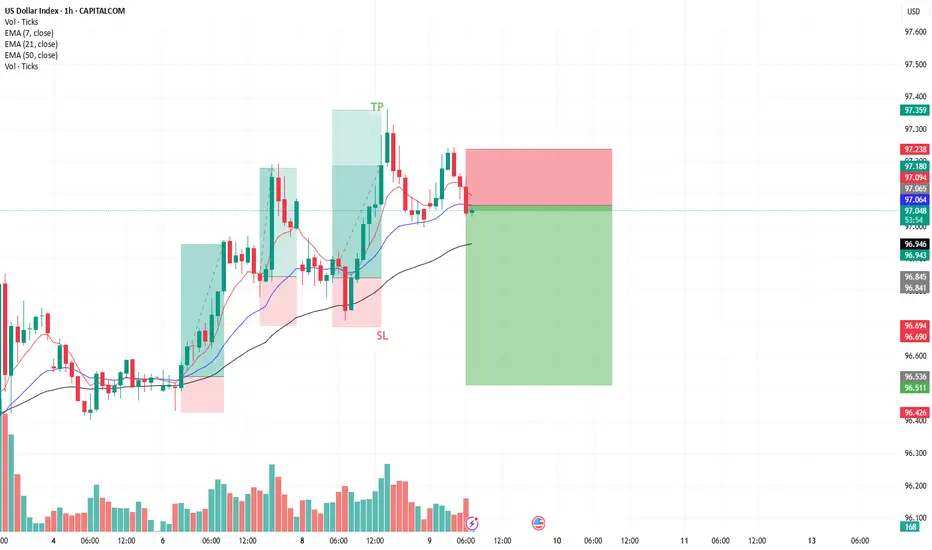
DXY Bearish Setup
Entry: 97.50 (current price)
Target (TP): 96.500 or below
Stop Loss (SL): ~97.80 (above recent swing high or resistance)
Risk Management: Essential — position size based on SL distance and account size
🔍 Trade Rationale:
Technical View: Price may be forming a lower high, suggesting possible downside continuation.
Fundamental Pressure:
Market cautious on Fed rate path
Tariff uncertainty could weaken USD
Upcoming FOMC minutes may add pressure if dovish signals emerge
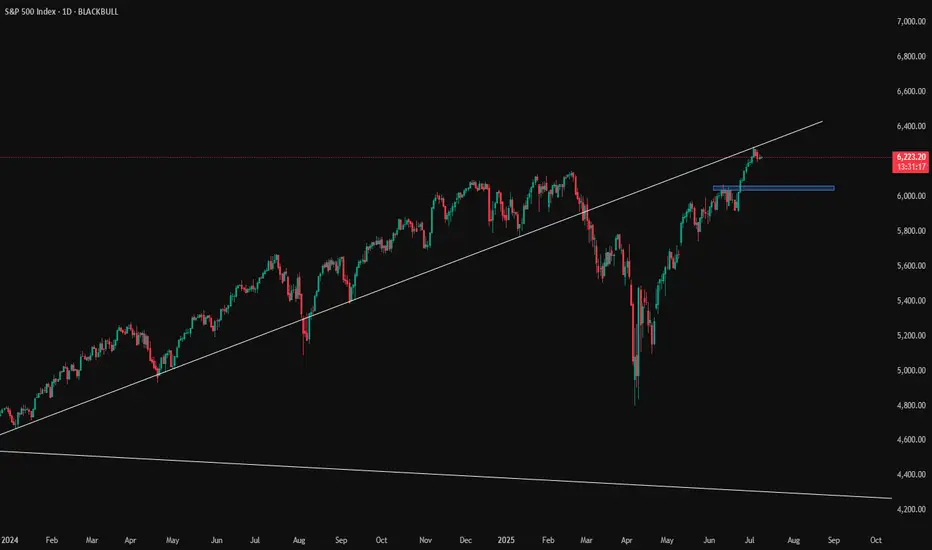
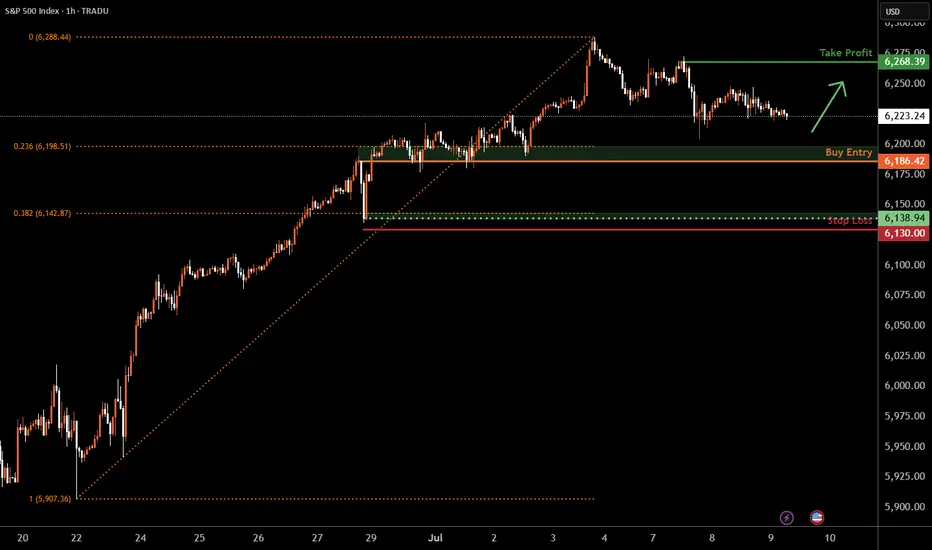
S&P 500 H1 | Falling toward an overlap supportThe S&P 500 (SPX500) is falling towards an overlap support and could potentially bounce off this level to climb higher.
Buy entry is at 6,186.42 which is an overlap support that aligns with the 23.6% Fibonacci retracement.
Stop loss is at 6,130.00 which is a level that lies underneath a swing-low support and the 38.2% Fibonacci retracement.
Take profit is at 6,268.39 which is a swing-high resistance.
High Risk Investment Warning
Trading Forex/CFDs on margin carries a high level of risk and may not be suitable for all investors. Leverage can work against you.
Stratos Markets Limited (tradu.com ):
CFDs are complex instruments and come with a high risk of losing money rapidly due to leverage. 63% of retail investor accounts lose money when trading CFDs with this provider. You should consider whether you understand how CFDs work and whether you can afford to take the high risk of losing your money.
Stratos Europe Ltd (tradu.com ):
CFDs are complex instruments and come with a high risk of losing money rapidly due to leverage. 63% of retail investor accounts lose money when trading CFDs with this provider. You should consider whether you understand how CFDs work and whether you can afford to take the high risk of losing your money.
Stratos Global LLC (tradu.com ):
Losses can exceed deposits.
Please be advised that the information presented on TradingView is provided to Tradu (‘Company’, ‘we’) by a third-party provider (‘TFA Global Pte Ltd’). Please be reminded that you are solely responsible for the trading decisions on your account. There is a very high degree of risk involved in trading. Any information and/or content is intended entirely for research, educational and informational purposes only and does not constitute investment or consultation advice or investment strategy. The information is not tailored to the investment needs of any specific person and therefore does not involve a consideration of any of the investment objectives, financial situation or needs of any viewer that may receive it. Kindly also note that past performance is not a reliable indicator of future results. Actual results may differ materially from those anticipated in forward-looking or past performance statements. We assume no liability as to the accuracy or completeness of any of the information and/or content provided herein and the Company cannot be held responsible for any omission, mistake nor for any loss or damage including without limitation to any loss of profit which may arise from reliance on any information supplied by TFA Global Pte Ltd.
The speaker(s) is neither an employee, agent nor representative of Tradu and is therefore acting independently. The opinions given are their own, constitute general market commentary, and do not constitute the opinion or advice of Tradu or any form of personal or investment advice. Tradu neither endorses nor guarantees offerings of third-party speakers, nor is Tradu responsible for the content, veracity or opinions of third-party speakers, presenters or participants.
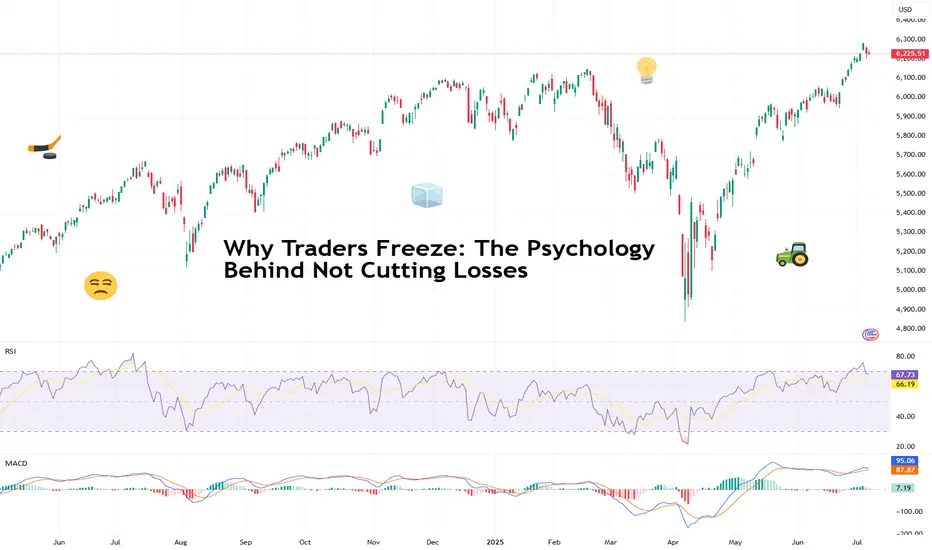
Why Traders Freeze: The Psychology Behind Not Cutting LossesFirst up: let’s address the elephant in the room. Loss aversion — that great human flaw. From the moment your ancient ancestor decided to poke a saber-toothed tiger to see what happens, the brain has been hard-coded to avoid pain at all costs.
Loss aversion is literally in your DNA — studies show people feel the sting of a loss twice as intensely as the pleasure of an equivalent gain.
When you see that trade slip into the red, your rational brain may say, “Cut it, the setup is invalid, live to trade another day.” But your emotional brain — the one still grunting in a cave — is screaming, “It might come back! Hold! HOOOLD!” So you sit, frozen.
🌱 Hope: The Most Expensive Four-Letter Word
Hope is the silent killer of trading accounts. You think you’re being patient as you decide to give the trade “room to breathe.”
But what you’re really doing is outsourcing your exit strategy to technical tools, news headlines, and anything that’s not your own choice, hoping something will rescue your losing position.
This is how tiny losses can turn into portfolio ruin. Just ask anyone who’s held a small-cap memecoin down 90% because the “team has potential.”
🧊 Analysis Paralysis: When the Chart Becomes a Maze
Another reason traders freeze? Overanalysis. One bad candle and suddenly you’re toggling between the 1-minute, 5-minute, and daily chart like you’re hacking into the Pentagon. And your trendlines? You’re probably drawing them wrong .
More data rarely leads to more decisive action. It just feeds your brain conflicting signals until you’re convinced you see a bounce that isn’t there. Meanwhile, the loss grows. And grows. And then you’re back to hope. Rinse, repeat.
😬 The Ego Monster: Admitting You’re Wrong
Here’s the harsh truth: cutting a loss means admitting you were wrong. For traders, whose entire identity can hinge on being “smart money,” that feels like public humiliation. The ego monster wants you to be right more than it wants you to be profitable.
So instead of taking the small L, you’ll cling to the trade because closing it out would force you to look in the mirror and say, “I was wrong and I need to do better.”
🏴☠️ From Risk Management to Revenge Trading
Once you’ve frozen long enough, you reach the next stage of the bad-losing cycle: revenge trading . Now you’re not just trying to recover your loss; you’re out to punish the market for “taking” your money.
Spoiler alert: the market doesn’t know you exist, and it certainly doesn’t care. Maybe this is the gambler’s mindset disguised as a “strategy?”
📉 Blame the Tools? Not So Fast
Some traders love to blame outside factors like the Economic calendar or their indicators when they freeze. “My RSI didn’t signal this! The MACD betrayed me!” Indicators are just tools — they don’t make decisions for you. You do.
Hiding behind tools means you refuse to take accountability. It’s a convenient excuse that can keep you stuck in the same losing habits. Better to master the one tool that matters: your discipline .
✂️ The Beauty of the Hard Stop
All hail the hard stop — the trader’s seatbelt. It’s not attractive, it’s mechanical, but it’s often the only thing standing between you and a potentially blown-up account.
The reason some traders can survive the market for decades isn’t because they’re never wrong — it’s because they’ve learned to make their stops non-negotiable.
A stop-loss is you telling your brain, “Hey, I’m not smarter than the market, so I’ll automate the decision before I get emotional.” It takes the agony out of cutting a loss because you’ve already decided on the outcome before your lizard brain can intervene.
⚖️ Small Losses Are the Cost of Doing Business
Want to feel better about cutting that loss? Think of it as your tuition fee. Every trader pays a certain cost to the market — it’s the cost of playing the game. No one gets every trade right. The pros just get better at losing small.
Those big-shot money spinners you look up to? They didn’t build their empire by never losing. They’re pros at getting out when they’re wrong. The difference between a pro and a blow-up isn’t the winning trade — it’s the ruthless discipline on the losing ones.
🧘♂️ Finding Comfort in Discomfort
There’s no magic trick to make loss-cutting feel good. It always stings. But you can train your brain to see a small loss as a win for your long-term survival. Write it down. Journal the trade . Log the emotion. Over time you’ll realize that the trades you exit early rarely haunt you.
🏁 Face the Fear, Keep the Account
And finally, freezing in front of a loss doesn’t protect you — it likely means you’ll pay more than you should. Next time your gut says, “Maybe it’ll come back…” ask yourself: “Do I want to be right, or do I want to trade another day?”
Your job is to trade well and stay in the game for as long as possible.
Your turn, traders : what’s your biggest “should’ve cut it sooner” horror story? Drop it below — we promise not to say we told you so.