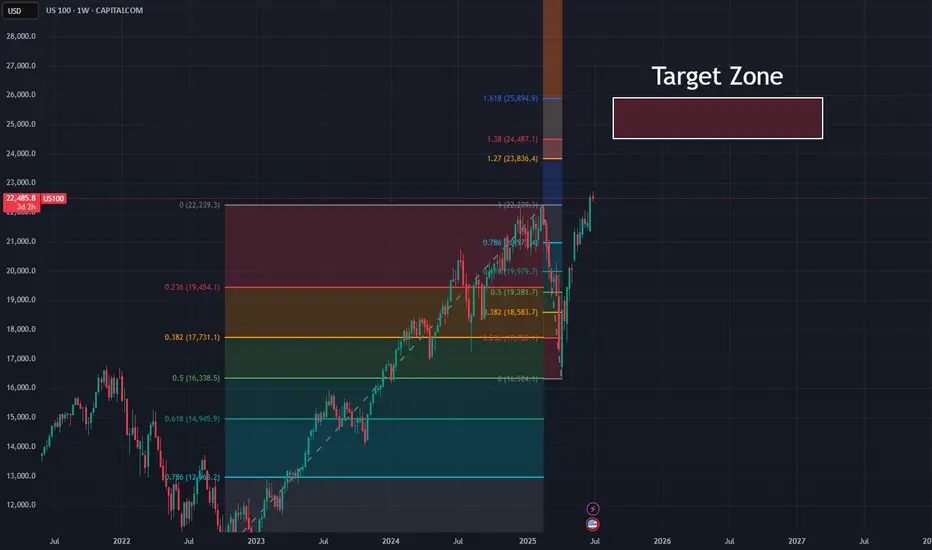
Up Up Up... Nothing Can Stop NAS From RisingLet's take a look at the big picture in the NASDAQ: Do you see how nicely the spring crash landed on the 50% retracement of the upward movement since fall 2022?
Now that we've crossed the old ATH, the targets are clear, and they're way up in the NASDAQ.
The summer correction is therefore likely to fail and probably turn into a listless sideways slide. By September at the latest, however, the NAS should pick up speed again and head for targets between 25,000 and 26,000 - at the very least.
Clear skies!
Market indices
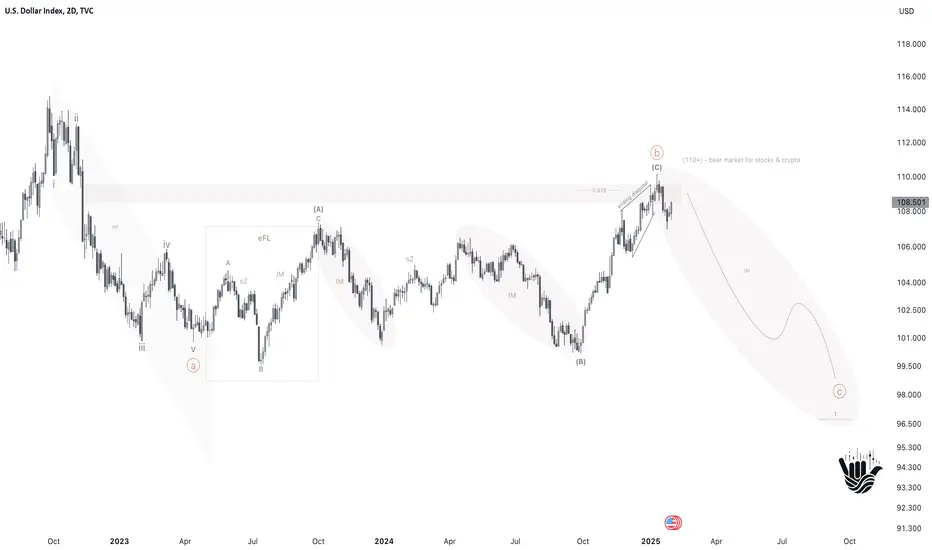
DXY at the Crossroads: How the 108–110 could reshape the market
Key Highlights
The U.S. Dollar Index TVC:DXY is currently near an important resistance level of 108–110.
A potential reversal of the dollar at this level could lead to further growth in stock markets and strengthen cryptocurrencies, while a break above 110+ would continue to put pressure on risk assets.
If CAPITALCOM:DXY surpasses 110 and holds above it, there is a possibility of reaching as high as the 120 mark. A rejection from the 108–110 zone would indicate a downward trend developing, possibly pushing the index toward the 98 area or lower.
Future outcomes will depend on Federal Reserve monetary policy, global demand for the dollar and other safe-haven assets, as well as overall economic stability.
What about crypto?
There are serious risks for CRYPTOCAP:TOTAL2 CRYPTOCAP:TOTAL3 & CRYPTOCAP:OTHERS
A long-term perspective on ICEUS:DXY suggests that “alt seasons” tend to occur during periods of dollar weakness. Currently, the 108–110 zone and the MA50-W are pivotal. A potential DXY reversal here may act as a catalyst for another major altcoin rally in the coming months, while continued dollar strength could postpone any such “alt season.”
Shaka
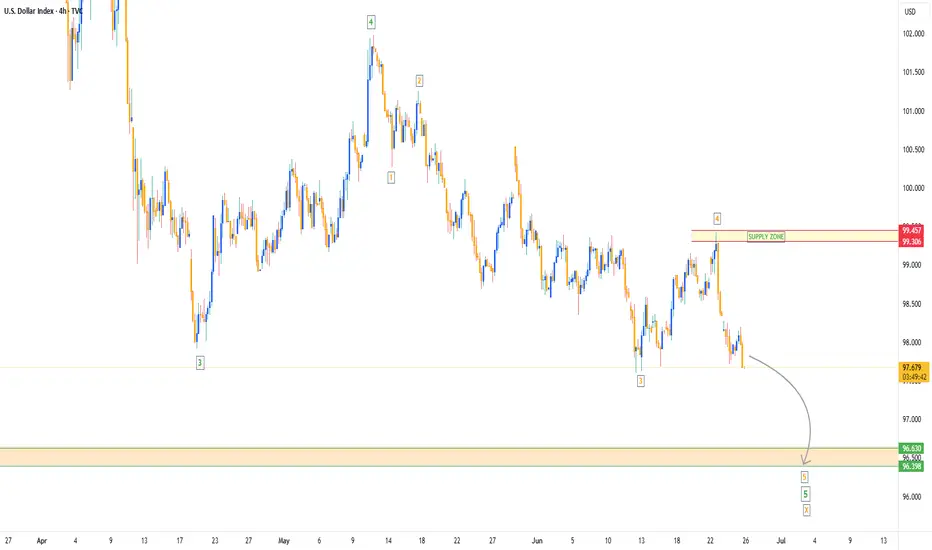
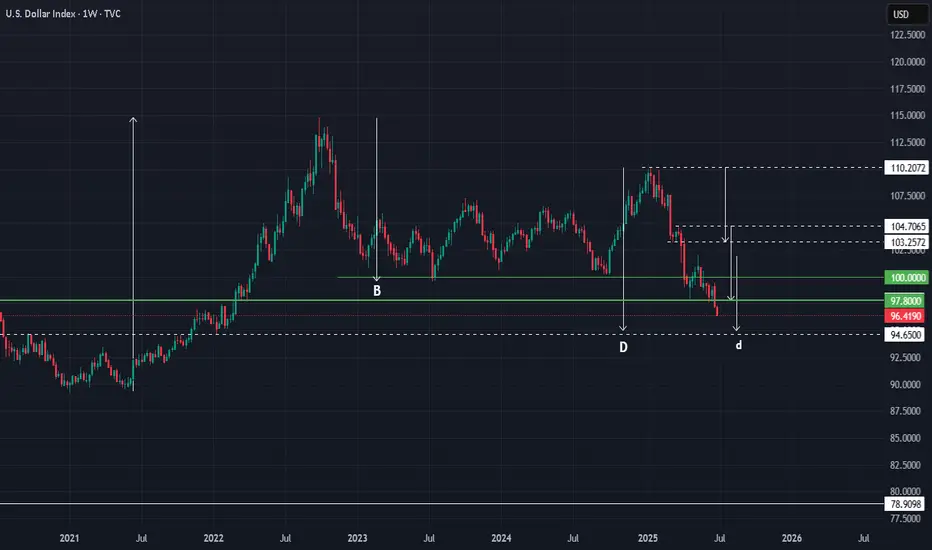
Dollar Index Bearish to $96The DXY has been in a downtrend for a while & that bearish pressure is not over yet. I expect more bearish downside towards the $96 zone, before we can re-analyse the market for any signs of bullish takeover.
⭕️Major Wave 3 Impulse Move Complete.
⭕️Major Wave 4 Corrective Move Complete.
⭕️Minor 4 Waves of Major Wave 5 Complete, With Minor Wave 5 Yet Pending.
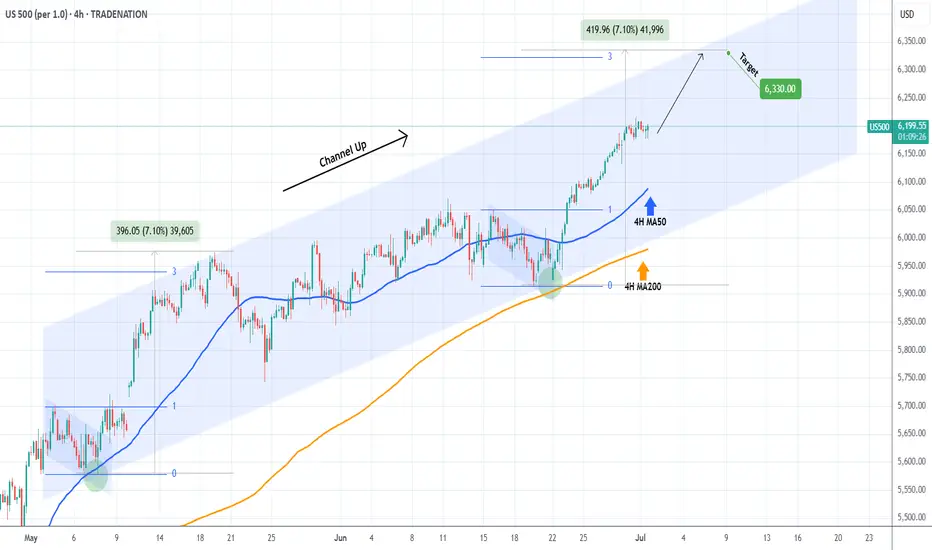
S&P500 Bullish Leg not over yet.The S&P500 index (SPX) has been trading within a Channel Up since the May 07 Low and is currently unfolding the latest Bullish Leg.
As you can see, it is far from having topped, not just by a plain trend-line (Higher Highs) perspective but also based on the Fibonacci and % rise terms relative to the previous Bullish Leg.
That peaked after a +7.10% rise, a little above the 3.0 Fibonacci extension. As a result, a 6330 Target on the short-term is more than fitting.
-------------------------------------------------------------------------------
** Please LIKE 👍, FOLLOW ✅, SHARE 🙌 and COMMENT ✍ if you enjoy this idea! Also share your ideas and charts in the comments section below! This is best way to keep it relevant, support us, keep the content here free and allow the idea to reach as many people as possible. **
-------------------------------------------------------------------------------
Disclosure: I am part of Trade Nation's Influencer program and receive a monthly fee for using their TradingView charts in my analysis.
💸💸💸💸💸💸
👇 👇 👇 👇 👇 👇
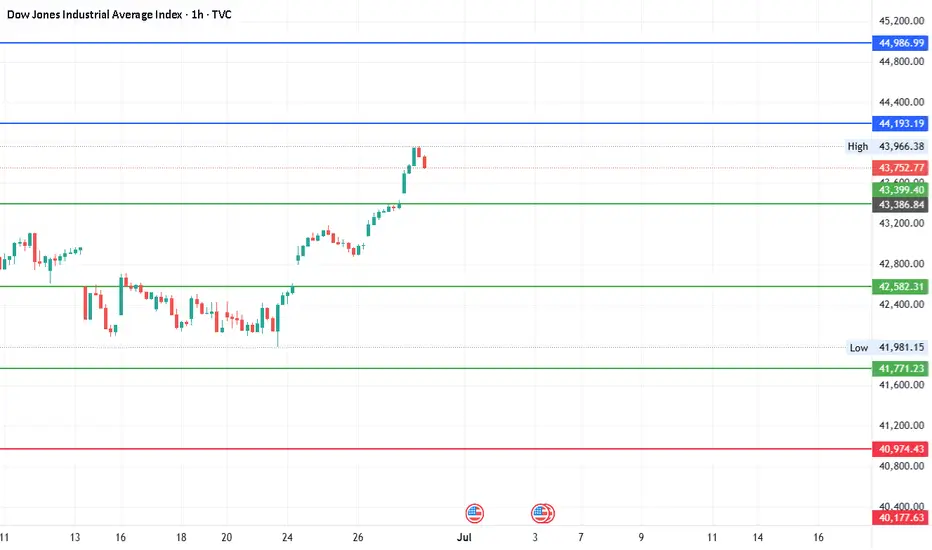
#DJI - Pivot is 42582.31 | Target 38374.12 or 46790.50?Date: 27-06-2025
This is in continuation with the previous post of 8000 points target. We have a new pivot point for the next move.
#Dow Jones Current Price: 43880.
Pivot Point: 42582.31 Support: 41771.23 Resistance: 43399.40
#Dow Jones Upside Targets:
Target 1: 44193.19
Target 2: 44986.99
Target 3: 45888.75
Target 4: 46790.50
#Dow Jones Downside Targets:
Target 1: 40974.43
Target 2: 40177.63
Target 3: 39275.875
Target 4: 38374.12
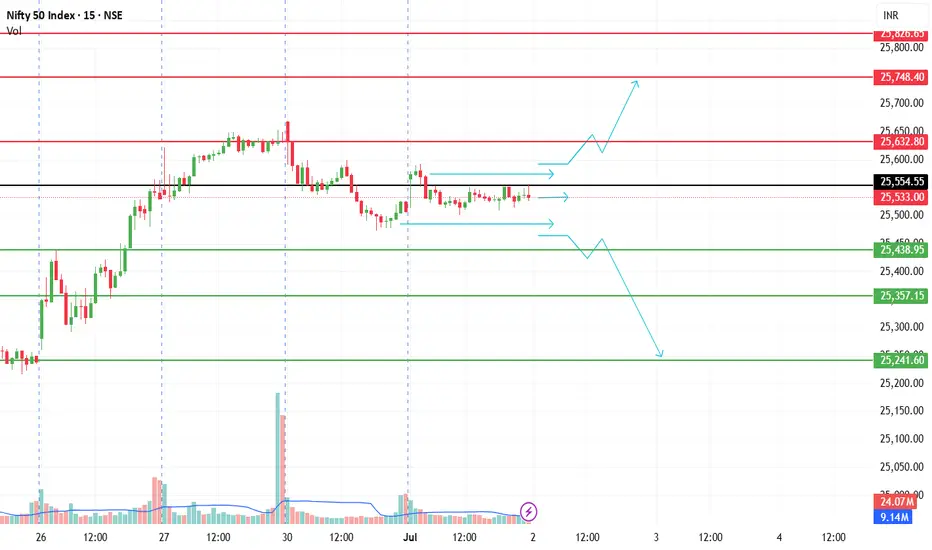
NIFTY VIEW FOR 02-07-2025Dear Trader, One more day coming for SIDEWAY market. unfortunately
Bullish -> if OPEN above 25550, 25750 will be the resistance and may volatile between 25600 and 25750.
Bearish -> if OPEN below 25450, 25250 will be the support and may slip to 25050
Sideway -> if OPEN around 25500, market will be ranging in-between 25550 to 25450
Thank You, Rest will be after OPENING, Have a profitable day!
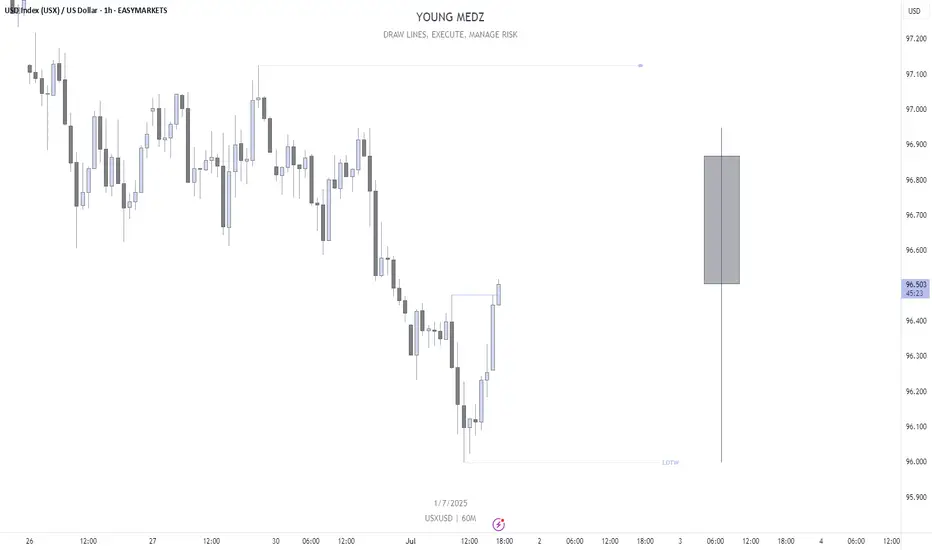
USXUSD LOTWUSXUSD LOTW Potentially In.
H1 BOS confirms this for me. Targeting H4 Internal Liquidity & Daily FVG.
Let's see.
The market bias stays up, MJ stocks may be a buy here. The market continues to be biased up, and the target is likely the weekly B. MJ stocks are showing technical signs that a reversal may come. There may be other sectors similar as I think the summer bottom gamblers will start appearing now that everything else is at the highs. Gold looks like it will eventually go lower. Nat gas lost support and is likely to go lower. USOIL is bear flagging.

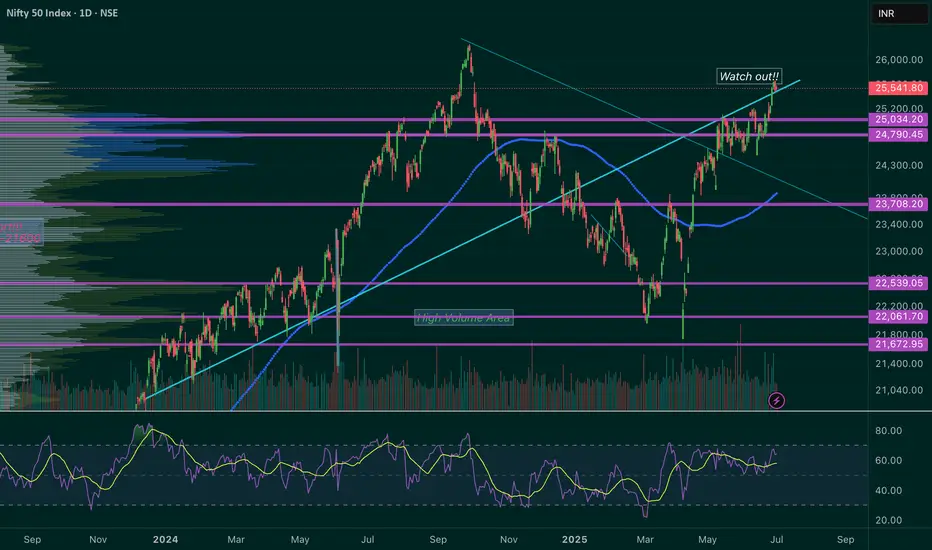
NIFTY is Testing its long term Trend Line.I’ve been keeping an eye on the ‘Watch Out’ area and the trend line that’s being tested. I’ve been following this trend line for a while now, and I’m excited to share some potential scenarios that could unfold in July.
Here are a few things to keep in mind:
1. The 25450 - 25550 range could become a key resistance and support area.
2. If NIFTY successfully retests this trend line and shows some upward movement, the next target could be 26000. In this case, I would recommend buying July 26000 Call options.
3. If NIFTY can’t hold this retest (which is less likely given NSE:NIFTY the current bullish market sentiment), our next watchout zone could be 25000 - 24800.
4. We might even be seeing an all-time high NIFTY soon!
Disclaimer: Please do your own research before investing. This is just my personal opinion, and I don’t force anyone to invest based on my ideas.
I would be looking for reversal patterns on the ES and the Russe7 1 25 I made a few mistakes naming some of the markets but if you can deal with that then I explain what my concerns are regarding some of the patterns. most of the trades that I posted as trading opportunities have moved higher and did not require large stops. I spent time on a certain pattern that I don't really talk about but it influenced my Trading and gives me caution not to stay in a market to Long.... and I tried to use the the gold and the silver because I really am tied into those markets and I'm concerned about a pattern on the gold that is actually giving a signal to be long but I'm still concerned about it and I tried to articulate that in the video.... it's about the concept of what that pattern represents to me..... and incorrect or the market trades differently it's not a big deal..... the irony in the video is that I tried to show that pattern thinking that I was in a certain Market and I had the wrong Market..... the only thing I would say is there's a certain pattern and they think Gold's a very good example and will give me a chance to talk about it in a couple of days and I want to see if it actually can make a new high which I am concerned about because I want that new high to sell some of my goal but I want a good price and it's a large amount.... and I'm not doing this to be egotistical or trying to prove a point.... I'm willing to show something that's actually going on and I'm willing to talk about it. a number of people are entering in my trades which is perfectly fine and they try to make statements in my videos that require that you go back and reevaluate those videos to see what happened and that's the best way to learn. I stopped looking at other people's charting mostly because I'm happy with what I do but also when people chart something and project a Target but never do anything else to help you determine if that projection was correct that's not of any value. if you can find somebody who finds an entry and tells you what it is or that it's about to happen and that person does a video on it which he cannot change so that even though you don't see the actual trade the market trades in the direction and has reversals that are outlined before they happen that's the best way to trade it completes the cycle of trading.... and the beautiful thing is if you post it you can't erase it.... that's how you can learn effectively if you go back and create the patterns that were shown to you previously.

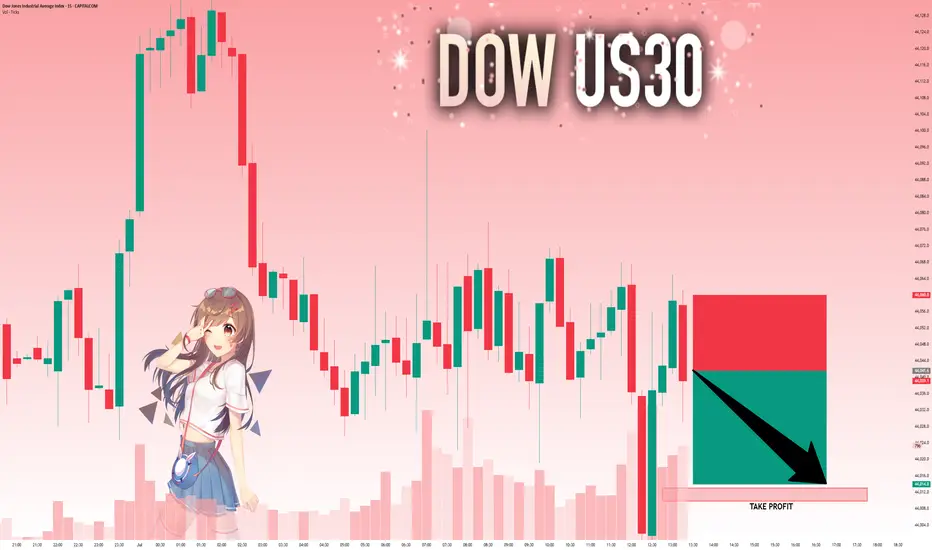
US30: Bears Are Winning! Short!
My dear friends,
Today we will analyse US30 together☺️
The market is at an inflection zone and price has now reached an area around 44,041.6 where previous reversals or breakouts have occurred.And a price reaction that we are seeing on multiple timeframes here could signal the next move down so we can enter on confirmation, and target the next key level of 44,013.0..Stop-loss is recommended beyond the inflection zone.
❤️Sending you lots of Love and Hugs❤️
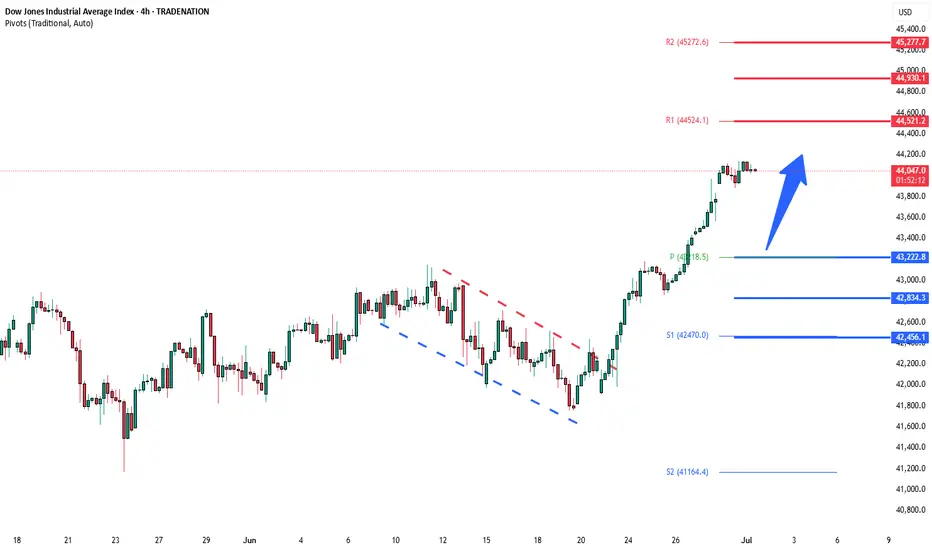
DowJones key trading level at 43220Key Support and Resistance Levels
Resistance Level 1: 44520
Resistance Level 2: 44930
Resistance Level 3: 45280
Support Level 1: 43220
Support Level 2: 42830
Support Level 3: 42460
This communication is for informational purposes only and should not be viewed as any form of recommendation as to a particular course of action or as investment advice. It is not intended as an offer or solicitation for the purchase or sale of any financial instrument or as an official confirmation of any transaction. Opinions, estimates and assumptions expressed herein are made as of the date of this communication and are subject to change without notice. This communication has been prepared based upon information, including market prices, data and other information, believed to be reliable; however, Trade Nation does not warrant its completeness or accuracy. All market prices and market data contained in or attached to this communication are indicative and subject to change without notice.
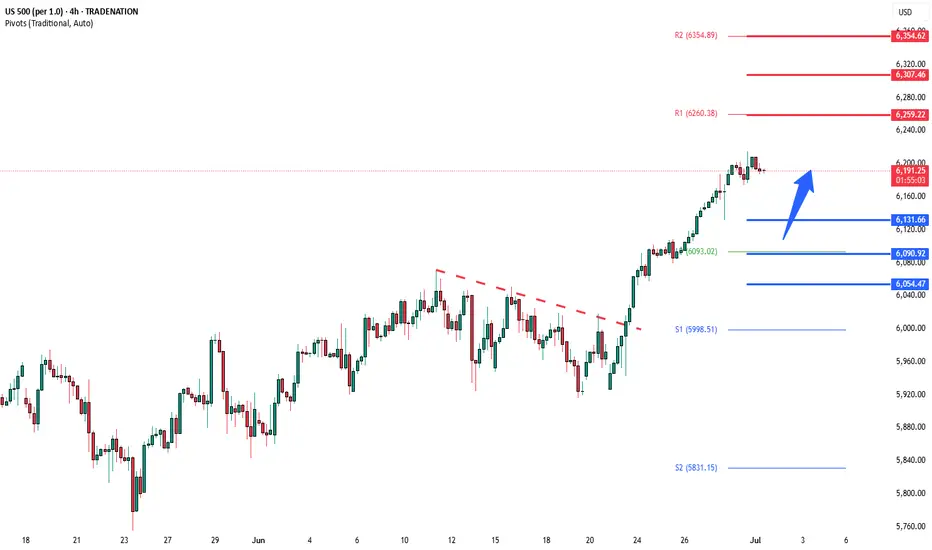
S&P500 key trading level at 6130Trade Tensions:
Trump has threatened higher tariffs on Japan, criticising its refusal to import U.S. rice.
The EU is open to a trade deal with the U.S. involving a 10% universal tariff on many exports, but seeks lower rates for key sectors like pharmaceuticals and semiconductors.
Markets:
U.S. equity futures are steady after the S&P 500 posted its best quarter since 2023.
Focus remains on trade developments and ongoing disputes in Washington over a major $3.3 trillion tax bill.
Canadian stocks are outperforming, led by gold miners, as investors seek safe-haven hedges amid tariff risks.
U.S. Tax Bill:
Republican leaders are struggling to secure votes.
A controversial AI regulation amendment was rejected.
Yale economists estimate the bill would cost the bottom 20% of earners $560/year, while the top 20% gain $6,055/year on average.
Corporate News:
Apple may use OpenAI or Anthropic’s AI to upgrade Siri, potentially sidelining its own AI models.
Key Support and Resistance Levels
Resistance Level 1: 6260
Resistance Level 2: 6310
Resistance Level 3: 6350
Support Level 1: 6130
Support Level 2: 6090
Support Level 3: 6055
This communication is for informational purposes only and should not be viewed as any form of recommendation as to a particular course of action or as investment advice. It is not intended as an offer or solicitation for the purchase or sale of any financial instrument or as an official confirmation of any transaction. Opinions, estimates and assumptions expressed herein are made as of the date of this communication and are subject to change without notice. This communication has been prepared based upon information, including market prices, data and other information, believed to be reliable; however, Trade Nation does not warrant its completeness or accuracy. All market prices and market data contained in or attached to this communication are indicative and subject to change without notice.
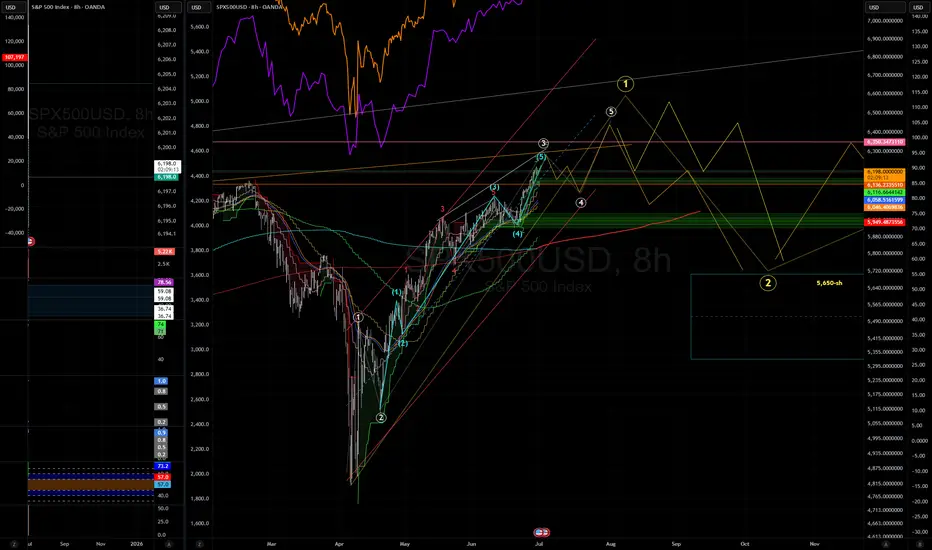
SPX partial profit pivot approaching Looks like we are entering a choppy 4-5, 4-5 topping pattern will likely take 1-2 week to play out to a point where we can see the waves more clearly. This is slightly more bullish option.
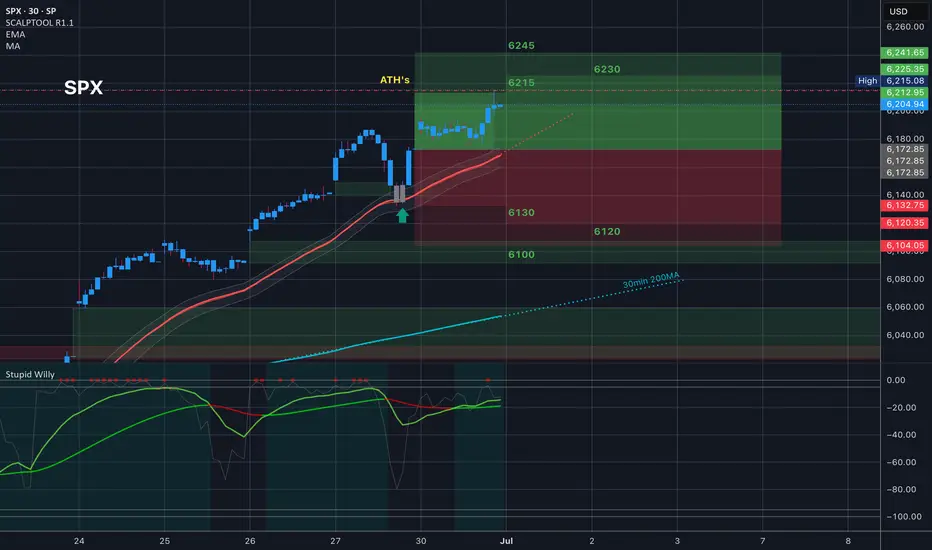
$SPX Made new ATH’s
Yesterday’s price action was flat near previous ATH’s for the first part of the day and then the second part of the day we had some nice volatility that tapped the top of the implied move at 6215 and made new ATH’s just above that at 6215.08 and then pulled back. It’s worth knowing where the top of the implied move is.
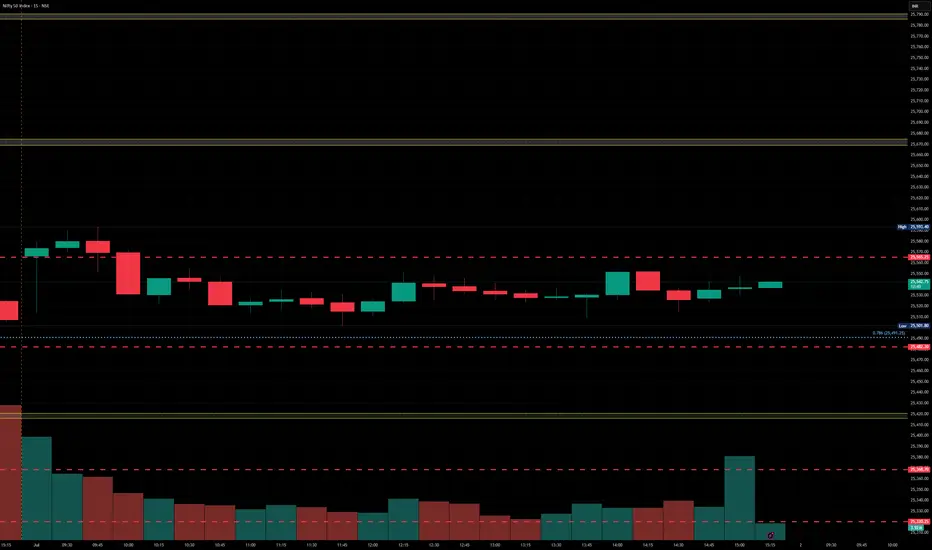
Nifty levels - Jul 02, 2025Nifty support and resistance levels are valuable tools for making informed trading decisions, specifically when combined with the analysis of 5-minute timeframe candlesticks and VWAP. By closely monitoring these levels and observing the price movements within this timeframe, traders can enhance the accuracy of their entry and exit points. It is important to bear in mind that support and resistance levels are not fixed, and they can change over time as market conditions evolve.
The dashed lines on the chart indicate the reaction levels, serving as additional points of significance to consider. Furthermore, take note of the response at the levels of the High, Low, and Close values from the day prior.
We hope you find this information beneficial in your trading endeavors.
* If you found the idea appealing, kindly tap the Boost icon located below the chart. We encourage you to share your thoughts and comments regarding it.
Wishing you success in your trading activities!
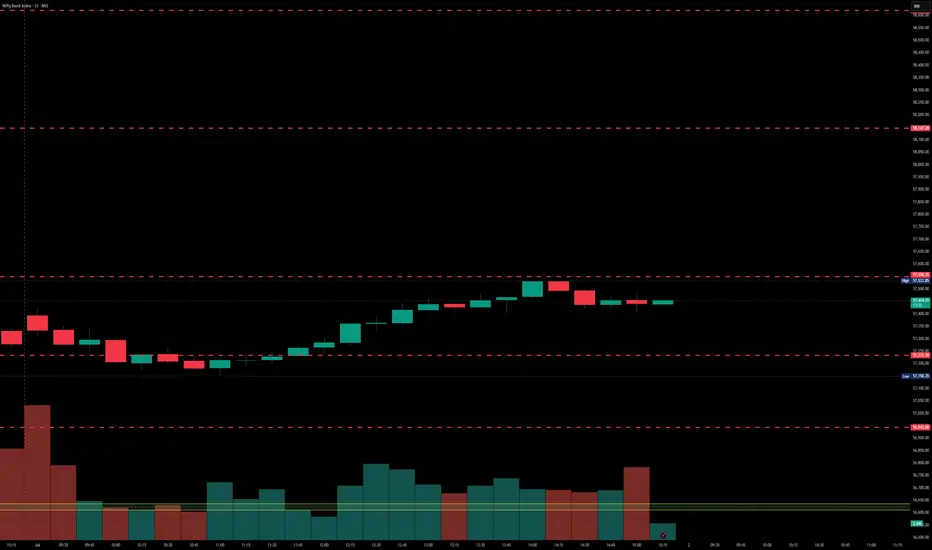
BankNifty levels - Jul 02, 2025Utilizing the support and resistance levels of BankNifty, along with the 5-minute timeframe candlesticks and VWAP, can enhance the precision of trade entries and exits on or near these levels. It is crucial to recognize that these levels are not static, and they undergo alterations as market dynamics evolve.
The dashed lines on the chart indicate the reaction levels, serving as additional points of significance. Furthermore, take note of the response at the levels of the High, Low, and Close values from the day prior.
We trust that this information proves valuable to you.
* If you found the idea appealing, kindly tap the Boost icon located below the chart. We encourage you to share your thoughts and comments regarding it.
Wishing you successful trading endeavors!
DXY : Lets wait and seeThe chart above explains.
Price is in a hurry. Looks like time is limited. I think the snap-back would be a quick one.
Looking good judging the 10Y and 30Y movement now
Good luck @ 94.65
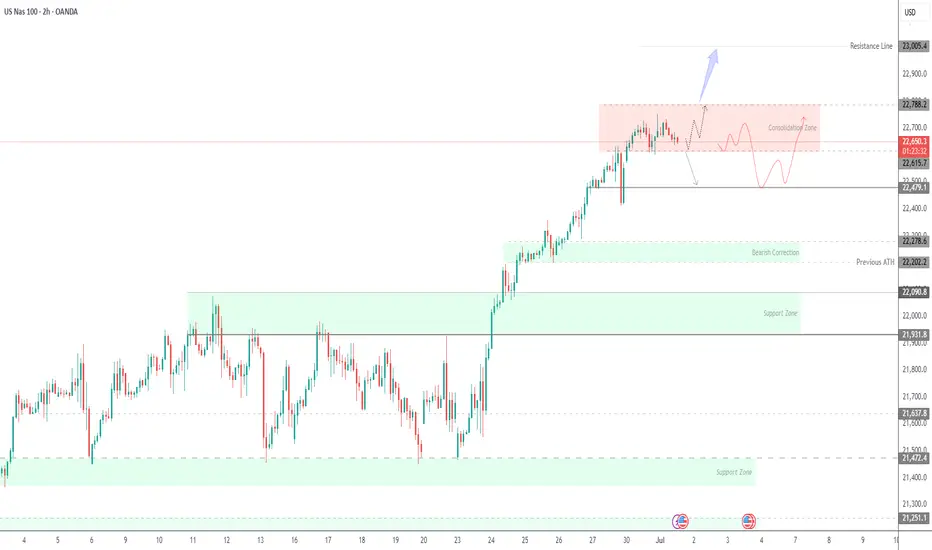
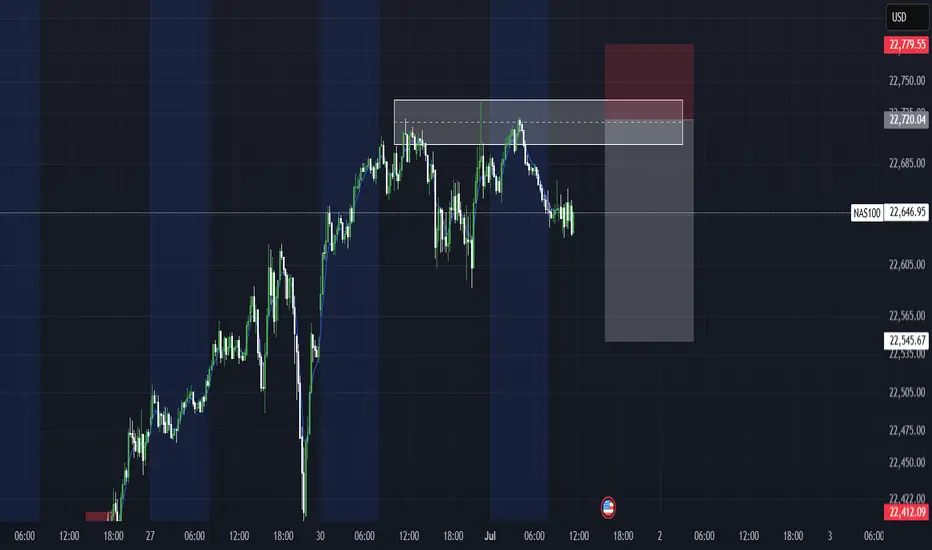
USNAS100 Bullish Momentum Holds Above Key PivotUSNAS100 – Overview
The price successfully retested the 22,610 level and resumed its bullish trend, reaching 22,750 as anticipated in our previous idea.
Currently, the index needs to maintain stability above the 22,610 pivot line to sustain the upward momentum toward the next resistance at 22,790. A sustained move above this level may open the path toward 23,000.
However, a 1H candle close below 22,610 could trigger a corrective move down to 22,480. A break below this support would expose the next key level at 22,280.
Pivot: 22,610
Resistance: 22,790 – 23,000
Support: 22,480 – 22,280
Nas100With speculation about no rate cuts we can expect to see Nas100 plumet with Fed Powells upcoming speech.
If we look at the technical side we can see that Nas has been somewhat consolidating over the past 2 days creating a fair amount of Sell side liquidity. We can expect Powell to speak about rat cuts today in his upcoming speech and we will use this to our advantage waiting for early buyers to push up the market triggering our setup.
We can look for a plus minus 100 pip move before Nas turns around, we will however closely monitor the movement of Nas now until the speech so that we can execute a trade with the least amount of risk.
Remember to like and subscribe for more A+ setups.
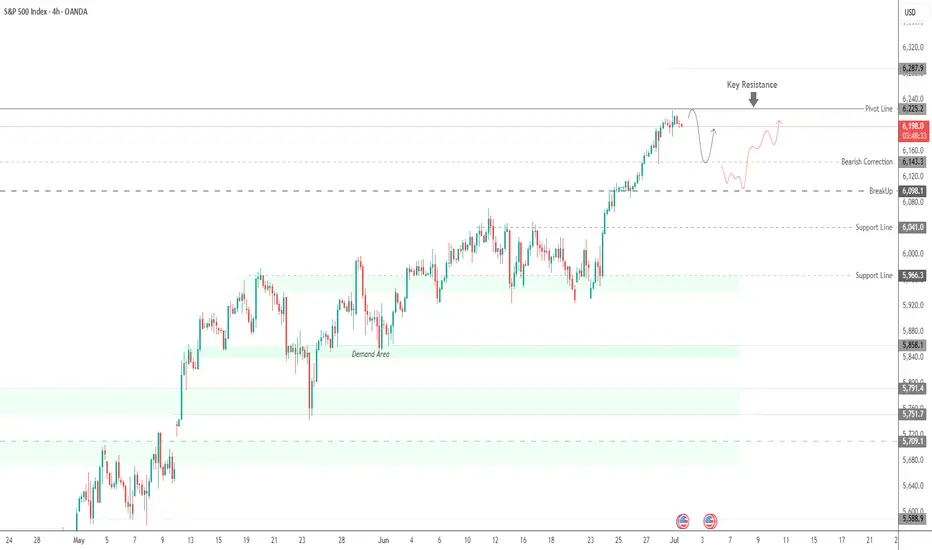
SPX500 | Bulls Need Break Above 6225 to Regain ControlSPX500 | Market Overview
The price has reached the previously mentioned resistance level at 6225.
As long as it trades below 6225, a technical correction is likely, with downside targets at 6161 and 6143. From there, the index would need to stabilize above 6143 to resume a bullish structure.
However, a 1H candle close below 6143 would confirm a deeper bearish move toward 6098.
On the upside, a 1H close above 6225 would reinforce bullish momentum, with potential to reach 6250 and 6287.
Key Technical Levels
Pivot Level: 6191
Support: 6161 / 6143 / 6098
Resistance: 6225 / 6250 / 6287