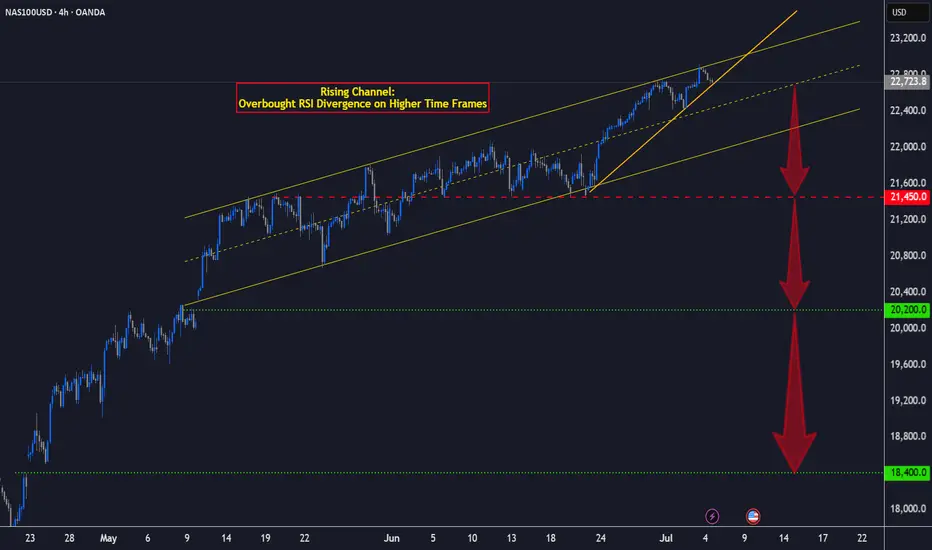
NAS100 CAUTION - Realistic Perspective!!Dear Friends in Trading,
How I see it,
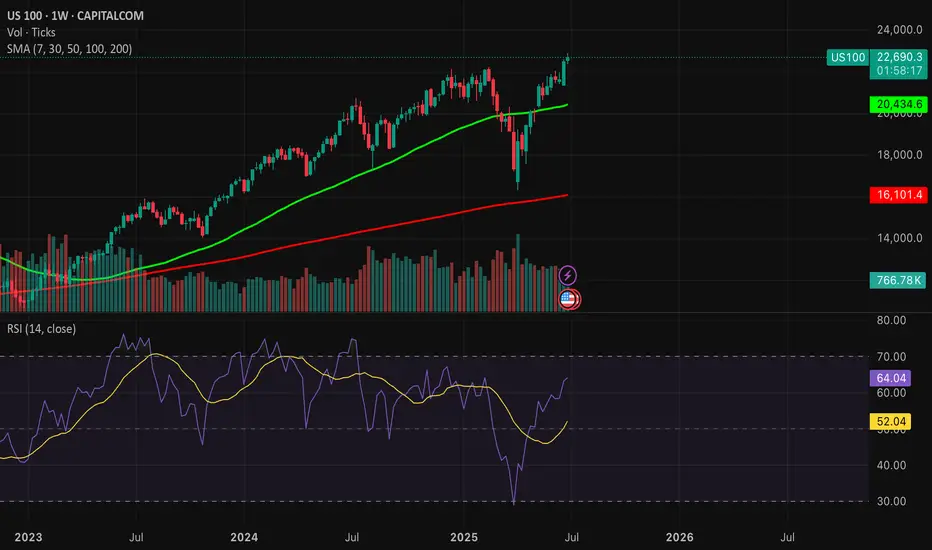
This rising channel represents severe overbought greed territory.
A very big correction might be around the corner or in the near future.
Daily and Weekly RSI Divergence could be forced to re-balance at any time.
Keynote:
This is not a contradiction of my previous NASDAQ post.
Short-Term strong bullish price action can still prevail.
But please keep this big picture in mind from here on end.
Feel free to ask questions if anything is unclear.
I sincerely hope my point of view offers a valued insight.
Thank you for taking the time to study my analysis.
Market indices
DOW Jones go upCMCMARKETS:US30
Reaching the price level of 45,082.74 is inevitable. From the current closing price, there is a high probability of continuation toward the ATH.
However, the price levels 44,440 and 44,344.95 are also acceptable zones from which the move toward 45,082.74 may begin.
At the start of the upcoming week, as soon as the market opens, we are likely to move toward the ATH from one of these three levels.

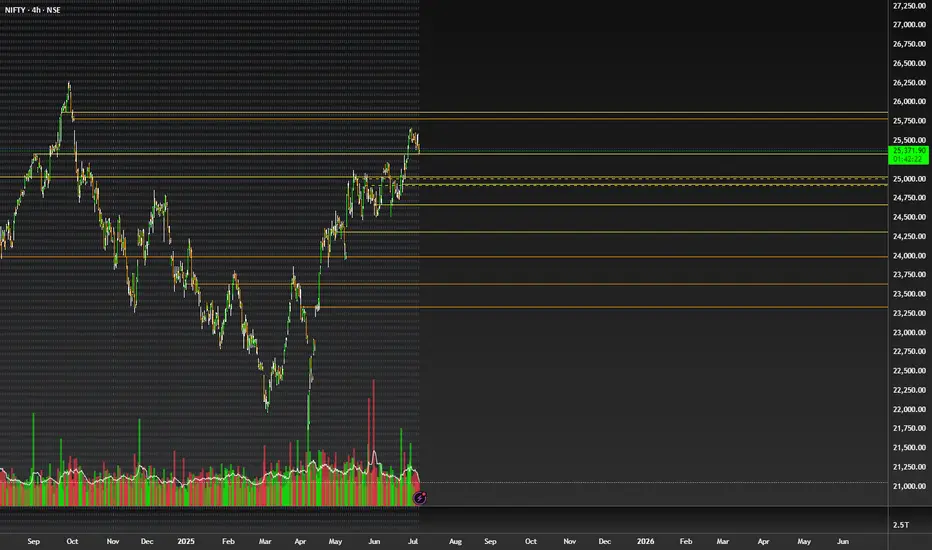
Nifty July 2nd Week AnalysisNifty is looking positive for the upcoming week , and we can expect levels upto 26000 on nifty in the upcoming week . Imp range to watch for upside is 25650-750 .Until then call writers can hamper intraday upside moves. Bulls need to remain cautious of sell on rise until nifty crosses and sustains above 25650-700 range. On the downside imp support zone are 25300-150.
Nifty IT AND RELIANCE WILL BE KEY HIGHLIGHT FOR THE UPSIDE OF NIFTY THIS WEEK.
ALL LEVELS ARE MARKED IN THE CHART POSTED

$NSE:NIFTY is Going to Burst Up Side ! SkyRocketing TIme is NearNSE:NIFTY is Going to Burst Up Side ! SkyRocketing TIme is Near
NIFTY 50 BULLISH REVIEW (My View) 💥
📈 Current Bias: BULLISH
✅ Nifty 50 showing strong resilience above key support levels.
✅ The index is holding well above recent consolidation zones and looks ready for further upside.
✅ Momentum indicators (like RSI) are staying in positive territory, showing sustained strength.
✅ Higher highs & higher lows structure intact on daily chart — bulls in control!
🔑 Key Levels:
👉 Immediate support: 23,333 - (watch for buying interest here)
👉 Resistance ahead: 23,850 - 23,900 (break above = fresh rally potential)
🌟 What I’m Watching:
🚀 Breakout above 23,900 could open doors towards 24,200+ levels in the coming sessions.
🚀 Strong sector participation from banks, IT, and autos — a broad-based rally is a positive sign.
🚀 Keep an eye on global cues + FII activity — may add fuel to the trend.
NSE:NIFTY is Going to Burst Up Side ! SkyRocketing TIme is Near
Banknifty July 2nd Week AnalysisBanknifty is looking neutral for the upcoming week , not looking very action-packed week for Banknifty and it can remain subdued with positive bias. While on the upside, if Banknifty crosses and sustains above 57600, then it can form new all-time highs upto 59000 levels . And on the downside, if Banknifty breaches 56800, then we can expect a small retracement upto 56500-200.
ALL LEVELS ARE MARKED IN THE CHART POSTED.

Defence Index Nifty3 months 50%
Technically Facing a resistance.
Sikka, Data , Taneja ate up 70%+
Idea / Techra / Apollo/ astra / Nibe / High /Rossel / more than 50%
Caution warranted.

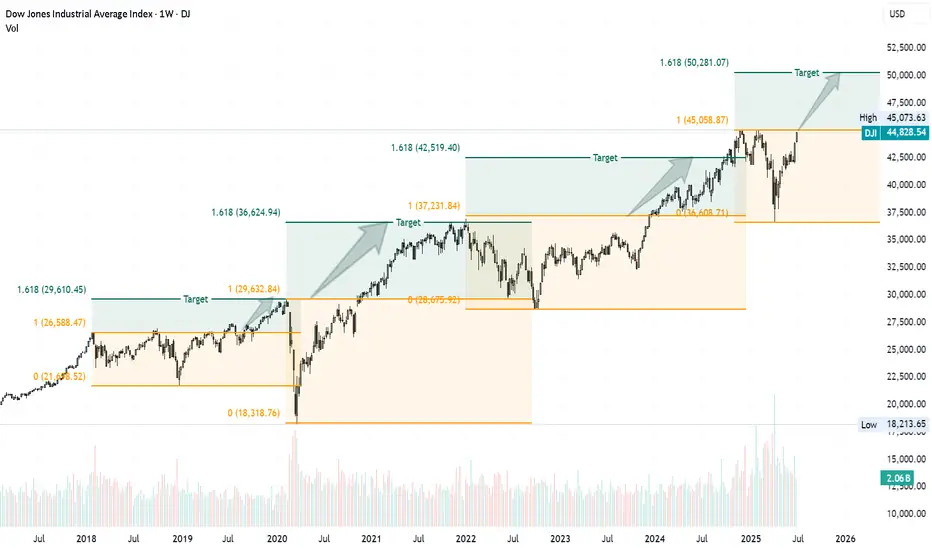
Dow Could Be Gearing Up for a Run Toward 50,000We’ve seen it before—and we might be seeing it again . The Dow Jones is showing a familiar pattern, and here’s what’s happening:
The index has been repeatedly hitting the 1.618 Fibonacci extension from previous ranges.
Right now, we’re approaching the 100% extension between the last swing high (~45,000) and swing low (~36,600).
If the Dow breaks above that previous high at 45,000, there's a good chance we’ll see the pattern repeat—with 50,000 as the next target.
It’s all about that breakout confirmation. Until then, we watch and wait.
This market has a memory—let’s see if it chooses to repeat it again.
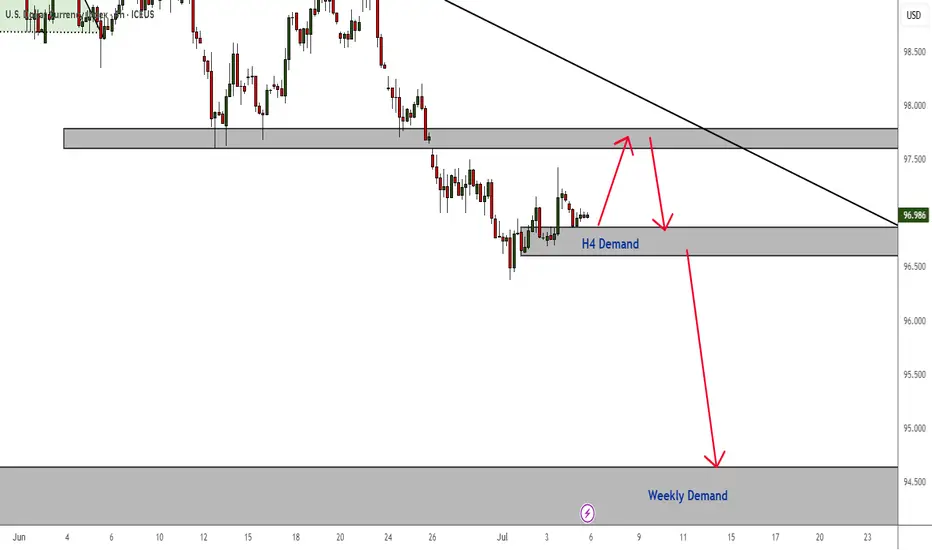
DXY Is Bearish - But A Retest is Highly ProbableThere is no denying that the overall trend is still bearish. However, price is currently respecting an H4 demand zone - which might continue to apply pressure to the upside for a minor correction.
Of course, if this correction does not happen and the H4 demand zone breaks, then we continue to ride the trend to the downside and all the way to the next weekly TF demand zone.
#TheTrendIsYourFriend
Relation between DXY BTC TOTAL#📄 Analysis of three price charts and comparison between dates and movement
◀️ So far, the anticipated rise in alternative currencies has not occurred, and the rise that has happened is considered small and weak since the bottom of 2022
📄 In the first price chart, we see the movement of the US Dollar Index (DXY)
🔽 Each time the index breaks below the 100.00 level, it has a path to test 90.00, and this path has been achieved twice before during the periods of 2017 - 2018 and 2020 - 2021, with each time lasting approximately 320 days
◀️ At the moment we are in, there has been a break below the 100.00 level in DXY, and we are currently on day 84 of this break
⭕️ In the first break between 2017 - 2018, Bitcoin moved up by 2128%, and alternative currencies moved up by 3030%
⭕️ In the second break between 2020 - 2021, Bitcoin moved up by 608%, and alternative currencies moved up by 1668%
⭕️ In the current third break, which is still in its early stages, Bitcoin has moved up by 48%, and alternative currencies have moved up by 23%
⌛️ This period may extend into the first quarter of 2026, and it is essential to monitor developments closely with daily and weekly follow-ups

NIFTY50.....The path is clear! Or?Hello Traders,
the NIFTY50 is bouncing around the resistance level @ 25669 and 25116! Of course, a wide range, but that's the truth! I have labelled the chart as to see, but the pattern is not that clear as it seems!
Chart analysis; details!
The last multi-week low @ 21743 points was labeled as a wave z of 4! Since, the count is arguing a new impulse is underway with targets well above the latest ATH @ 26227! This, of course, is my main count I'm following.
But! The correction, started on September 27th 2024 and last 'til April 7th 2025, can morph into a wave b of a long term correction. The first correction (September to April) in fact was a wave a in this case, the actually one a wave b, with a leg (Wave) c to come. There is no rule how long (in terms of percent) this correction can extend, only a guideline. This one says, the maximum to be allowed is the 1.618 Fibo-Extension of wave a!
Anyway!
The bulls like to see new high's above the latest @ 26277, which is a long way to go. For this idea, it is important not to touch the area of the wave (i) pink @ 25317! If this were the case, the count is no longer valid. Following my interpretation of a "possible" wave b, that extent, the path would be set to a new ATH in the coming 1–2 weeks, 'cause both path tell exact this scenario!
Anyway! We will see how the market will meet the decision in the coming week.
Act with patient and carefully!
Have a great weekend.....
Ruebennase
Please ask or comment as appropriate.
Trade on this analysis at your own risk.

IDX Composite: Bullish in medium term- long termIDX is currently entering wave 2 (correction wave) with a target decline in the range of 6600-6800 (supply zone).
In my opinion, this decline is part of the move towards wave 3 (bullish wave) in the medium term.
Investment strategy:
Gradual collection of bluechip stocks in the banking sector, commodities when the JCI is corrected approaching the supply zone and Collect for a period of 1-1.5 years.
For me, the JCI has just started entering a long-term Bullish wave.

Dummy ideaFastest Way to Create an Idea on TradingView
Here’s a step-by-step guide to quickly publish an idea (analysis, chart, or setup) on TradingView:
1. Prepare Your Chart
• Open TradingView and set up your chart with all desired indicators, drawings, and timeframes.
2. Open the Publish Idea Window
• Shortcut: Press `Alt + P` on your keyboard to instantly open the “Publish Idea” window.
• Or: Click the Publish button at the top-right corner of your chart.
3. Fill Out the Required Fields
• Title: Enter a clear, descriptive title for your idea.
• Description: Write a brief explanation of your analysis or setup.
• Category: Select the appropriate category (e.g., Analysis, Tutorial).
• Direction: Mark your idea as Long, Short, or Neutral.
• Privacy: Choose Public or Private.
• (Optional) Add tags and related ideas for better visibility.
4. Publish
• Confirm you agree to the House Rules.
• Click Publish Idea.
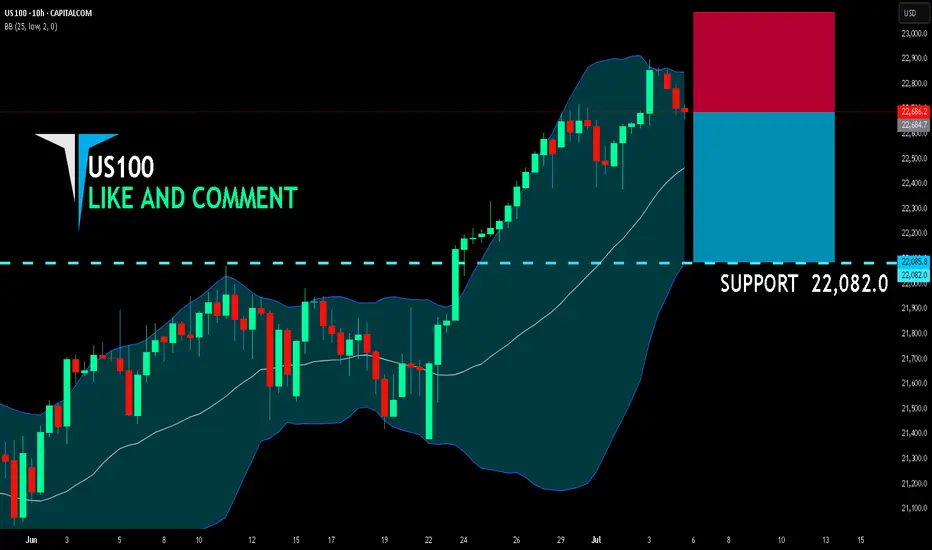
US100 SELLERS WILL DOMINATE THE MARKET|SHORT
US100 SIGNAL
Trade Direction: short
Entry Level: 22,684.7
Target Level: 22,082.0
Stop Loss: 23,085.2
RISK PROFILE
Risk level: medium
Suggested risk: 1%
Timeframe: 10h
Disclosure: I am part of Trade Nation's Influencer program and receive a monthly fee for using their TradingView charts in my analysis.
✅LIKE AND COMMENT MY IDEAS✅
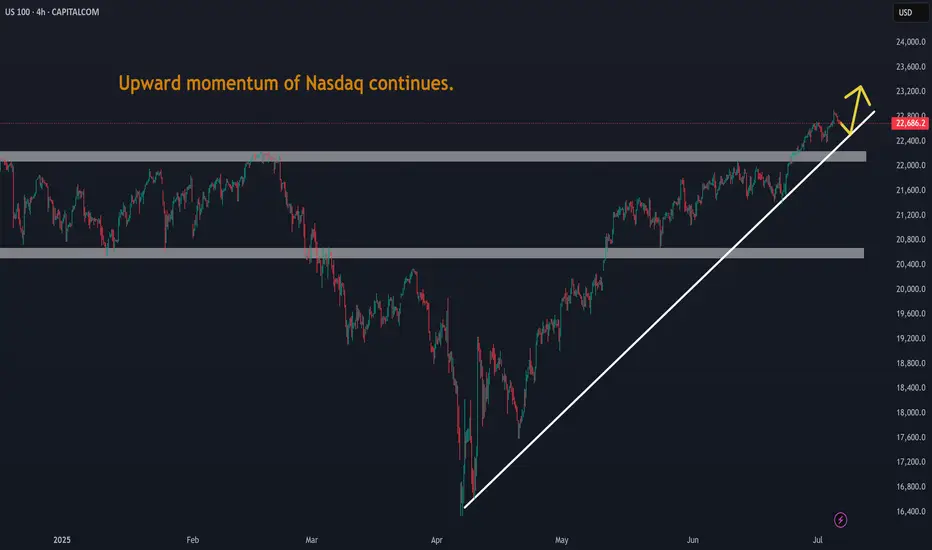
Upward momentum of Nasdaq continues.Upward momentum of Nasdaq continues. Geo-political Tensions cooling down.
Rising Nifty momentum has broken major ResistanceRising Nifty momentum has broken major Resistance and upward momentum may continue.

RenderWithMe | Nifty 50-Forecast Upcoming Week July 7–11,2025
~~NIFTY 50 Analysis for Next Week (July 7–11, 2025)Current Market ContextRecent ~~
Performance: As of July 4, 2025, the NIFTY 50 closed at 25,461, Up 55 points from the previous session, The index has been trading within an ascending channel, with a weekly decline of -0.45% but a monthly gain of 3.67% and a yearly increase of 4.48%.
# Global Cues: Mixed signals from global markets are influencing sentiment. U.S. markets are hitting record highs, while Asian markets like Japan’s Nikkei 225 (+600 points) and Hong Kong’s Hang Seng (-0.42%) show varied trends. Rising oil prices and geopolitical concerns, along with expectations of new U.S. tariff announcements under the Trump policy roadmap, are creating caution.
# Domestic Factors: Strong institutional buying from Domestic Institutional Investors (DIIs) (net buyers of ₹3,036 crore) contrasts with Foreign Institutional Investors (FIIs) being net sellers (₹1,561 crore). This dynamic suggests domestic support but potential headwinds from foreign outflows.
~~ Technical Analysis ~~
Key Levels:Support: Immediate support lies at 25,000–25,150. A break below 25,000 could signal short-term weakness, with further support at 24,982 and 24,622.
Resistance: Resistance is seen at 25,650–25,750, with a strong barrier at 25,690–25,760. A breakout above 25,750 with volume confirmation could push the index toward 26,000 or higher (potentially 28,435).
Trend: The NIFTY is in a positive trend but showing signs of consolidation. Technical indicators like the Relative Strength Index (RSI) at 67.3 suggest upward momentum but caution as it nears overbought territory.
Chart Patterns: A "Cup and Handle" pattern is forming on the daily timeframe, indicating a bullish continuation if the index breaks above 25,655. However, a failure to sustain above 25,400 could lead to a pullback toward 25,320–25,000.
Moving Averages: The index remains above key moving averages (5 DMA: 24,908.6, 10 DMA: 24,934.2, 20 DMA: 24,862.07), reinforcing a bullish bias as long as it holds above 25,338 (daily closing stop-loss).
Sectoral OutlookPositive Sectors: Nifty Metal (+0.23%) and Nifty Pharma (+0.30%) showed gains, suggesting resilience. Banking remains strong, with Bank Nifty hitting a new high of 57,614.50 despite recent profit booking.
Weak Sectors: Nifty IT (-0.01%) and Nifty Financial Services (-0.47%) faced selling pressure, with key constituents like Kotak Bank (-1.96%) and Bajaj Finance (-1.39%) dragging performance.
Focus Areas: Watch banking and pharma for potential leadership, while IT and financials may remain subdued unless buying interest returns.
Key Factors to WatchGlobal Markets: U.S. and Asian market trends, particularly U.S. tariff policies and Federal Reserve rate cut expectations, will influence sentiment.
Macroeconomic Data: Domestic indicators like inflation, GDP revisions, or RBI policy updates could sway the market.
FII/DII Activity: Continued DII buying could offset FII selling, but a reversal in FII flows will be critical for sustained upside.
Geopolitical Risks: Rising oil prices and U.S.–India trade developments may create volatility.
Technical Breakouts: Monitor for a breakout above 25,750 or a breakdown below 25,000 to confirm the next directional move.
Trading StrategyBullish Case: If NIFTY sustains above 25,650, consider buying call options or index futures targeting 25,760–26,000. Use a stop-loss at 25,000.
Bearish Case: If NIFTY falls below 25,000, short positions or put options could target 24,982–24,622, with a stop-loss at 25,450.
Range-Bound: If the index trades between 25,450–25,750, adopt a neutral strategy like selling iron condors to capitalize on low volatility.
Risk Management: Use strict stop-losses and avoid over-leveraging, as volatility is expected due to global and domestic triggers.
Forecast for the WeekExpected Range: 25,000–25,750, with potential for a breakout toward 26,000 if resistance is cleared.
Bias: Sideways to moderately bullish, with risks of profit booking or volatility mid-week.
Probability:Bullish breakout (above 25,750): 40%
Consolidation (25,000–25,750): 50%
Bearish pullback (below 25,000): 10%
Long-Term Outlook (July 2025)Predictions suggest NIFTY could reach 26,055–26,484 by August, with a gradual climb to 28,400 by November 2025, driven by economic growth and sectoral strength. However, these are speculative and depend on sustained bullish momentum.
Disclaimer --
This analysis is based on recent technical data and market sentiment from web sources. It is for informational purposes only and not financial advice. Trading involves high risks, and past performance does not guarantee future results. Always conduct your own research or consult a SEBI-registered advisor before trading.
#Boost and comment will be highly appreciated

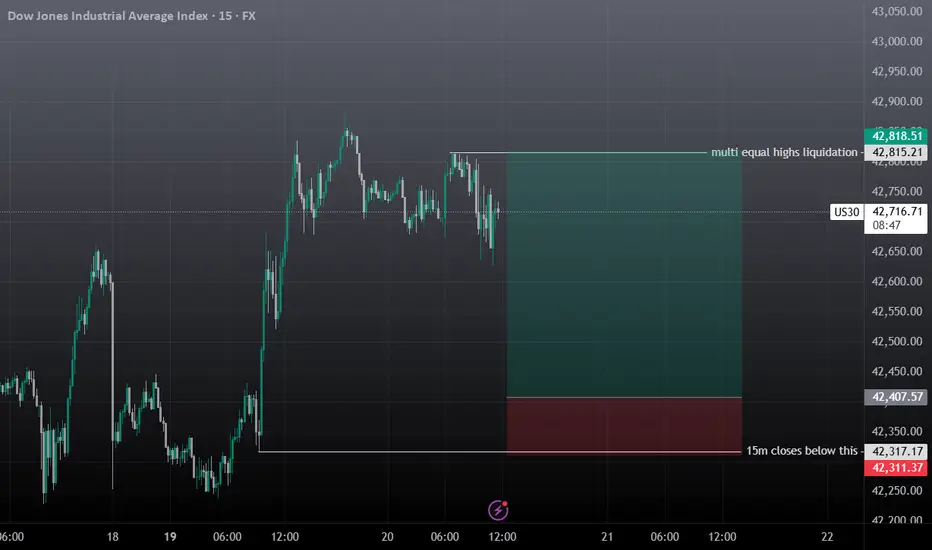
US30 Scalp Buy SetupIf upside liquidation taken first before the entry is achieved then don't take the entry, wait for the entry and set tp & relax.
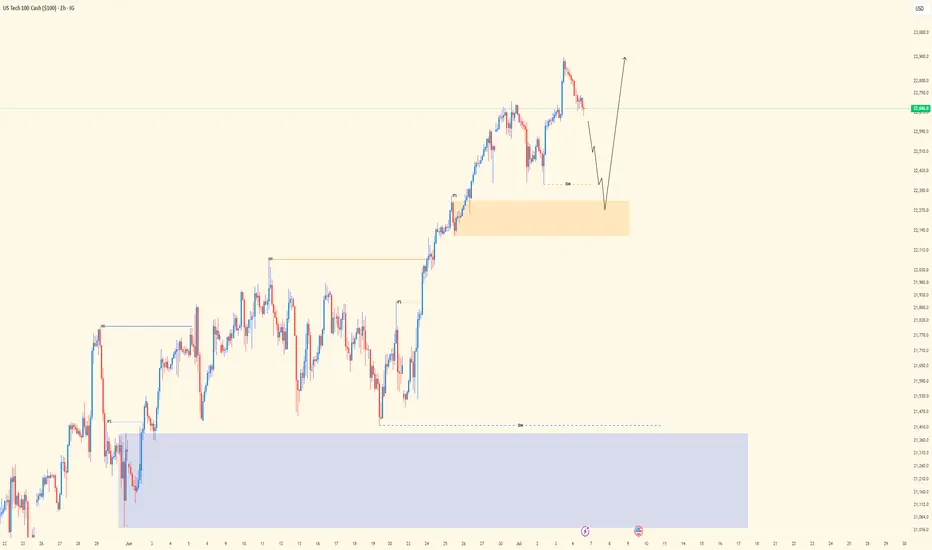
NASDAQ | - Structure Refined | Bullish Intent Into Next WeekPair: NAS100
Bias: Bullish
Timeframes: 4H, 2H, LTFs
• 4H broke structure to the upside with a new HH — clear sign of bullish intent stepping in.
• 2H gives clarity on the move — beginning of the week was messy, but price cleaned up nicely and gave us refined structure to work with.
• Now we wait for mitigation into the OB zone to see if price respects and gives us the setup.
🔹 Entry: After price mitigates OB and confirms with CHoCH on LTFs
🔹 Entry Zone: Marked OB zone — wait for confirmation
🔹 Target: Near structure highs — continuation if bulls step in
Mindset: Messy beginnings don’t mean bad outcomes. Structure eventually reveals the truth — just stay patient and ready.
Bless Trading!
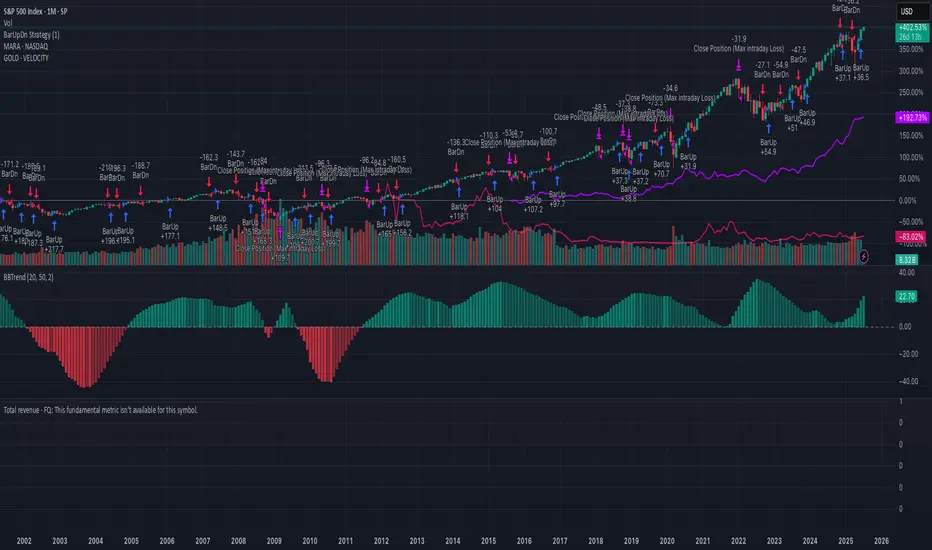
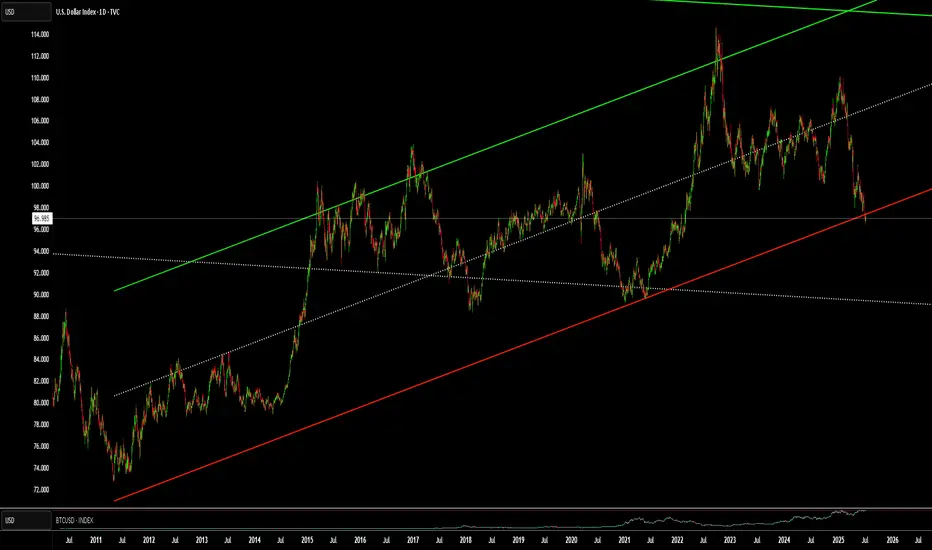
WHy is everyone Freaking out over the DXY !?!?!Here is a chart of the DXY. with a linear regression channel plotted over it. Yes, we are close to the bottom of the channel. But we are no where near an all time low. Far from it. The DXY may be due for a push, but even if it was to drop more it would not be that big of a deal relative to historical patterns.
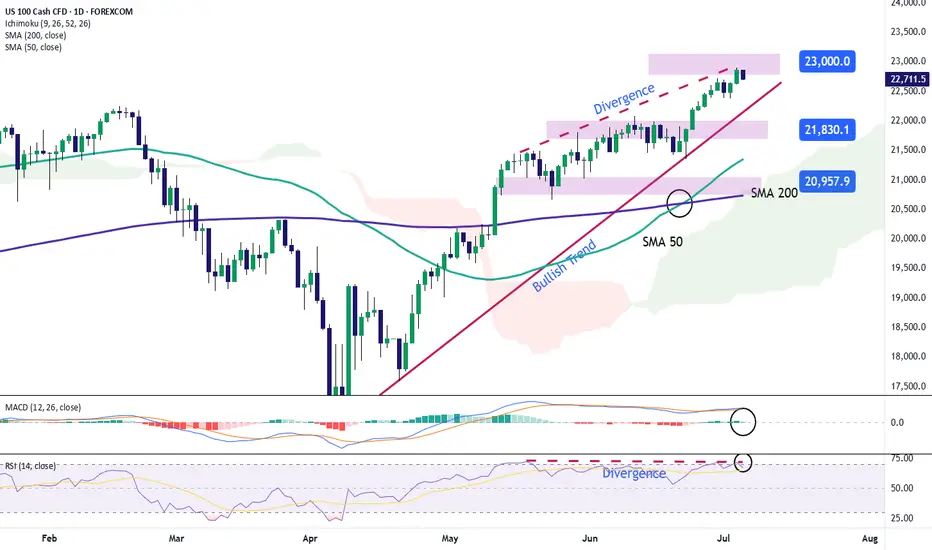
Nasdaq Approaches 23,000 Mark for the First TimeOver the past five trading sessions, the U.S. Nasdaq index has posted a gain of more than 1.5%, supported by a recent rise in market confidence that has pushed the equity index to new all-time highs. The NFP employment data released yesterday surprised markets with 147,000 new jobs, compared to the 111,000 expected, reflecting a recovery in the labor market that could ultimately support domestic consumption in the U.S.. This has helped maintain investor confidence in equities, supporting a bullish bias in the Nasdaq in recent sessions.
Sustained Uptrend
Since the early days of April, the Nasdaq has maintained a solid upward trend, with no relevant signs of selling pressure that would threaten the current bullish structure. As a result, the long-term bias remains clearly bullish within the broader market outlook. However, it's worth noting that a growing sense of indecision has emerged in recent sessions, reflected in the candlestick patterns, which could open the door to short-term bearish corrections.
Technical Indicators
MACD: The MACD histogram continues to hover around the neutral zero line, indicating a balance in moving average strength during recent sessions. If this pattern continues, it may result in a more defined period of price neutrality in the short term.
RSI: The presence of consistent RSI highs, alongside higher price highs in the Nasdaq, has led to the formation of a bearish divergence. This suggests that market equilibrium has been affected by recent bullish momentum, and could lead to price pullbacks in the upcoming sessions.
Key Levels to Watch:
23,000 – Psychological barrier: A tentative resistance level in the short term due to the lack of clear technical references. A breakout above this level could reinforce the current bullish bias and signal a more sustained upward trend.
21,800 – Nearby support: An area aligned with a recent neutral technical zone, which may act as relevant support in the event of a short-term pullback.
21,000 – Key support: A level that coincides with the 50-period simple moving average. A break below this level could put the current bullish structure at risk and pave the way for a more significant downward move.
Written by Julian Pineda, CFA – Market Analyst
NASDAQ 100 TRADING PLAN
⸻
🧠 US100 Multi-Timeframe Playbook
(W1 → D1 → H4 → M30 → M5)
⸻
🔹 Higher Timeframe Context
WEEKLY (Strong Uptrend):
• Key Levels:
– ATH supply: 22,800–23,000
– Support shelf (prior resistance): 22,100–22,200
– 50-SMA: 20,400
– 200-SMA: 16,100
• Summary: Bullish structure is intact as long as price holds above 22,100–22,200 and the long-term trendline.
DAILY (Bullish but stretched):
• Key Levels:
– Upper Bollinger Band: 23,025
– Mid-band & 20-SMA: 22,430
– 50-SMA: 21,985
• Summary: RSI at 66 and MACD > 0 but flattening. This suggests bullish momentum may be cooling — odds of a pause or pullback rising.
4-HOUR (Wedge – Late-Trend Exhaustion Risk):
• Key Levels:
– Rising wedge: upper rail ≈ 23,200, lower ≈ 22,450
– 8-EMA: 22,655 | 21-EMA: 22,425
– Anchored VWAP (from June low): 22,350
• Summary: Ribbon still bullish, but volume and MACD momentum are plateauing. A break below 22,450/VWAP confirms a corrective leg.
30-MINUTE (Neutral to Weak):
• Key Levels:
– Descending micro-trendline: 22,725
– Rising support: 22,690
– Session range: High = 22,845 | Low = 22,690
• Summary: Price is coiled near the apex. EMAs curling downward. Market decision point imminent.
5-MINUTE (Immediate Bear Bias):
• Key Levels:
– Live VWAP: 22,752
– 9-EMA sloping down
– Stochastic: mid-range
• Summary: Price remains below VWAP and 9-EMA. Short-term sellers in control unless VWAP is reclaimed.
⸻
📈 Trade Setups
1. Swing Long – Buy the Dip
• Let price wash through 22,450–22,350 (H4 wedge floor + VWAP zone)
• Enter if:
– 30m bullish engulfing or hammer closes back above 22,450
– AND 5m VWAP is reclaimed
• Initial Stop: Below liquidity sweep or 22,300 – whichever is lower – minus 0.25 × ATR(14, H4) ≈ 30 pts → around 22,270
• Targets:
– T1: 22,845
– T2: 23,200
– Leave runner for blue-sky continuation
• Comment: With weekly trend. Wait for deep retracement. Great RR ≈ 1:3+
⸻
2. Intraday Short – Mean Reversion
• Trigger Zone: 22,725–22,760 (broken trendline + 5m VWAP)
• Enter if:
– 5m rejection wick or bearish engulfing forms on avg+ volume
• Stop: Above 22,800 + buffer (≈ 22,820)
• Targets:
– T1: 22,600
– T2: 22,450
– Optional T3: 22,350 (VWAP)
• Comment: Counter-trend, so treat as scalp. Tight stops. Demand at least 1:2 RR.
⸻
3. Breakout Long – Trend Continuation
• Entry Criteria:
– 30m close above 22,845 with 150%+ average volume
– 5m bull flag holds above breakout level
• Stop:
– First 30m candle close back inside the range
– Or 22,770 (flag base) — whichever happens first
• Targets:
– T1: 23,025 (Daily BB)
– T2: 23,300 (measured move)
• Comment: Only take if strong volume confirms new participation. Avoid during Asia or illiquid hours.
⸻
⚙️ Execution & Risk Guidelines
• Risk per trade: ≤ 1% account (limit counter-trend trades to 0.5%)
• Sizing formula:
Contracts = Account Risk / (Stop pts × $ per pt)
• ATR reference:
– ATR(14, H4) ≈ 120 pts
– ATR(14, 30m) ≈ 80 pts
• Move stop to break-even once price moves 0.75 × stop distance in your favor
• Never run trades #2 and #3 at the same time → directional conflict
• Watch out for macro data (e.g., NFP, CPI) — can override intraday structure
⸻
⏱ What to Watch (In Sequence)
1. Overnight – Does price stay pinned below the 30m 21-EMA, or start to float above it?
2. London Open – First test of the 22,725–22,760 zone: fade or reclaim?
3. NY Open – Volume surge confirms either breakout (#3) or fade setup (#2)
4. End of Day – A close below 22,450 on volume = deeper pullback risk toward 22,000 next week
⸻
🔍 Final Thoughts
The trend is still your friend — but the daily and H4 chart are stretched. Let the trade come to you:
• Buy the flush only if we dip into confluence support and reclaim key levels (#1)
• Buy the breakout only if high volume confirms continuation (#3)
• Everything in-between is a scalp fade (#2) — execute cleanly, with defined risk, and respect trend structure.
This is for educational purposes. Fit these into your system and risk tolerance.
⸻
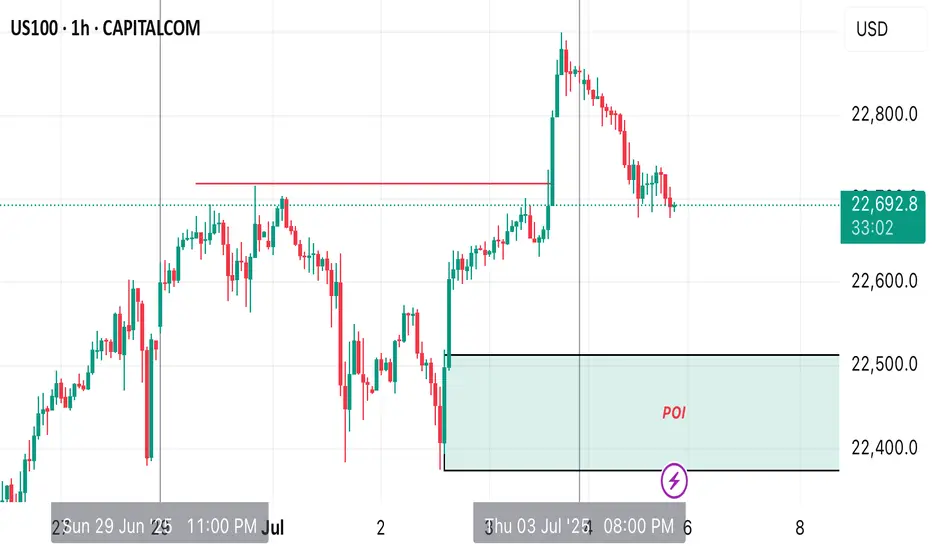
US100 MARKET OUTLOOK - H1Price is strongly bullish in monthly, weekly and daily but we’re currently seeing a retrace in H1 timeframe. we’re going to see price tap into our H1 point of interest .
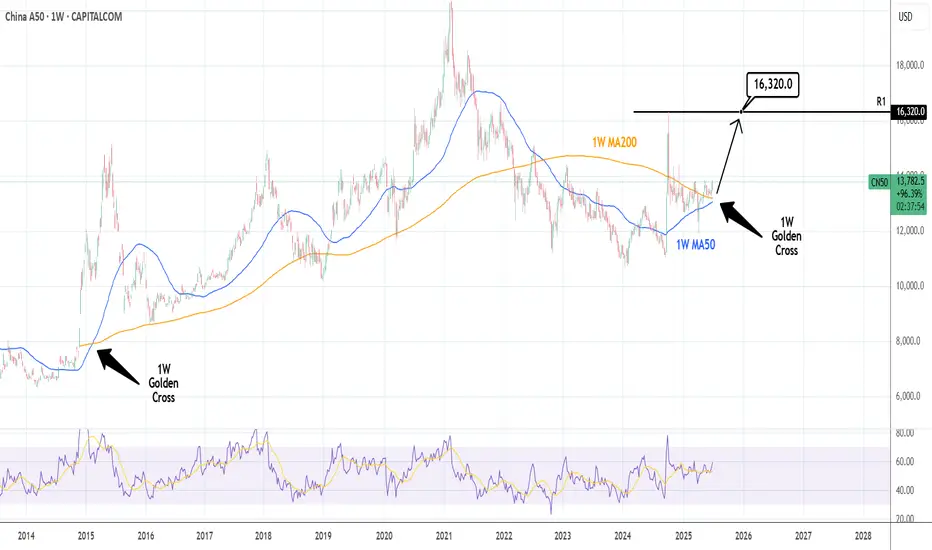
CHINA A50: 1st 1W Golden Cross in 10 years.China A50 is close to making the first 1W Golden Cross in 10 years and the set up couldn't be more bullish after a consolidation of almost a year. The index is far off its ATH but still this Golden Cross can easily make it test the R1 level. Long, TP = 16,320.
## If you like our free content follow our profile to get more daily ideas. ##
## Comments and likes are greatly appreciated. ##