S&P 500 Hit Record High Ahead of Holiday BreakS&P 500 Hit Record High Ahead of Holiday Break
Today, financial markets in the United States are closed in observance of Independence Day. Investor sentiment was likely buoyed by the latest rally in the S&P 500 index (US SPX 500 mini on FXOpen), which set a new all-time high yesterday, surpassing 6,280.
The bullish momentum has been driven by robust labour market data in the US. According to ForexFactory, analysts had anticipated a rise in the unemployment rate from 4.2% to 4.3%, but instead, it unexpectedly declined to 4.1%.
Can the stock market continue to climb?
Technical Analysis of the S&P 500 Chart
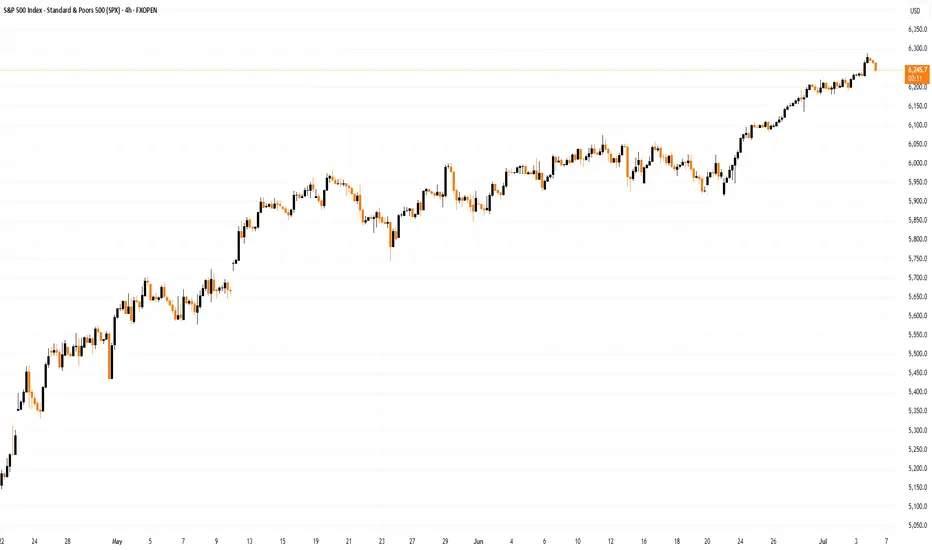
Analysing the 4-hour chart of the S&P 500 index (US SPX 500 mini on FXOpen)on 30 June, we observed the following:
→ An ascending channel was formed (indicated in blue);
→ A developing bullish impulse (marked with an orange line) suggested the price would move towards the upper boundary of the channel – a scenario that materialised with yesterday’s rally (as shown by arrow 1).
However, from a price action perspective, the recent downward move (arrow 2) has now gained significance. It may indicate that sellers are becoming more active around the identified resistance level.
Should the price decline towards the lower orange line, this could negate the current bullish impulse altogether, effectively reflecting a classic bearish engulfing pattern.
Given the above, there is reason to believe that bears are attempting to regain control after the S&P 500 (US SPX 500 mini on FXOpen) surged over 5% in the past 10 days. As such, a potential breakout below the orange line cannot be ruled out, with price action possibly targeting the median of the blue ascending channel.
What happens next?
The market’s trajectory will largely hinge on developments related to tariffs. Trade policy will remain in the spotlight next week, as key deadlines set by the White House approach — events that traders will be closely monitoring.
This article represents the opinion of the Companies operating under the FXOpen brand only. It is not to be construed as an offer, solicitation, or recommendation with respect to products and services provided by the Companies operating under the FXOpen brand, nor is it to be considered financial advice.
Market indices
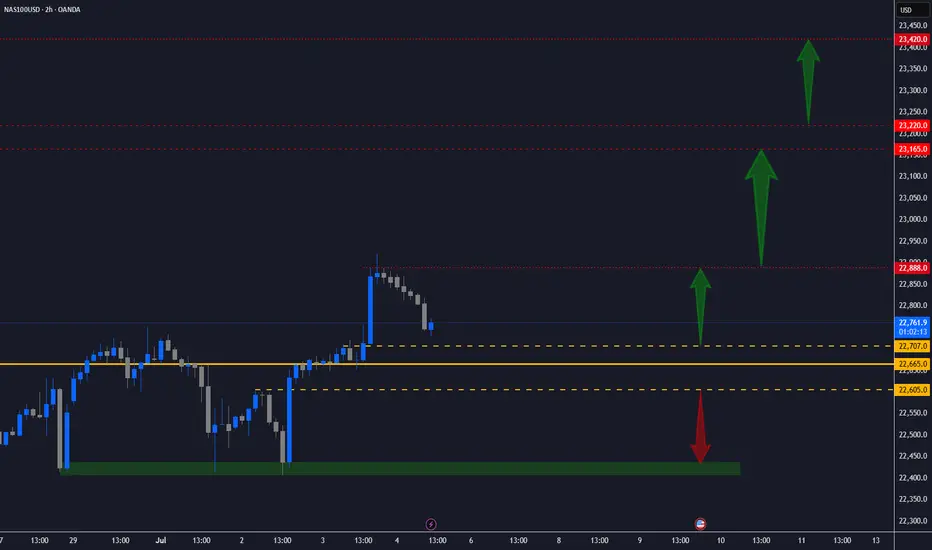
NAS100 UPDATE - Potential Targets Dear Friends in Trading,
How I see it,
Key Support / Pivot @ 22665.00
If key support holds, bullish rally can potentially remain intact
A strong breach below 22605.00, can potentially force
price back to original demand.
I sincerely hope my point of view offers a valued insight.
Thank you for taking the time to study my analysis.
FOLLOW THE TREND The DXY is showing signs of a momentum shift, transitioning into a bullish recoup as Q2 progresses. This shift may signal a change in broader market sentiment, with the dollar seeking strength amidst evolving macroeconomic conditions. Traders should watch for confirmation at key structural levels. follow for more insights , so you can make informed decisions ,comment for opinions , and boost idea
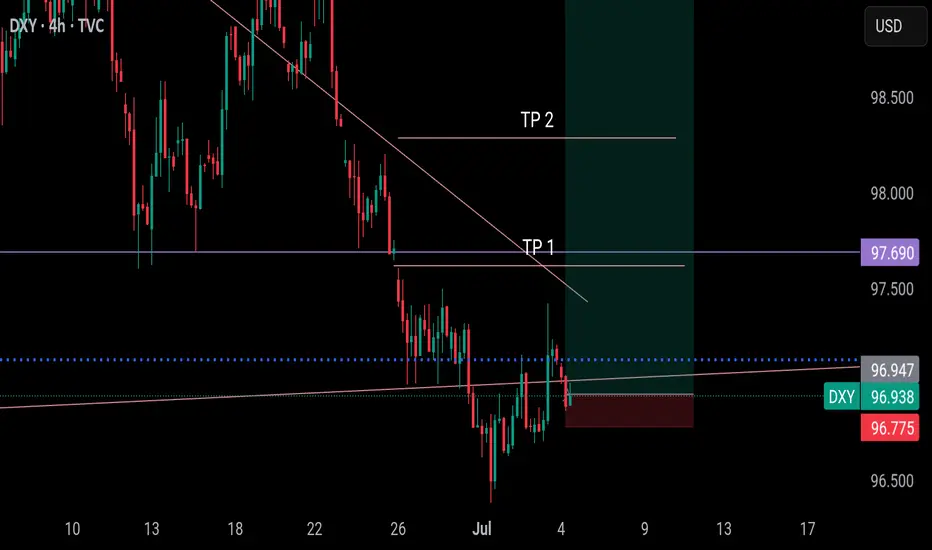
DXY IS BULLISH, SELL EURUSD, GBPUSD, WANNA BET?My last publish about dxy was stopped out but that doesn't invalidate the trade. We will still see a bullish dollar and bearish EURUSD AND GBPUSD.
SL @ 96.775
TP 1 @ 97.620
TP 2 @ 98.285
TP 3 @ 99.420
Use this trade to learn compounding and grow your account. Dont just take 10 pips and run off, once in profit,add more at a discount prices. The TP is certain
Enjoy
Follow me as my trades are market order, so you will see them on time and enter on time.
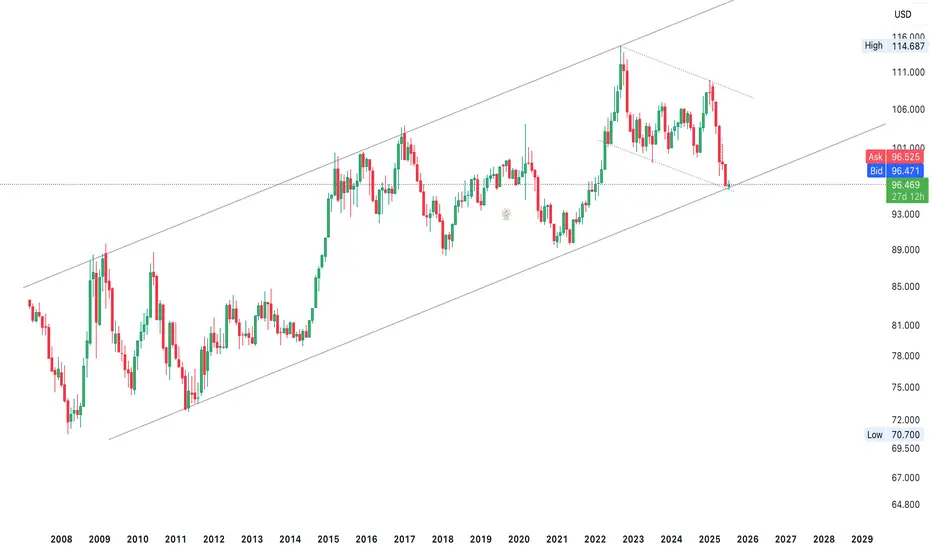
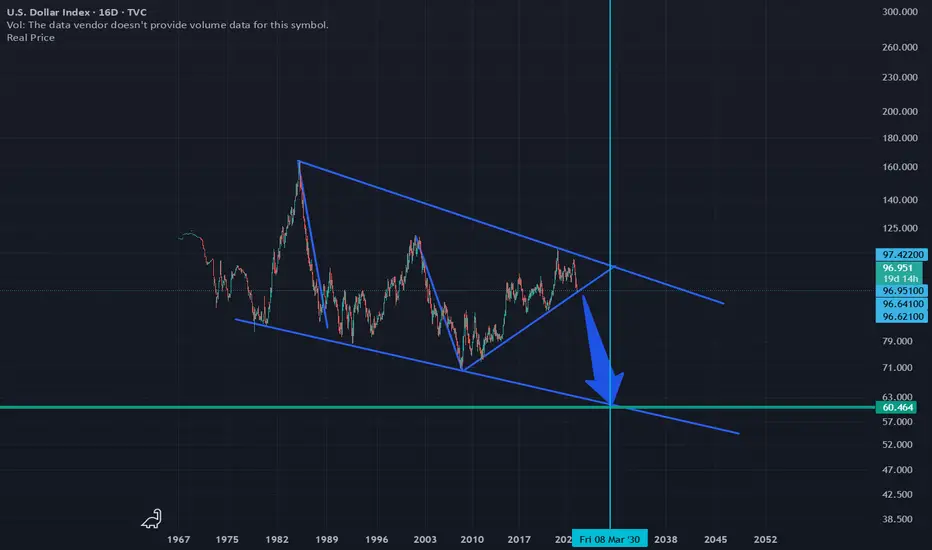
Dollar about to lose 35% of its value in the next 5 yearsDXY testing its last support line before the slide into a steep value crush.
What's another 5 trillion added to the debt anyway? Billionaires need more tax breaks!
#NIFTY 50 Bullish move should continue from hereLongs on #NIFTY50 Bullish OB which supported price earlier too grabber liq from the swing lows.

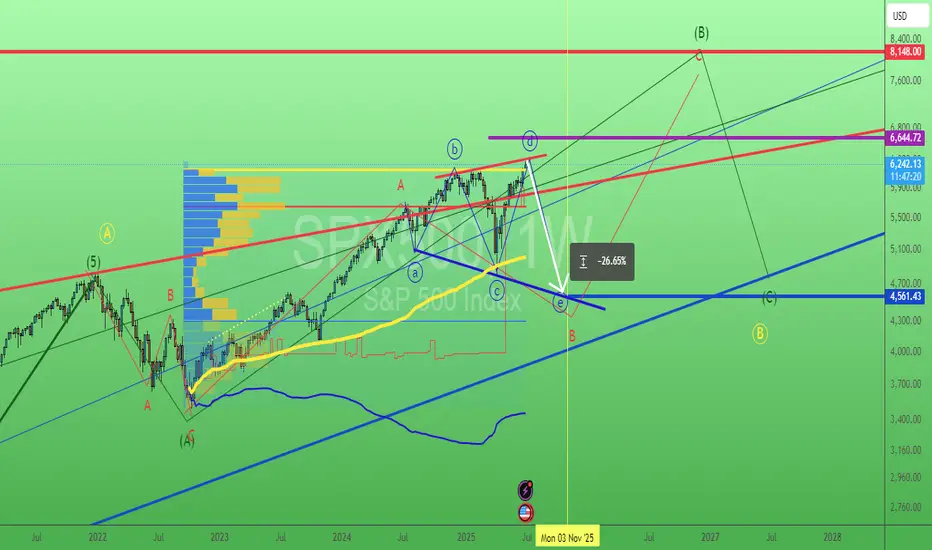
SP500 rock & roll with Trump.. 4/July/25SPX500 breaking ATH again are we in bullish stage? Or again Donald Trump "Inviting" us come to his WWE stage for his favourite "wrestling" games.. Jumping up and down or up side down.( expanding triangle) ......
USDJPY Converges in Triangle Ahead of Potential BreakoutUSDJPY on the daily chart is coiling within a textbook contracting triangle, with support ascending near 143.00 and resistance compressing downward toward 147.00. This symmetrical structure suggests traders are awaiting a decisive catalyst, as volatility has steadily declined alongside rangebound price action.
Recent sessions show USDJPY respecting both its triangle boundaries and key moving averages. The 50- and 100-day SMAs near 145.00 have capped advances, while buyers have consistently defended dips toward 143.00. Price remains inside the triangle’s narrowing apex, hinting that a breakout could be imminent.
Technically, the pair has followed recent divergences between price action and the stochastic oscillator. RSI remains neutral near 49, offering little directional bias, while ATR confirms the tightening range with sharply falling volatility.
If bulls manage to push past 147.00 and the descending trendline, momentum could accelerate toward 149.00. Conversely, a daily close below 143.00 would invalidate triangle support and open the path toward 141.00. Until then, USDJPY may continue oscillating between these boundaries.
Fundamentals now favor the dollar, after stronger-than-expected U.S. jobs data showed 147,000 new positions added in June, beating forecasts. While private hiring slowed, the drop in unemployment to 4.1% supports a cautious Fed, likely delaying a rate cut until at least September. This labor resilience underpins near-term dollar strength.
With sentiment and structure aligning, USDJPY’s breakout from this triangle pattern may shape its next major move. Traders should watch for price and volatility confirmation above 147.00 or below 143.00.

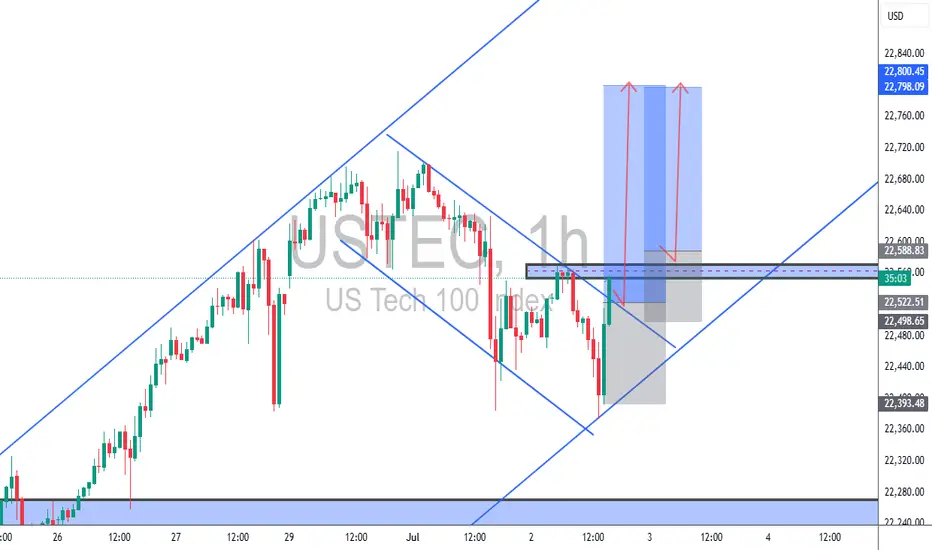
USTEC 15M Trade Setup Analysis (TCB Strategy)📊 USTEC 15M Trade Setup Analysis (TCB Strategy)
Trade Type: Countertrend Breakout -> Continuation
Symbol: USTEC (NASDAQ 100 Index)
Timeframe: 15-Minute
Entry Zone: Around 22,500
Resistance Zone: 22,587.90
Target: 22,865.84
Stop Loss: 22,458.87
Risk–Reward: 1:3 (approx)
Structure: Falling wedge breakout into bullish channel
Setup Confidence Score: 95%
📝 Analyst Notes
Price is breaking out from a well-defined falling wedge within a rising channel. Entry around 22,500 is based on breakout momentum, with SL tucked under structure. A retest entry would offer added confluence. Resistance at 22,587.90 is critical—a break and hold above confirms bullish strength toward the 22,865 target.
🎯 Execution Plan
Option 1: Aggressive entry near 22,500–22,540 (early breakout)
Option 2: Wait for clean retest of wedge breakout or 22,500 zone
Target: 22,865 (upper channel boundary)
SL: 22,458 or below the recent structure low
R:R: ~1:3 — very favorable
🟢 Verdict
This is a high-quality TCB setup, especially if we get a retest confirmation. The bounce off channel support + wedge breakout = excellent confluence.
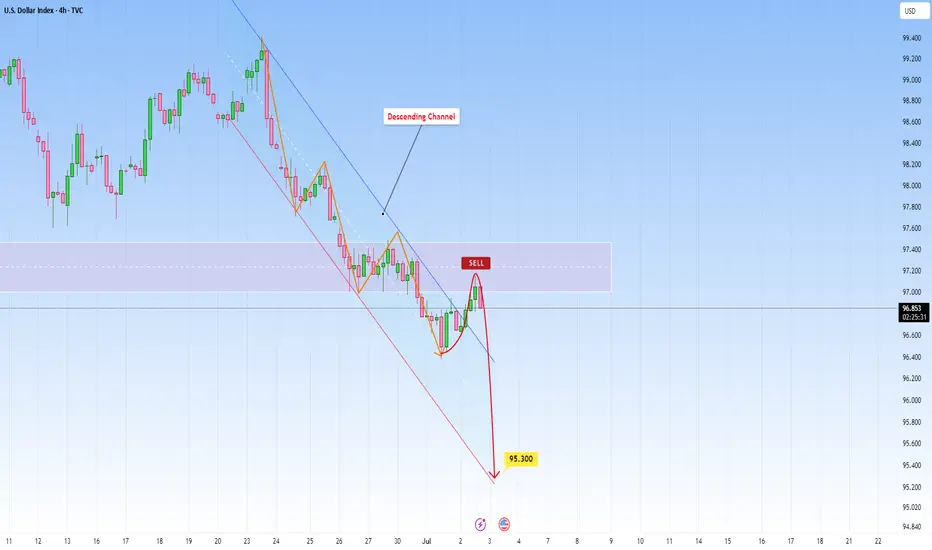
US DOLLAR: Sell opportunity following channel breakPrice on DXY recently broke above a sharp descending channel, but the move lacked presence. There was no real follow-through and certainly no conviction behind the candles. It felt hesitant, as this is a great indication for us to use.
Instead of accelerating upward, price now hovers just above the breakout, this kind of behavior suggests rather a random push than a shift in sentiment. Without the strength to sustain above structure, I think we will see the price come back to the channel's lower border.
And when breakouts fail, they often trap early longs, preparing for a more committed move in the opposite direction.
A rejection from this level could send price into the 0.85800 level.
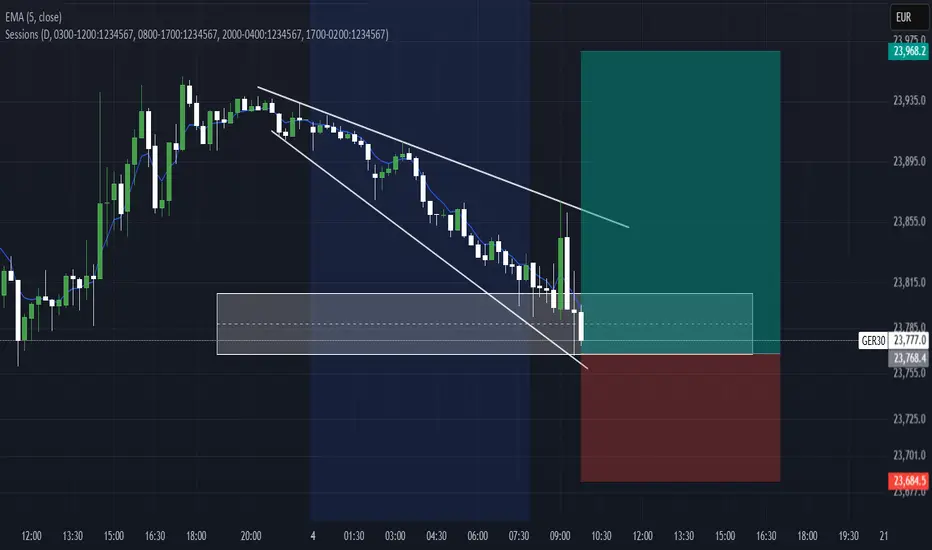
German30The Asian session traded fairly low today looking to target yesterdays low however we are forming a bullish flag pattern indicating that we will continue the uptrend.
We will take advantage of this opportunity and look to target 200 pips on this setup. Remember to always trade cautiously and like and subscriber for more A+ setups
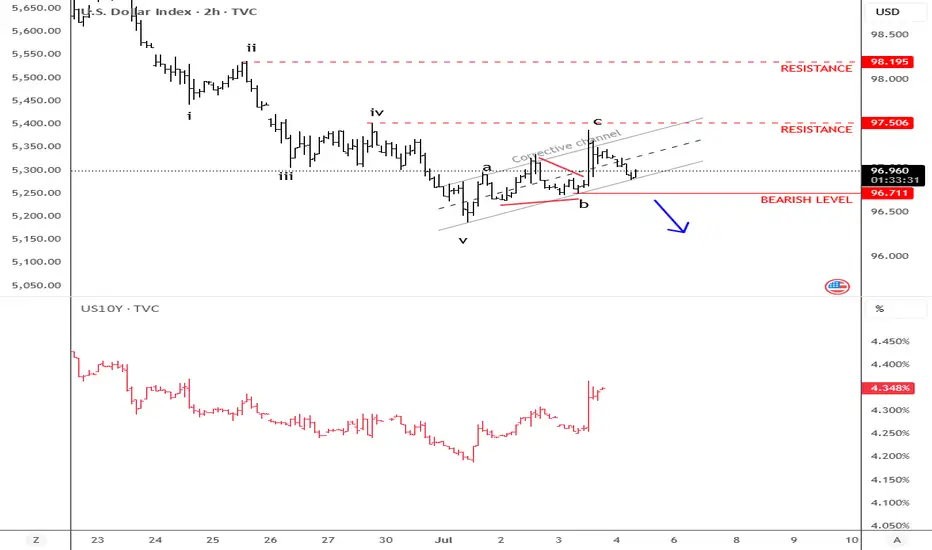
Dollar Testing The Channel Support It’s already Friday and the 4th of July, so US holidays are here, which means we could see thinner trading conditions later today. Still, the overall tone remains risk-on since yesterday, supported by better-than-expected Non-Farm Payrolls data and an ISM services reading at 50.8—still in expansion territory. So, there’s some optimism in the market, and this could continue if we get a positive outcome on the tariff front ahead of the July 9th deadline.
On the back of strong economic data, US yields are moving higher, but the Dollar Index is trying to come lower. It’s currently retesting the lower trendline of a corrective channel—likely due to the strong rally in US stock indexes, which are keeping the dollar under pressure.
On the daily chart, the Dollar Index still looks like it could head to new lows, but that move may not come today if holiday conditions slow down the market. We might have to wait until next week for a clearer breakout.
GH
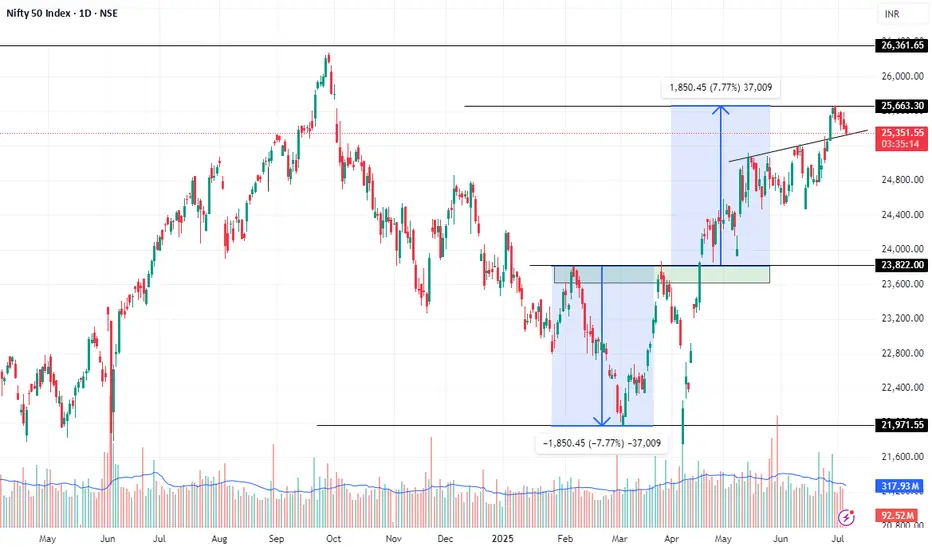
NIFTY 1st TGT is doneNifty initial v - pattern TGT is achieved as shown in chart
base 21971
breakout @ 23822
tgt @ 25663
Whats next ? will be posting shortly with time cycle and price cycle.
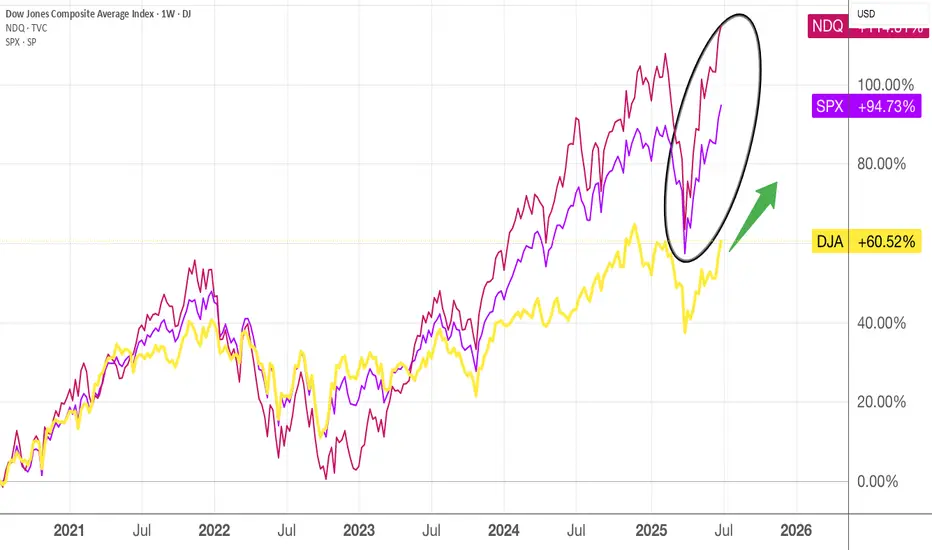
Diversification - spread your eggs into different basketsSo we have seen the DJA basket of stocks rallying of late and I believe this trend will continue , considering they are laggards compared to SPX and NDQ.
When the tech stocks retrace (look at the parabolic rally ), the DJA stocks should be climbing its due rally.
This is how I diversify my risk portfolio, though 80% of the profits are still made in the tech stocks. The healthcare, consumer durables types of stocks are more slow and steady growth, giving some decent dividends as well.
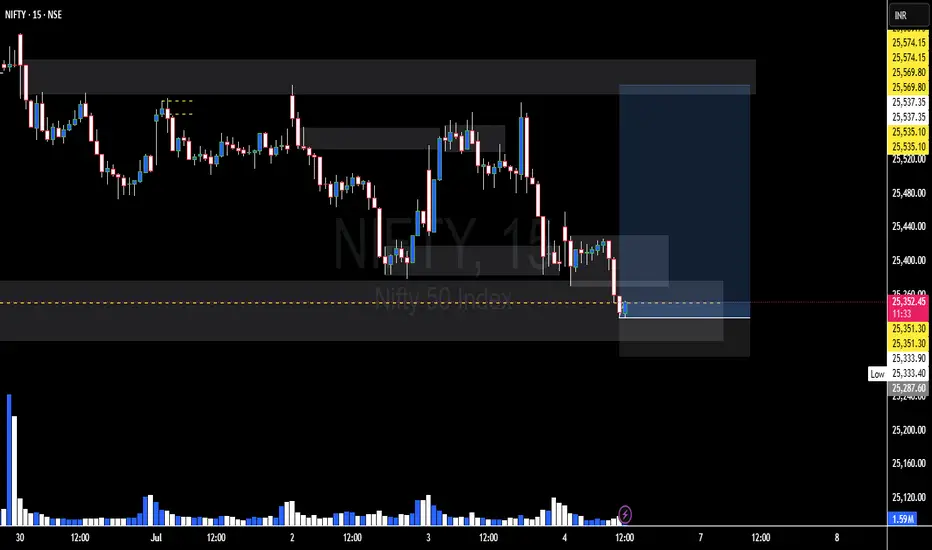
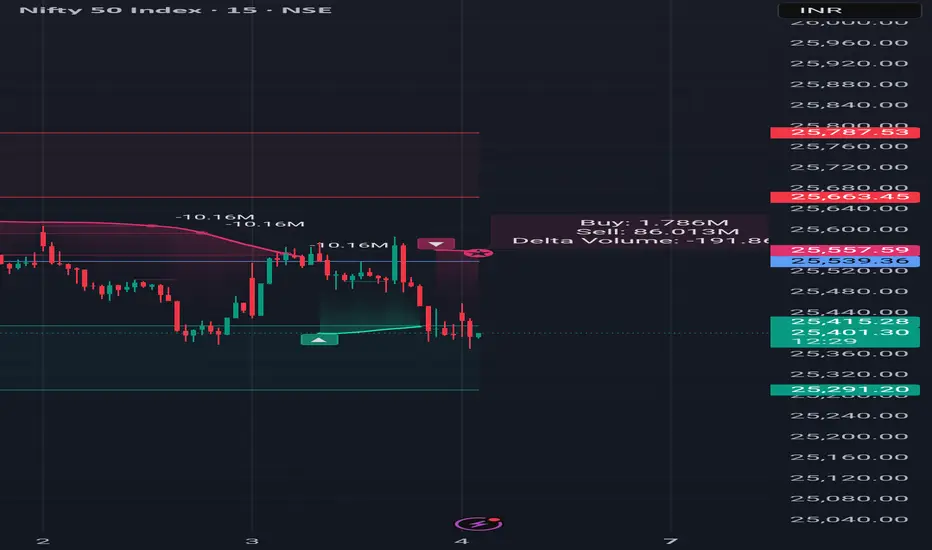
Nifty in Volatile Range#NIFTY FUT– 25,508.0
S1 – 25,395.0
S2 – 25,348.0
R1 – 25,658.0
R2 – 25,718.0
Doji formation has seen post Red
candle with inline volume,
indicates consolidation on daily
chart. Nifty has closed above 7, 14
and 21 DMA that seen at 25487,
25337 and 25222 levels. Nifty
future has resistance at 25658
levels while support seen at 25395
level..
More support and Resistance Show in chart...
All information Education Purpose only
India vs ChinaYear to date, NIFTY has underperformed China - but not recently. Nifty outperformed HSCEI by nearly 20% pts between mid-Mar to mid-Apr and the over the last 2 months, gave back nearly half of these gains! What happened next?
The pullback appears to be a "flag" pattern - typically a bullish continuation - if this breakout holds (stays above 2.9 for NIFTY/HSCEI), Then the measuring implication is a whopping 3.5 - an outperformance of 18-20% pts.
Long Nifty/ HSCEI, currently ay 2.95; stops at 2.85

#NIFTY Intraday Support and Resistance Levels - 04/07/2025Nifty is expected to open with a gap-up near the 25500 zone. This places it right around the consolidation zone seen in the previous sessions, between 25400 and 25550. If Nifty sustains above 25550, it may trigger a fresh upward move with immediate targets at 25600, 25650, and potentially 25750+. This breakout level should be watched closely for bullish confirmation before entering long positions.
However, if the index fails to hold above the consolidation zone and slips below 25400, it could open the door for a downside move. A short opportunity may arise below 25400, targeting levels at 25350, 25300, and 25250. This would indicate a breakdown from the consolidation and suggest renewed selling pressure.
Traders should remain cautious within the consolidation range and act only on confirmed breakout or breakdown levels.

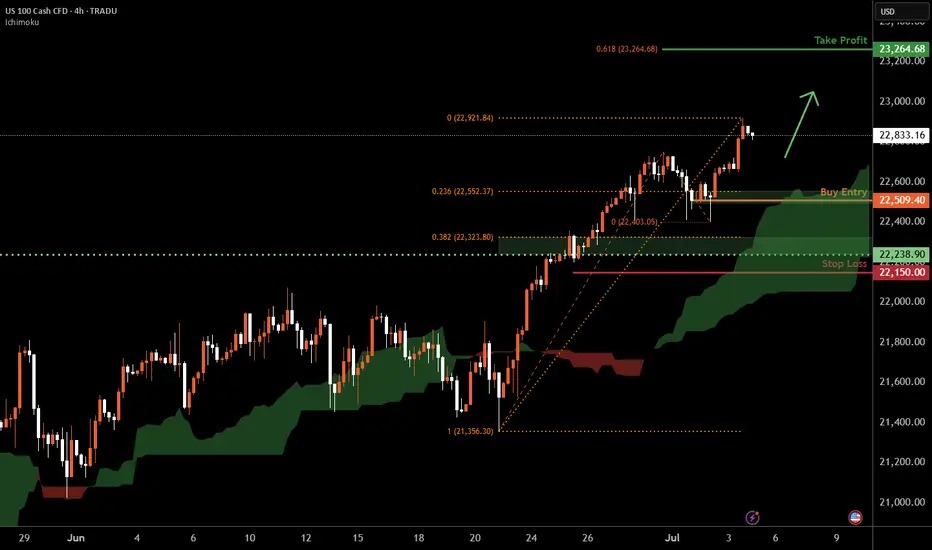
Nasdaq-100 H4 | Bullish uptrend to extend higher?The Nasdaq-100 (NAS100) is falling towards a swing-low support and could potentially bounce off this level to climb higher.
Buy entry is at 22,509.40 which is a swing-low support that aligns closely with the 23.6% Fibonacci retracement.
Stop loss is at 22,150.00 which is a level that lies underneath an overlap support and the 38.2% Fibonacci retracement.
Take profit is at 23,264.68 which is a resistance that aligns with the 61.8% Fibonacci projection.
High Risk Investment Warning
Trading Forex/CFDs on margin carries a high level of risk and may not be suitable for all investors. Leverage can work against you.
Stratos Markets Limited (tradu.com ):
CFDs are complex instruments and come with a high risk of losing money rapidly due to leverage. 63% of retail investor accounts lose money when trading CFDs with this provider. You should consider whether you understand how CFDs work and whether you can afford to take the high risk of losing your money.
Stratos Europe Ltd (tradu.com ):
CFDs are complex instruments and come with a high risk of losing money rapidly due to leverage. 63% of retail investor accounts lose money when trading CFDs with this provider. You should consider whether you understand how CFDs work and whether you can afford to take the high risk of losing your money.
Stratos Global LLC (tradu.com ):
Losses can exceed deposits.
Please be advised that the information presented on TradingView is provided to Tradu (‘Company’, ‘we’) by a third-party provider (‘TFA Global Pte Ltd’). Please be reminded that you are solely responsible for the trading decisions on your account. There is a very high degree of risk involved in trading. Any information and/or content is intended entirely for research, educational and informational purposes only and does not constitute investment or consultation advice or investment strategy. The information is not tailored to the investment needs of any specific person and therefore does not involve a consideration of any of the investment objectives, financial situation or needs of any viewer that may receive it. Kindly also note that past performance is not a reliable indicator of future results. Actual results may differ materially from those anticipated in forward-looking or past performance statements. We assume no liability as to the accuracy or completeness of any of the information and/or content provided herein and the Company cannot be held responsible for any omission, mistake nor for any loss or damage including without limitation to any loss of profit which may arise from reliance on any information supplied by TFA Global Pte Ltd.
The speaker(s) is neither an employee, agent nor representative of Tradu and is therefore acting independently. The opinions given are their own, constitute general market commentary, and do not constitute the opinion or advice of Tradu or any form of personal or investment advice. Tradu neither endorses nor guarantees offerings of third-party speakers, nor is Tradu responsible for the content, veracity or opinions of third-party speakers, presenters or participants.
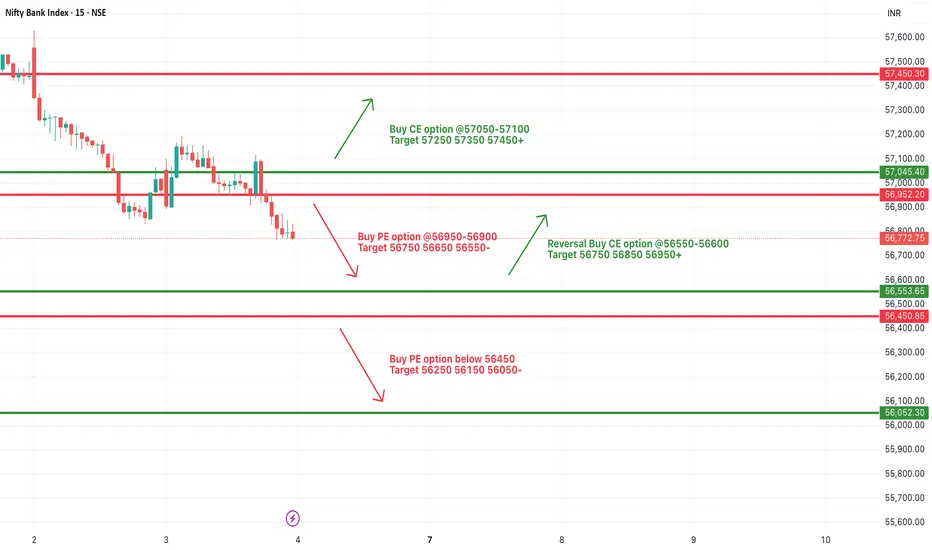
[INTRADAY] #BANKNIFTY PE & CE Levels(04/07/2025)Bank Nifty will open with a gap-up near the 56950 zone, placing it close to an immediate resistance area. If the index sustains above the 57050–57100 level, it indicates bullish strength and could trigger a further upward move toward 57250, 57350, and potentially 57450+. This level acts as a breakout zone for upside momentum. On the other hand, if the price faces resistance around 56950–57000 and starts reversing, a short opportunity opens below 56950–56900, with targets placed at 56750, 56650, and 56550.
In case Bank Nifty falls further and breaches the 56450 mark, it may signal a strong breakdown and continuation of the downtrend, leading to lower targets around 56250, 56150, and 56050. However, if the index takes support at the 56650–56600 zone and shows signs of reversal, it can provide a buying opportunity for a bounce back toward 56750, 56850, and 56950.
Overall, the day’s strategy should be reactive to these key levels, with trades initiated only upon proper price action confirmation. Use trailing stop-loss to protect profits and exit partially at key target levels.
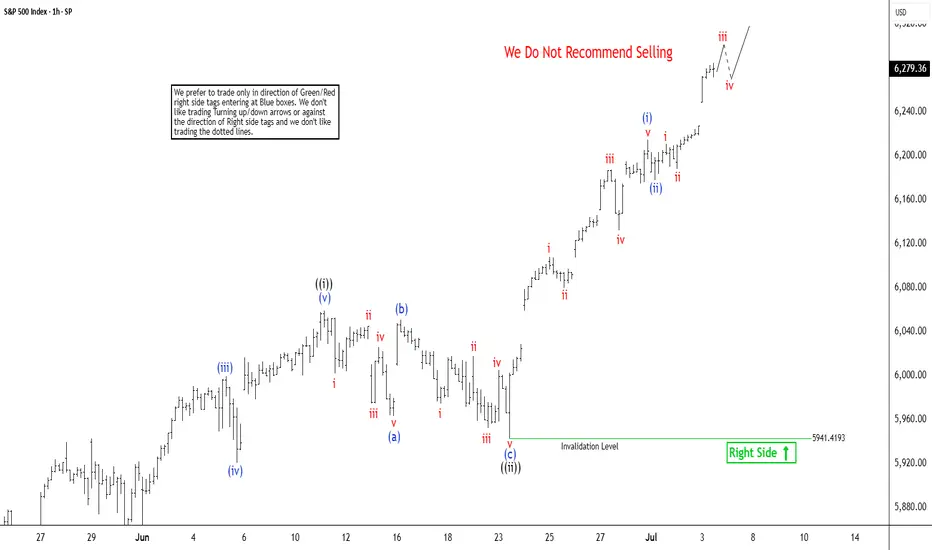
S&P 500 ($SPX) Nests Upward in Strong RallySince bottoming out on April 7, 2025, following the tariff war selloff, the S&P 500 (SPX) has sustained a robust rally. The Index is reaching new all-time highs in a clear Elliott Wave impulsive structure. Technical analysis, particularly momentum indicators like the Relative Strength Index (RSI), shows no divergence at the latest peak. This indicates sustained bullish momentum and suggests the rally remains within the third wave of the Elliott Wave sequence. From the April 7 low, wave 1 concluded at 5968.6. A corrective wave 2 followed which ended at 5767.41. The index has since nested higher within wave 3, demonstrating strong upward momentum.
Breaking down the substructure of wave 3, the hourly chart below reveals that wave ((i)) peaked at 6059.4. The subsequent pullback in wave ((ii)) unfolded as a zigzag pattern. Wave (a) declined to 5963.21, and wave (b) rebounded to 6050.83. Wave (c) concluded at 5941.4, completing wave ((ii)) in the higher degree. The index has since resumed its ascent in wave ((iii)). Up from wave ((ii)), wave (i) reached 215.08 and a minor pullback in wave (ii) ended at 6177.97.
The SPX is expected to continue its upward trajectory, with potential pullbacks finding support in a 3, 7, or 11 swing against the 5941.4 level, setting the stage for further gains. This analysis underscores the index’s bullish outlook, supported by technical indicators and Elliott Wave structure, as it navigates higher within this impulsive cycle.
Weekly Volatility SnapshotGood Morning -- ☀️☀️☀️
What an amazing last full week of June that was as we pulled out of corrective territory and onto new ATHs with the SP:SPX body of its weekly candle moving +3.41% -- bottom to top. The weekly move open-to-close was +$98.40 as that is how I gauge my volatility metrics. This in comparison is closest in value to IV entering the week as it was stating an implied move of +/-$102.08, which was a volatility read of 16.34% -- As you see in reflection of the weekly chart below and within daily candle structure, price action moved upwards all week surpassing quarterly marks. This in turn is raising short-term volatility and lowering monthly averages as we rotate higher.
Here is the weekly price action of the TVC:VIX from a 5m perspective. This is showing the EOW trend break upwards drilling the indices back down -- A healthy pullback after being seemingly over-extended. This happened during the news cycle release of the U.S. and Canada reciprocal tariff disagreement. Hopefully this settles over the weekend and we rotate higher into the 4th of July week.
Now looking towards this holiday week -- We have the SP:SPX IV (13.29%) after melting during the ATHs move previously -3.09% -- This places IV on the sliding yearly spectrum at the 39% down range showing increasing discount in yearly value. Remember, If you form option positions IV affects VEGA 1% at a time and the algos bid down IV in contracting markets as they rotate higher. HV10 (12.46%) has hinged down and still is contractive per IV prediction but, increasing in comparison with a ' strength of IV ' now showing 94% entering this week.
As the TVC:VIX has closed at $16.32 -- I believe that there is still a little room to extend potentially upwards to the HV10 weekly range of $6253.59. Currently, the SP:SPX YTD return is +4.96% with weekly momentum pointing up and room for volatility to still decrease. If this mark is reached it would put the YTD return at +6.52%. Very feasible and realistic being halfway through the year and going into the 4th of July 🇺🇸🇺🇸🇺🇸🇺🇸 Watch as we climb the wall of worries around us. This would in turn decrease short-term volatility more maybe even to a bottoming point and IV would melt during the rotation upwards with the VIX slowly grinding down.
Come back next week as we review what happened within the implied ranges posted and overlook the volatility potentially bottoming and looking towards a VIX spike in the near future.
Remember to know your ABCs and stay hedged against your bias! CHEERS!

Dow Jones (DJI) Logarithmic Macro Outlook Log target: 48k
The dotted red line is adjusted for inflation. The stock market cycles are lengthening. Continued downside till EOM followed by a final melt-up rally that will bring the end of grand wave 5.
ETA: Q1 '23.
