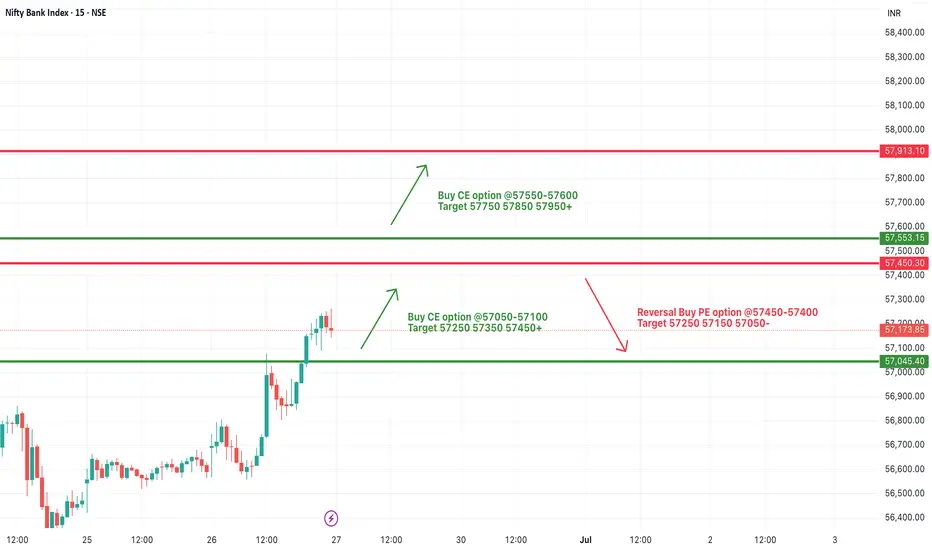
[INTRADAY] #BANKNIFTY PE & CE Levels(27/06/2025)Bank Nifty is expected to open with a strong gap up near the 57,500 level, indicating continued bullish sentiment from the previous session’s upward momentum. The index is currently trading above key support levels, and if it manages to sustain above the 57,450–57,500 zone, a further upward move is likely. In such a case, traders can consider buying CE options around 57,550–57,600 for targets of 57,750, 57,850, and 57,950+. This zone will act as a potential breakout area, and sustaining above it could trigger fresh buying interest.
However, if Bank Nifty fails to hold above the 57,450 level after the gap up, some profit booking or reversal may occur. In that scenario, a put option opportunity may arise near the 57,450–57,400 levels with downside targets of 57,250, 57,150, and 57,050.
Market indices
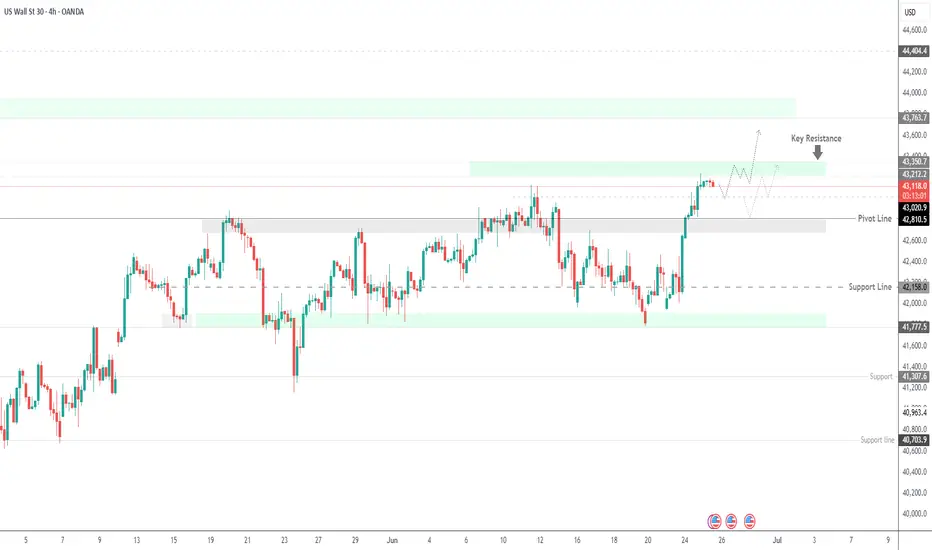
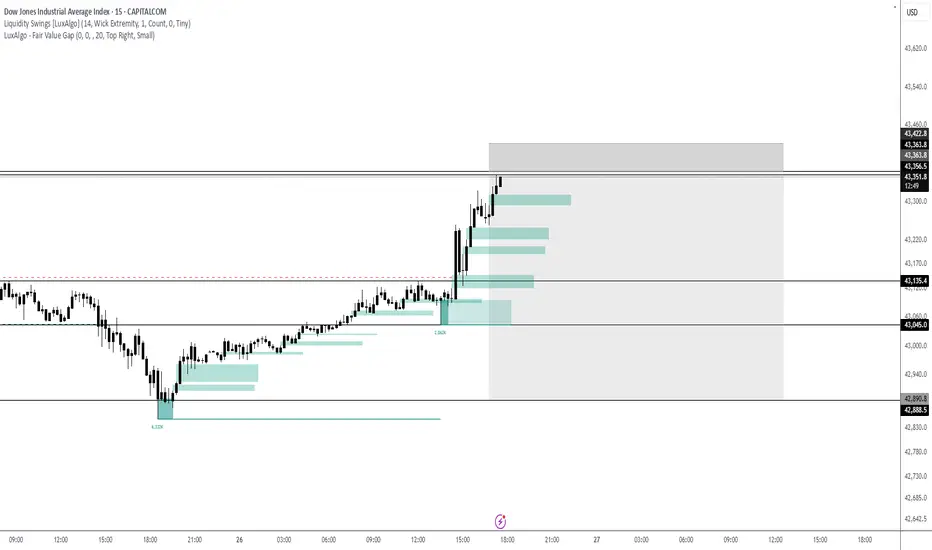
Dow Jones Retesting 43,020 | Bullish Bias Intact Above 42,810US30 OVERVIEW
Dow Jones Holds Bullish Momentum | Eyes on Retest and Continuation
US30 (Dow Jones) remains under bullish pressure, supported by recent macro developments and improving sentiment.
The price appears to be forming a retest toward 43,020, which could act as a springboard for further upside.
As long as the index trades above 42,810, the bullish trend remains intact, targeting 43,350, and potentially 43,765.
However, a confirmed break below 42,810 would shift the outlook to bearish in the short term.
Resistance Levels: 43,350 → 43,765
Support Levels: 43,020 → 42,810
Previous idea:
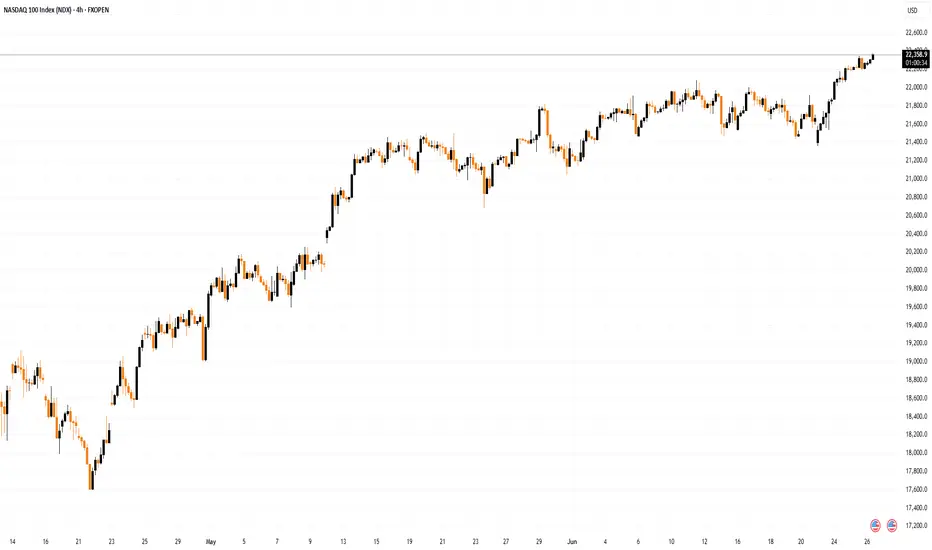
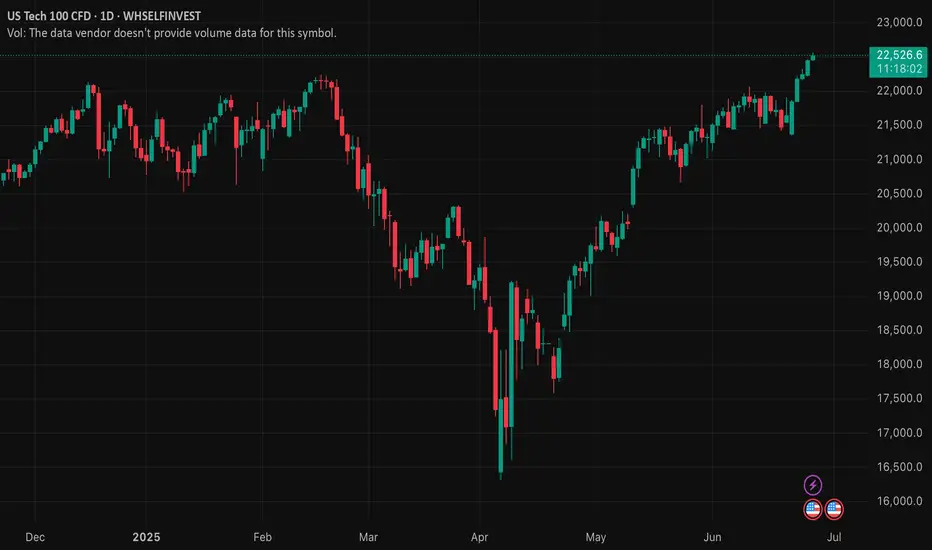
Nasdaq 100: A New All-Time HighNasdaq 100: A New All-Time High
As shown on the Nasdaq 100 chart (US Tech 100 mini on FXOpen), the value of the technology stock index has risen above its February peak, setting a new historical high.
Bullish sentiment may be supported by:
→ Easing concerns over potential US involvement in a Middle East war, as the ceasefire between Israel and Iran remains in effect.
→ Media reports suggesting that Donald Trump is considering replacing Federal Reserve Chair Jerome Powell by September or October, in an effort to influence a rate cut that could accelerate economic growth (though this also raises the risk of a new inflationary wave).
Technical Analysis of the Nasdaq 100 Chart
Price fluctuations in May and June have formed an ascending channel (highlighted in blue), with the following observations:
→ The decline (marked by red lines) appears to be an interim correction forming a bullish flag pattern;
→ The 22K level, which acted as resistance mid-month, was breached by a strong bullish impulse (indicated by the arrow) from the week's low.
This leaves the market vulnerable to a potential correction, which seems possible given:
→ Proximity to the upper boundary of the ascending channel;
→ Overbought conditions indicated by the RSI.
If the market corrects, a retest of the 22K level may happen.
This article represents the opinion of the Companies operating under the FXOpen brand only. It is not to be construed as an offer, solicitation, or recommendation with respect to products and services provided by the Companies operating under the FXOpen brand, nor is it to be considered financial advice.
52 W hi Capitalize on the around-the-clock liquidity of S&P 500 futures , and take advantage of one of the most efficient and cost-effective ways to gain market exposure to a broad-based, capitalization-weighted index that tracks 500 of the largest companies of the US economy
they'll losing they pants. we're selling gang
!!!!!!!!! Lol
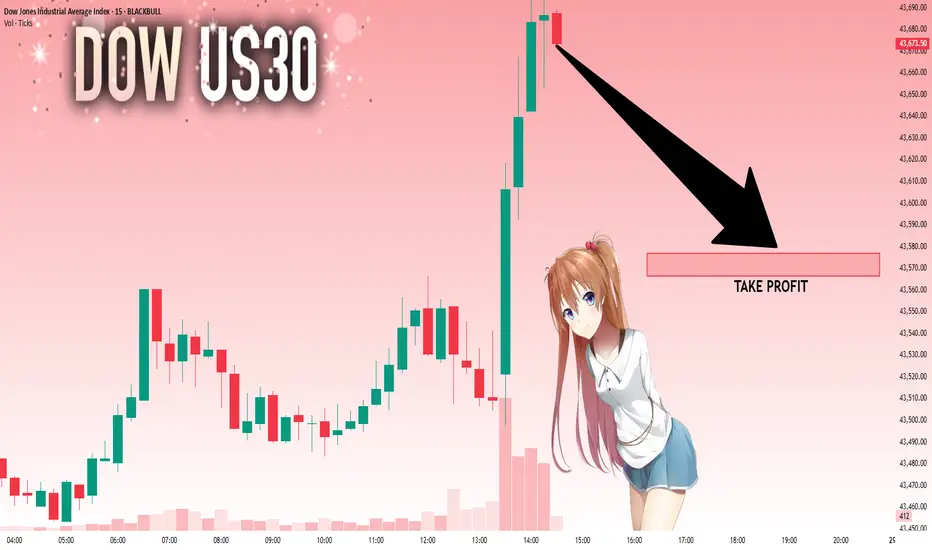
US30: Local Bearish Bias! Short!
My dear friends,
Today we will analyse GOLD together☺️
The price is near a wide key level
and the pair is approaching a significant decision level of 43,673.57 Therefore, a strong bearish reaction here could determine the next move down.We will watch for a confirmation candle, and then target the next key level of 43,576.88..Recommend Stop-loss is beyond the current level.
❤️Sending you lots of Love and Hugs❤️
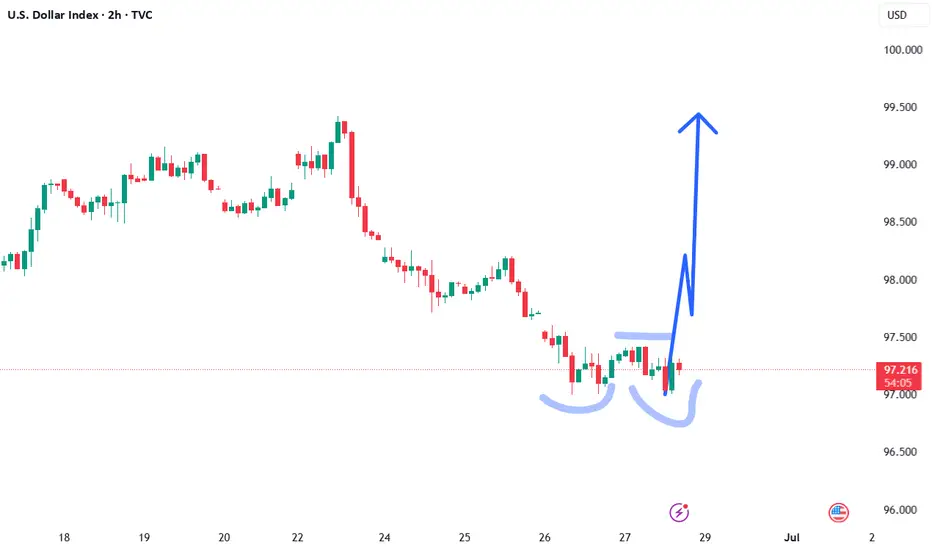
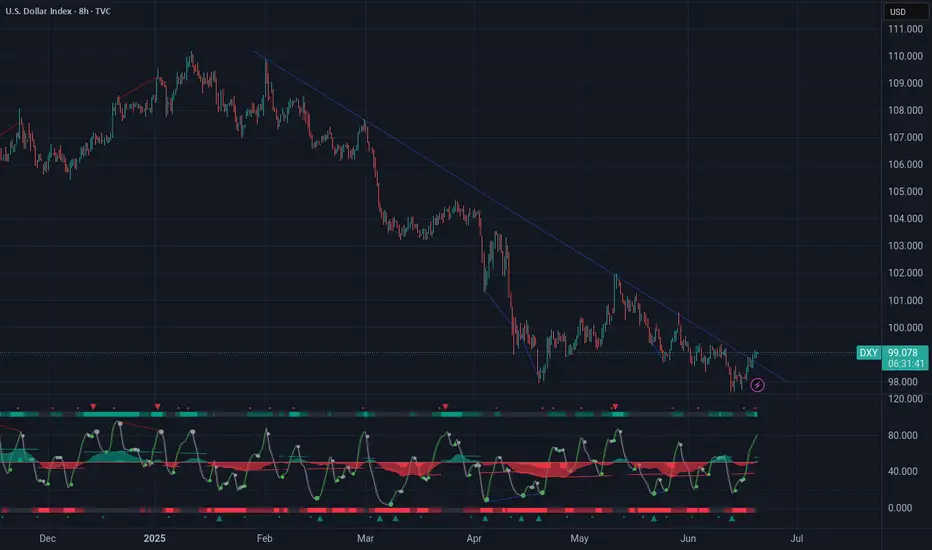
I dare say, DXY has bottomed, only higher from now on!This is the low on DXY. It can range from here or glide up slowly.
DXY is predictable this year because Trump is unpredictable. Causing the market to just repeat history. Check DXY on 2017
Conservative traders can wait for 4hrs close before entering.
The SL and TP are outlined on the chart.
Enjoy

US30 (Dow Jones) Analysis – June 2025 Outlook📊 US30 (Dow Jones) Analysis – June 2025 Outlook
🔍 1. Fundamental Analysis
The US30 (Dow Jones Industrial Average) is currently navigating a complex environment shaped by macroeconomic shifts and geopolitical tensions. Below is an in-depth review of current factors influencing its price action:
🏦 Monetary Policy & Economic Indicators
Federal Reserve Stance:
After a series of rate hikes between 2022 and 2024, the Fed has adopted a more dovish tone in 2025.
Market consensus now expects the Fed to cut rates by Q3–Q4 2025 as inflation cools and growth moderates.
Inflation:
The May 2025 CPI came in lower than expected at 2.7% YoY, signaling disinflation.
Core CPI and PCE data also reflect a slowing pace of price increases, strengthening the case for easing.
Labor Market:
Non-farm payrolls have stabilized, but wage growth is slowing.
Unemployment remains low at 3.8%, but job creation is skewed toward lower-paying service sectors.
Growth Metrics:
ISM Manufacturing PMI remains below 50 (contraction), but Services PMI is resilient.
Consumer confidence dipped recently, reflecting uncertainty, yet consumer spending remains robust.
🌍 Geopolitical Climate
Iran–Israel Conflict Escalation (Mid 2025):
The recent Iran-Israel military clashes have rattled markets, briefly triggering risk-off flows.
The conflict has led to spikes in crude oil prices, pushing energy stocks higher but raising concerns about inflation re-acceleration.
US–China Relations:
Ongoing trade tensions over semiconductors and AI have led to sanctions on key Chinese tech firms.
Despite this, tech-heavy indices remain resilient due to domestic demand and AI sector optimism.
Global Monetary Policy Divergence:
While the Fed is dovish, the ECB has already started cutting rates, boosting global liquidity.
This divergence supports capital inflows into US equities, especially defensive and industrial sectors represented in the Dow.
📉 2. Technical Analysis (Smart Money Concepts)
The daily chart of US30, as annotated, reflects a clear transition from a bearish structure to a bullish regime, validated by Smart Money Concepts (SMC) methodology:
🔄 Market Structure Shift
Bearish Trend: Price was forming Lower Highs (LH) and Lower Lows (LL) into early 2025.
Change of Character (ChoCH): A significant bullish shift occurred with a closure above 42842, invalidating the prior LH and suggesting institutional buying.
Break of Structure (BOS): Followed by a clean higher high, reinforcing the bullish momentum.
🧱 Key SMC Levels & Zones
Buy Zone (Demand):
Between 41,600 and 41,800, this region aligns with:
A previous Higher Low (HL)
A visible Fair Value Gap (FVG)/Imbalance
Psychological support zone
Expected to be a strong institutional demand zone for a long setup.
IDM (Intermediate Demand Mitigation):
Minor liquidity grab possible before retest of buy zone.
An early sign of bullish intent may appear here.
Bearish Invalidation Level:
41,179 is the key structural level.
A daily closure below 41,179 would invalidate bullish bias and trigger a bearish BOS.
📈 Trend & Liquidity Outlook
Liquidity Pools:
Sell-side liquidity rests below recent HLs, particularly near IDM and the Buy Zone.
Buy-side liquidity above recent HH (~43,800) is the next target if price rebounds.
Trendline Support:
Ascending trendline from April continues to hold.
Acts as dynamic support intersecting the Buy Zone in late June.
Targets:
TP1: 43,000 (recent swing high)
TP2: 43,800–44,000 (liquidity magnet zone)
Final Supply Zone: 45,078 (historical resistance, visible on chart)
📌 Scenario Planning (SMC-Based)
Primary (Bullish) Scenario:
Price retraces into Buy Zone (41,600–41,800).
Forms bullish engulfing or displacement candle.
Entry long → Target 43,800+, SL below 41,179.
Alternate (Bearish) Scenario:
Price closes below 41,179 (breaks structure).
Bias flips to bearish.
Next support zone lies around 40,300–40,500.
NOTE: ONLY FOR EDUCATIONAL NOT A FINANCIAL ADVICE

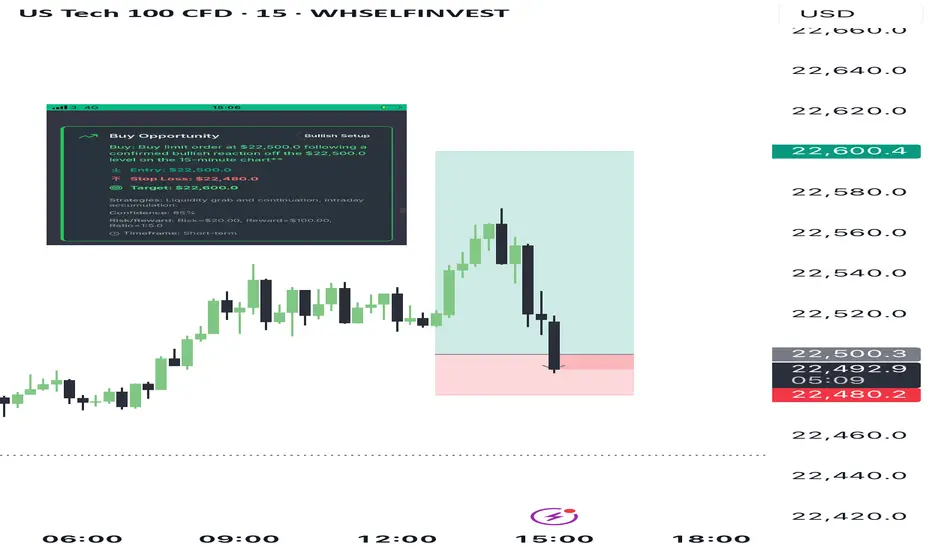
Trade alert triggered! Tiqgpt setupAnalyzing the US Tech 100 CFD across multiple timeframes, we observe a consistent bullish momentum from the daily down to the 1-minute chart. The daily and 4-hour charts show a series of strong bullish candles, indicating a robust institutional buying presence. The 1-hour chart confirms this trend with a continuation of bullish candles, although there's a slight pullback visible, suggesting a temporary liquidity grab before further upward movement. The 15-minute charts show a more detailed view of this pullback, which appears to be a healthy correction within a broader bullish trend. The 1-minute chart shows increased volatility and some consolidation, typical of lower timeframes where retail traders are more active.
INSTITUTIONAL THESIS: Institutions are likely in a phase of accumulation and distribution, using pullbacks to gather more positions before pushing the price higher. The consistent higher highs and higher lows across timeframes suggest a strong bullish bias. The recent pullbacks on lower timeframes are likely temporary, serving to trap bearish retail traders before continuation of the uptrend.
LEARNING POINT: The pullback seen on the 1-hour and 15-minute charts can be interpreted as a liquidity grab, where institutions are likely stopping out weak bearish positions before continuing the bullish trend. This is a classic example of "stop hunt" before trend continuation.
SIGNAL: BUY SYMBOL: US Tech 100 CFD ENTRY PRICE: $22,500.0 STOP LOSS: $22,480.0 (Below the recent minor pullback on the 15-minute chart) TARGET PRICE: $22,600.0 (Just below the recent highs to ensure liquidity for exit) CONDITION: Buy limit order at $22,500.0 following a confirmed bullish reaction off the $22,500.0 level on the 15-minute chart RATIONALE:
Market Structure: Consistent higher highs and lows across all timeframes.
Order Flow: Institutional buying evident from large bullish candles.
Liquidity Behavior: Recent pullbacks likely represent liquidity grabs.
Pressure Analysis: Strong bullish candles indicate institutional pressure.
Strategies Used: Liquidity grab and continuation, intraday accumulation. URGENCY: MEDIUM TIMEFRAME: Short-term CONFIDENCE SCORE: 85% (Based on the clear bullish structure and institutional buying signs) **RISK/REWARD RATIO: Risk=$20.00, Reward=$100.00, Ratio=1:5.0
Risk = $22,500.0 - $22,480.0 = $20.0
Reward = $22,600.0 - $22,500.0 = $100.0
Ratio = $100.0 / $20.0 = 5.0
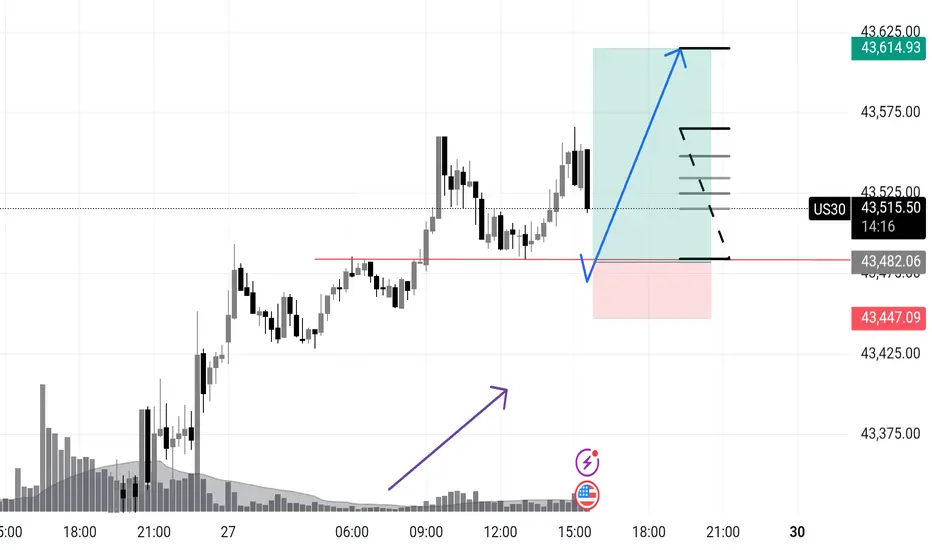
US 30 Potential longUS30 – Wyckoff Spring Setup for NY Session | Intraday Execution Play
Price rallied in the London session with rising volume and structure breaks —
Now we’re anticipating a classic Wyckoff spring scenario just ahead of NY open.
📍 Key Expectations:
Sweep of intraday support around 43,482
Strong buyer reaction (spring confirmation)
Expansion into the 43,600+ zone — possible 1.5R+ continuation
⚠️ Volume buildup + stop placement below prior structure make this zone ripe for a fakeout → reversal.
I’m watching for a quick flush below the line → wick rejection → engulfing confirmation to trigger longs.
This is a trap trade — smart money baits shorts, I’m betting they get squeezed.
🔫 Entry: On confirmation after spring
📉 Invalidation: Below the spring low
🎯 Target: 43,610 zone and trailing after break of 43,570
Let them walk into the trap. Then pull the trigger.
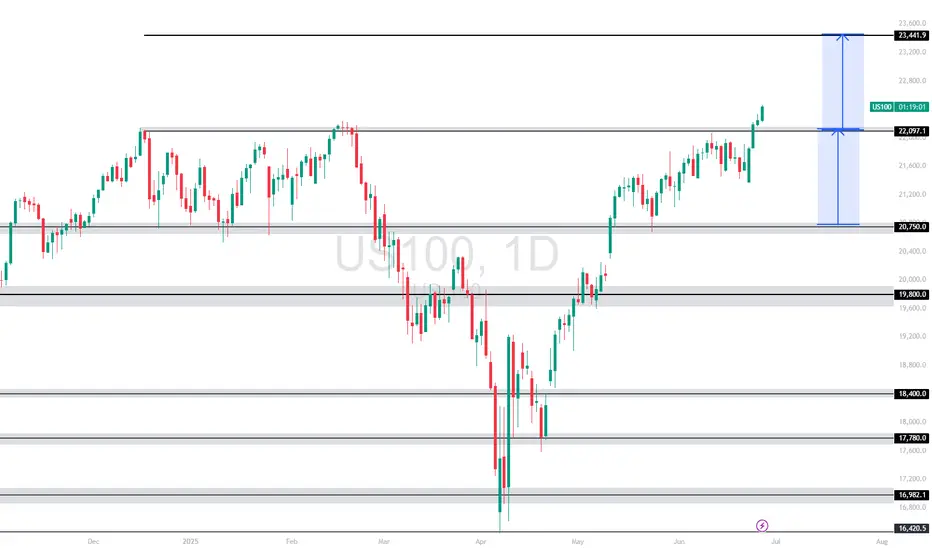
US100 (NASDAQ 100 Index) – Breakout with Clear Upside ProjectionUS100 has broken out cleanly above the key resistance at 22,097.1, indicating bullish continuation. The breakout is supported by strong upward momentum, targeting the next key level around 23,441.9, as illustrated by the projected range.
Support at: 22,097.1 🔽 | 20,750.0 🔽
Resistance at: 23,441.9 🔼
🔎 Bias:
🔼 Bullish: Sustained price action above 22,097.1 keeps the bullish breakout valid, aiming toward 23,441.9.
🔽 Bearish: A drop back below 22,097.1 would invalidate the breakout, possibly pulling price toward 20,750.0.
📛 Disclaimer: This is not financial advice. Trade at your own risk.
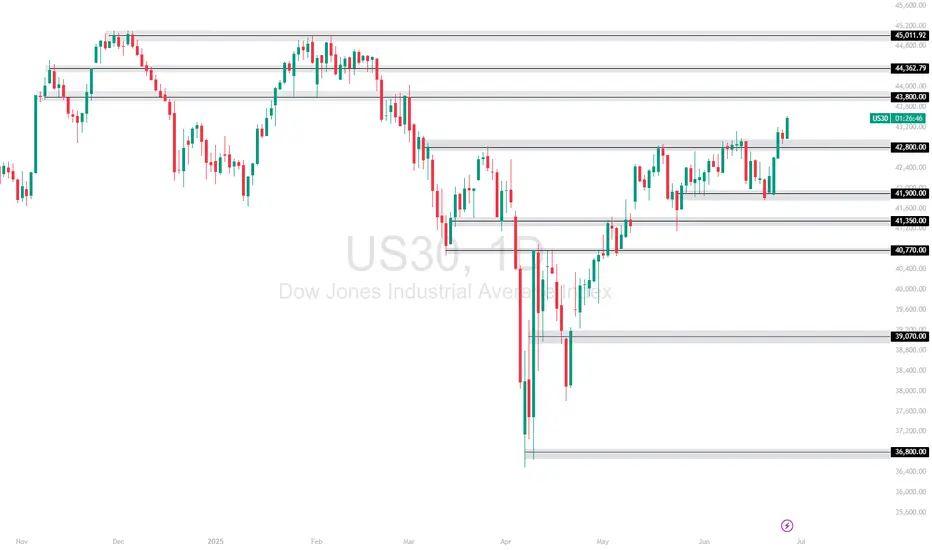
US30 Testing Key Resistance ZonesUS30 has shown renewed bullish momentum with a strong breakout candle above the 42,800.00 resistance. After consolidating for several sessions, price surged upward, now hovering near the 43,800.00 zone—an important resistance level from prior highs.
Support at: 42,800.00 🔽 | 41,900.00 🔽
Resistance at: 43,800.00 🔼 | 44,362.79 🔼 | 45,011.92 🔼
🔎 Bias:
🔼 Bullish: A daily close above 43,800.00 opens the path to test 44,362.79 and potentially 45,011.92.
🔽 Bearish: Rejection from current level and a break below 42,800.00 may trigger a pullback toward 41,900.00.
📛 Disclaimer: This is not financial advice. Trade at your own risk.
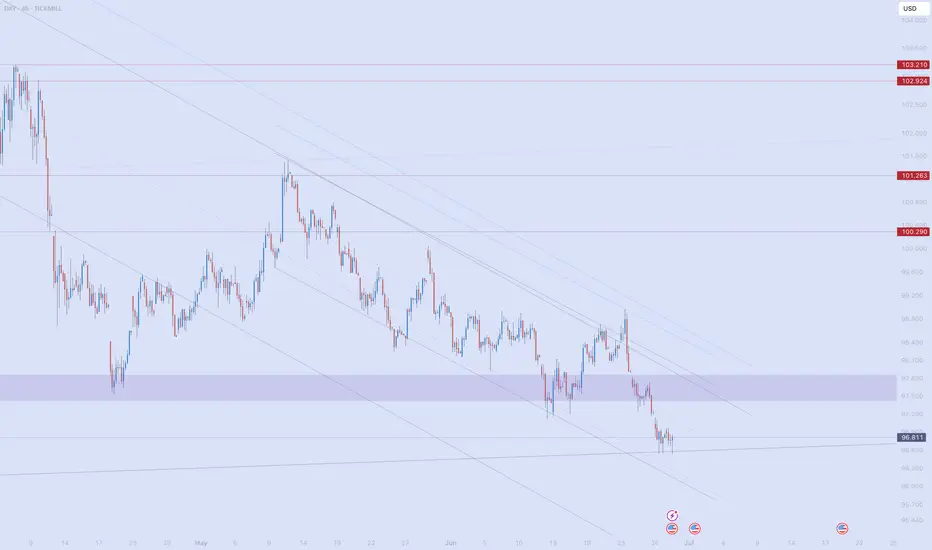
Make Dollar Great AgainDXY Big Picture
While looking at other DXY charts to use a clean chart for HTF, I saw that it touched historical trend support. It didn't touch only on the TVC chart, so I am adding it with the other charts and accepting that it touched the trend.
According to the fractal I added in August last year, the price is moving very well.
I expect a correction from these areas. I think we have reached the reversal areas due to both the momentum in the declines and the oversold.
The decline fatigue I mentioned is more evident in LTF charts. The price cannot reach the EQ zone of the decline channel that has been going on since February on the daily chart. Although it is a very inclined channel on the 4h chart, it can no longer reach the channel bottom. For this reason, I think this region is where reversal should be sought. After the first 0.38 of this decline, I think a pullback to 0.5 is possible.
US Tech 100 CFD broke the Resistance level 22,365.0 range👀Possible scenario:
U.S. stock futures climbed on June 27, with the S\&P 500 and Nasdaq nearing record highs as investors awaited May’s PCE inflation report — the Fed’s preferred gauge — due at 8:30 a.m. ET.
Rate cut expectations grew following reports that President Trump may replace Fed Chair Powell by fall. The odds of a July rate cut rose to 20.7%, up from 14.5% last week. Soft GDP growth, rising jobless claims, and a rare earth trade agreement with China added to the dovish outlook. Also due June 27 final June consumer sentiment data and remarks from several Fed officials.
✅Support and Resistance Levels
Support level is now located at 21,360.0
Now, the resistance level is located at 22,570.0
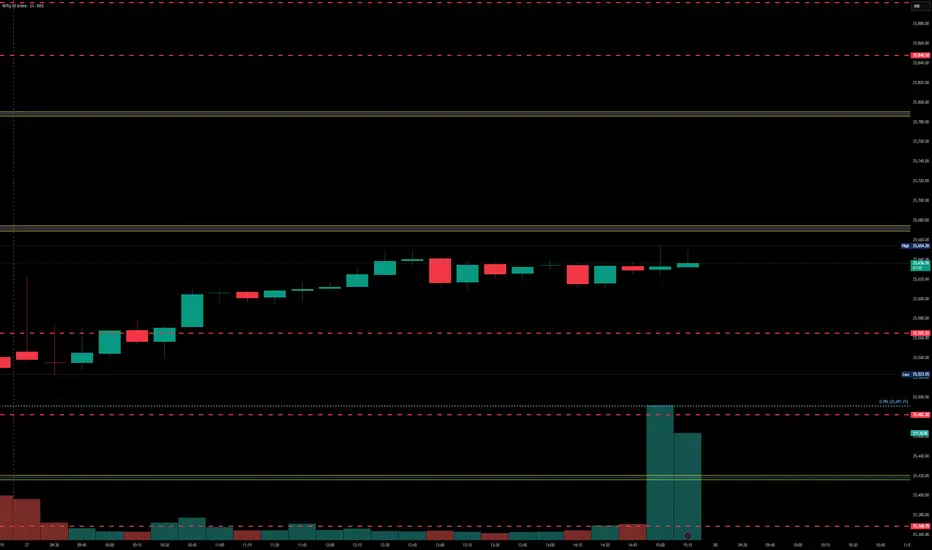
Nifty levels - Jun 30, 2025Nifty support and resistance levels are valuable tools for making informed trading decisions, specifically when combined with the analysis of 5-minute timeframe candlesticks and VWAP. By closely monitoring these levels and observing the price movements within this timeframe, traders can enhance the accuracy of their entry and exit points. It is important to bear in mind that support and resistance levels are not fixed, and they can change over time as market conditions evolve.
The dashed lines on the chart indicate the reaction levels, serving as additional points of significance to consider. Furthermore, take note of the response at the levels of the High, Low, and Close values from the day prior.
We hope you find this information beneficial in your trading endeavors.
* If you found the idea appealing, kindly tap the Boost icon located below the chart. We encourage you to share your thoughts and comments regarding it.
Wishing you success in your trading activities!
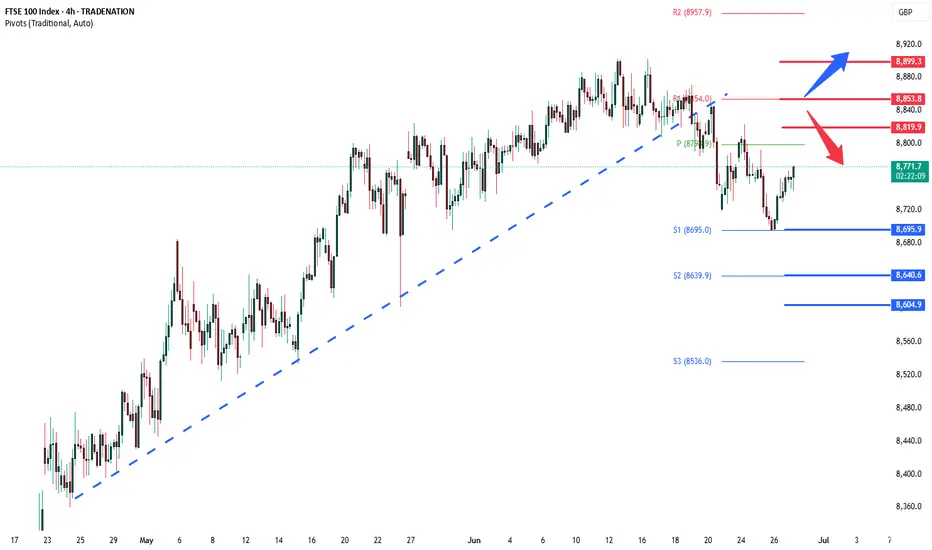
FTSE Oversold rally resistance at 8820The FTSE remains in a bullish trend, with recent price action showing signs of a corrective pullback within the broader uptrend.
Support Zone: 8695 – a key level from previous consolidation. Price is currently testing or approaching this level.
A bullish rebound from 8695 would confirm ongoing upside momentum, with potential targets at:
8820 – initial resistance
8855 – psychological and structural level
8900 – extended resistance on the longer-term chart
Bearish Scenario:
A confirmed break and daily close below 8695 would weaken the bullish outlook and suggest deeper downside risk toward:
8640 – minor support
8600 – stronger support and potential demand zone
Outlook:
Bullish bias remains intact while the FTSE holds above 8695. A sustained break below this level could shift momentum to the downside in the short term.
This communication is for informational purposes only and should not be viewed as any form of recommendation as to a particular course of action or as investment advice. It is not intended as an offer or solicitation for the purchase or sale of any financial instrument or as an official confirmation of any transaction. Opinions, estimates and assumptions expressed herein are made as of the date of this communication and are subject to change without notice. This communication has been prepared based upon information, including market prices, data and other information, believed to be reliable; however, Trade Nation does not warrant its completeness or accuracy. All market prices and market data contained in or attached to this communication are indicative and subject to change without notice.
US Dollar is breaking out to the upsideIt looks like the US dollar is breaking out to the upside from a trendline resistance that started back on Feb 2025.
The breakout coincides with the passing of the Genius Act.
US30 - ShortLooking for the Short on US30 final pull back before we see extension to the upside 45,000.
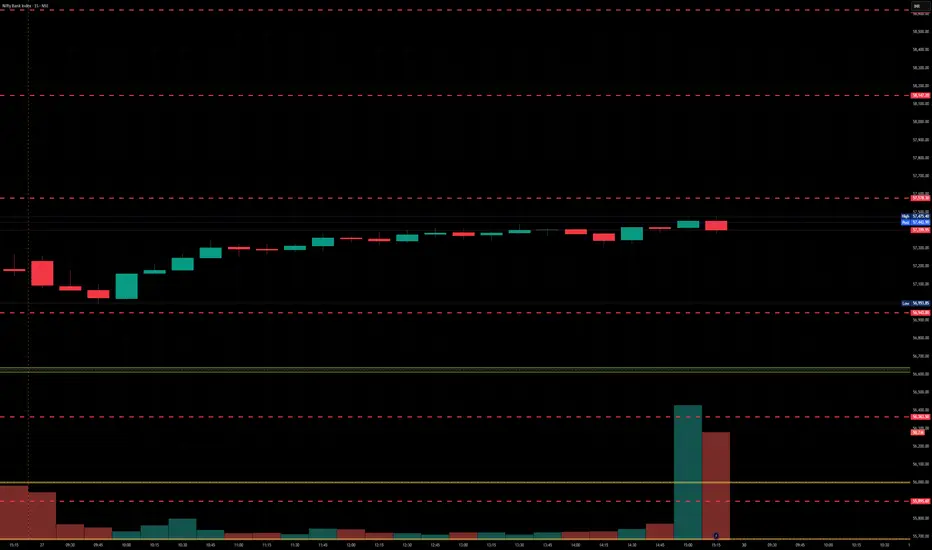
BankNifty levels - Jun 30, 2025Utilizing the support and resistance levels of BankNifty, along with the 5-minute timeframe candlesticks and VWAP, can enhance the precision of trade entries and exits on or near these levels. It is crucial to recognize that these levels are not static, and they undergo alterations as market dynamics evolve.
The dashed lines on the chart indicate the reaction levels, serving as additional points of significance. Furthermore, take note of the response at the levels of the High, Low, and Close values from the day prior.
We trust that this information proves valuable to you.
* If you found the idea appealing, kindly tap the Boost icon located below the chart. We encourage you to share your thoughts and comments regarding it.
Wishing you successful trading endeavors!
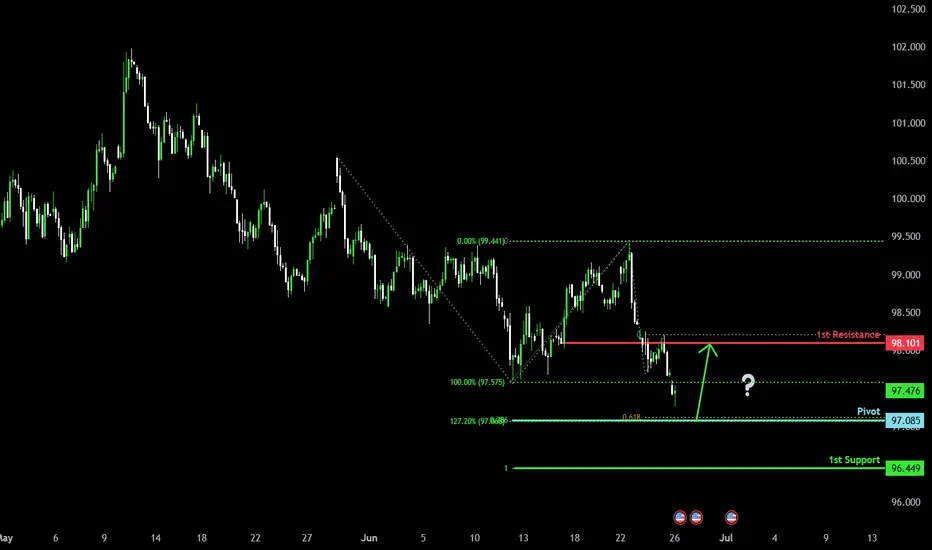
Potential bulllish reveresal?The US Dollar Index (DXY) is falling towards the pivot, which aligns with the Fibonacci confluence and could reverse to the 1st resistance.
Pivot: 97.08
1st Support: 96.44
1st Resistance: 98.10
Risk Warning:
Trading Forex and CFDs carries a high level of risk to your capital and you should only trade with money you can afford to lose. Trading Forex and CFDs may not be suitable for all investors, so please ensure that you fully understand the risks involved and seek independent advice if necessary.
Disclaimer:
The above opinions given constitute general market commentary, and do not constitute the opinion or advice of IC Markets or any form of personal or investment advice.
Any opinions, news, research, analyses, prices, other information, or links to third-party sites contained on this website are provided on an "as-is" basis, are intended only to be informative, is not an advice nor a recommendation, nor research, or a record of our trading prices, or an offer of, or solicitation for a transaction in any financial instrument and thus should not be treated as such. The information provided does not involve any specific investment objectives, financial situation and needs of any specific person who may receive it. Please be aware, that past performance is not a reliable indicator of future performance and/or results. Past Performance or Forward-looking scenarios based upon the reasonable beliefs of the third-party provider are not a guarantee of future performance. Actual results may differ materially from those anticipated in forward-looking or past performance statements. IC Markets makes no representation or warranty and assumes no liability as to the accuracy or completeness of the information provided, nor any loss arising from any investment based on a recommendation, forecast or any information supplied by any third-party.
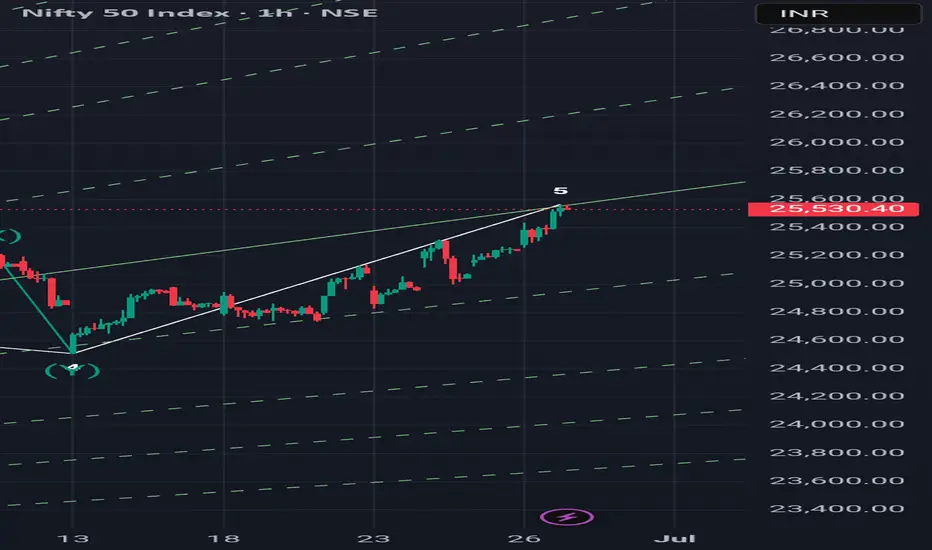
5 th wave done today? If Nifty does not able to cross 25600 by Monday and goes down after hitting today's high of 25565 then it is the indication of completion of wave 5th and now it is the end of extended flat correction ABC started from March. Many price action tools are also indicating this pivot 25565 as high. So the conclusion is this that there are 50% chances of ending of correction and we will get further confirmation after Friday's price movement.
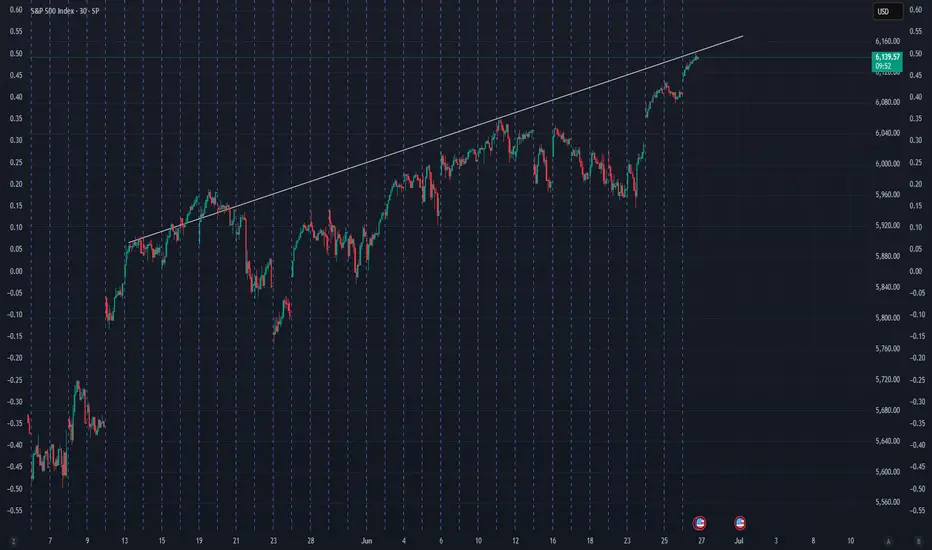
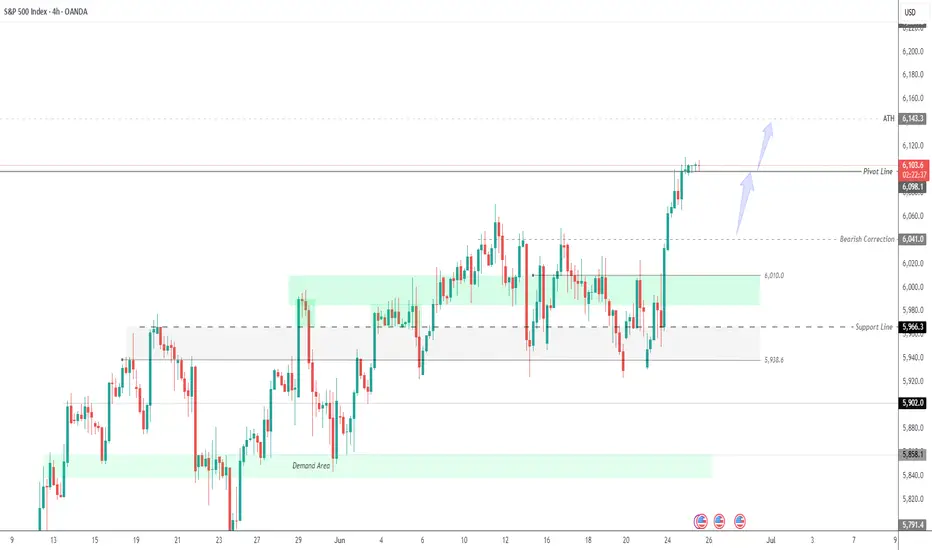
SPX500 Holds Above 6,098 | Bullish Bias Toward ATH at 6,143OANDA:SPX500USD OVERVIEW
S&P 500 Futures Subdued After Near-Record Close | Market Eyes Powell’s Comments
U.S. stock futures were muted on Wednesday after the S&P 500 closed near an all-time high, following signals from Israel and Iran that their air conflict has ended.
Investors now await further comments from Fed Chair Jerome Powell for clues on the monetary policy outlook.
TECHNICAL OUTLOOK – SPX500
The price remains in a bullish trend as long as it trades above 6,098, with upside potential toward the ATH at 6,143.
However, a 1H or 4H candle close below 6,098 would likely trigger a bearish correction toward 6,056 and 6,041.
Pivot Level: 6,098
Resistance Levels: 6,143 → 6,175 → 6,210
Support Levels: 6,066 → 6,041
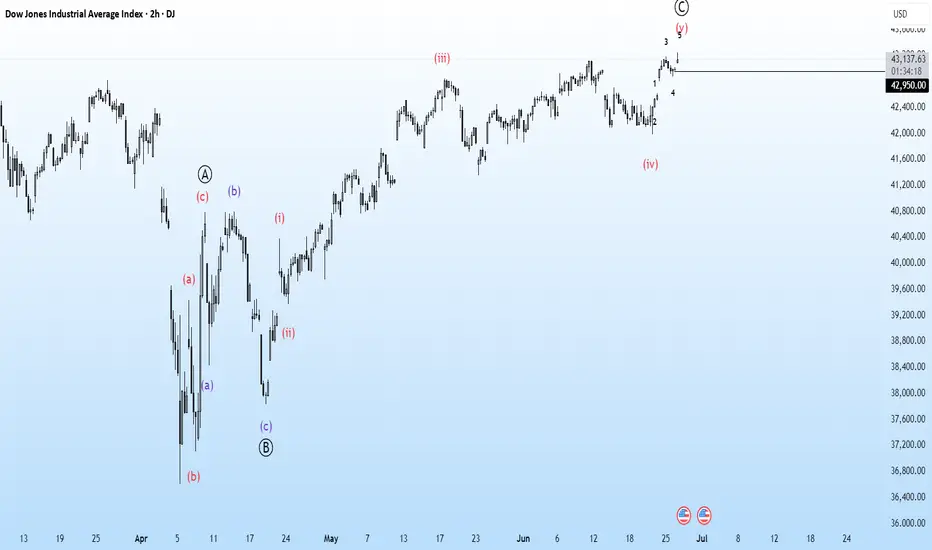
DJI This is 2hrly chart of DJI
looking at the chart ,
I sense this structure of EW ...
and looks this whole move has been corrective wave...
going forward...
DJI is 43185
below 42950, I would be looking for 36.5k as my target with recent high as my sl ...
Just a View!!
Vedang:)
Discliamer: Chart is for study purpose only!!