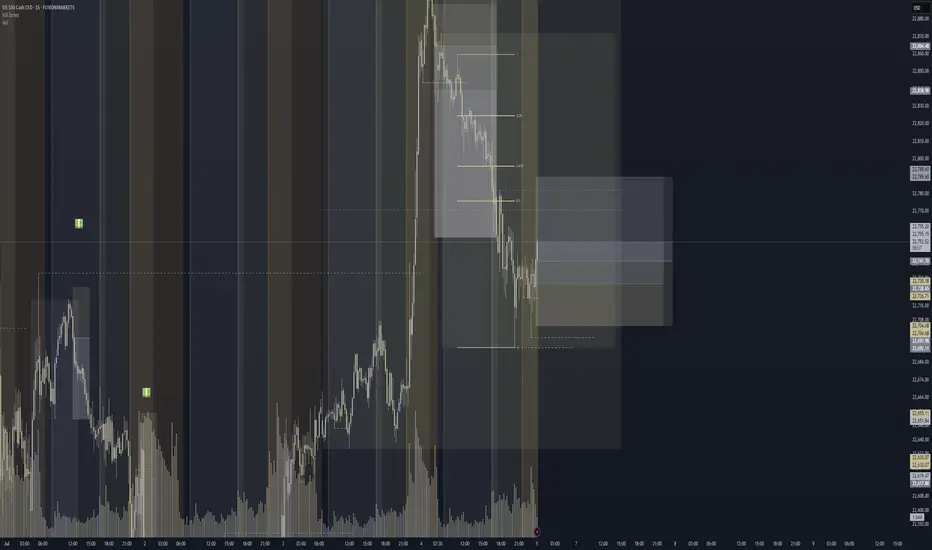
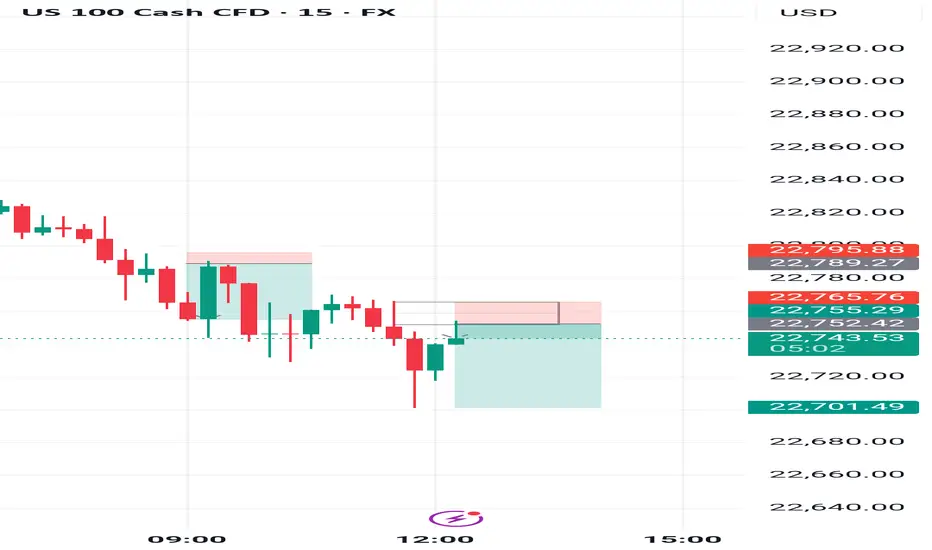
Discount Zone Reversal Play Entered a long position after identifying an short formed W formation within discount territory, mapped from yesterday’s high–low range. Price action showed clear structural symmetry, with the second leg completing at a key demand zone.
📌 Buyside liquidity at 22,692.27 acted as the inducement level—price swept it and respected the zone, signaling smart money accumulation.
Key Confluences:
- Extended W structure with balanced legs and volume support
- Price operating below EQ before trigger, favoring bullish reversal
- TP placed just above EQ to anticipate reaction without overextending
- Structure confirmed by neckline retest and bullish candle ignition
This setup aligns with a classic liquidity sweep and reversal narrative, targeting measured premium zones while managing drawdown with tight risk control. The trade is guided by structure, liquidity, and session timing—a patient play with clean narrative flow.
Market indices
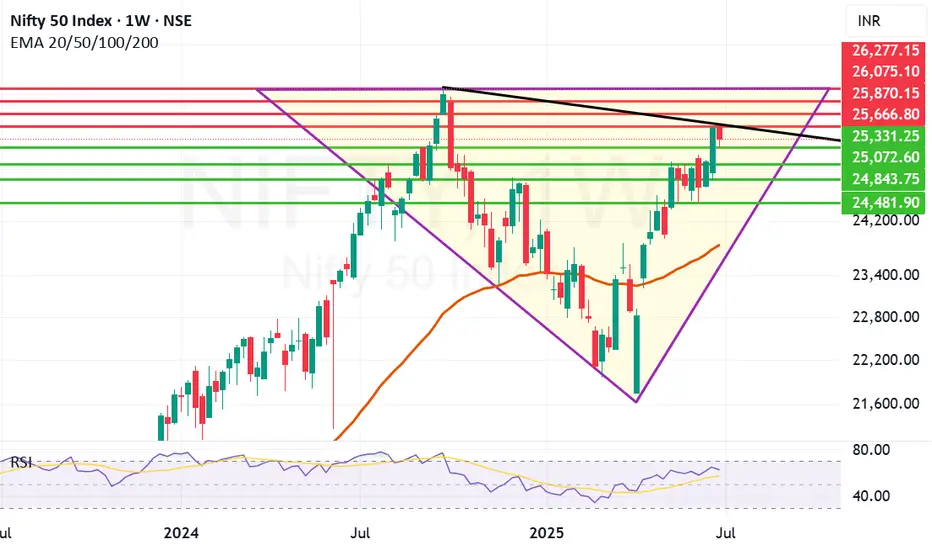
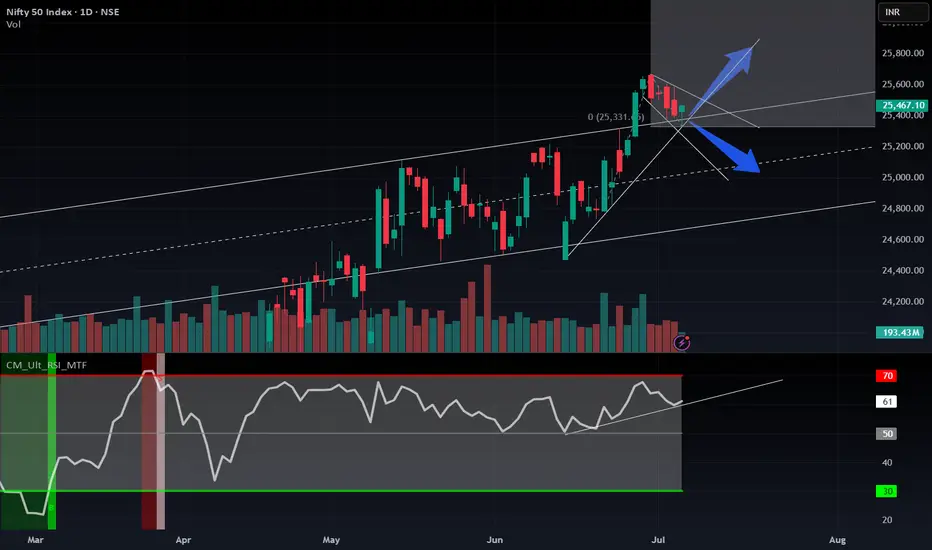
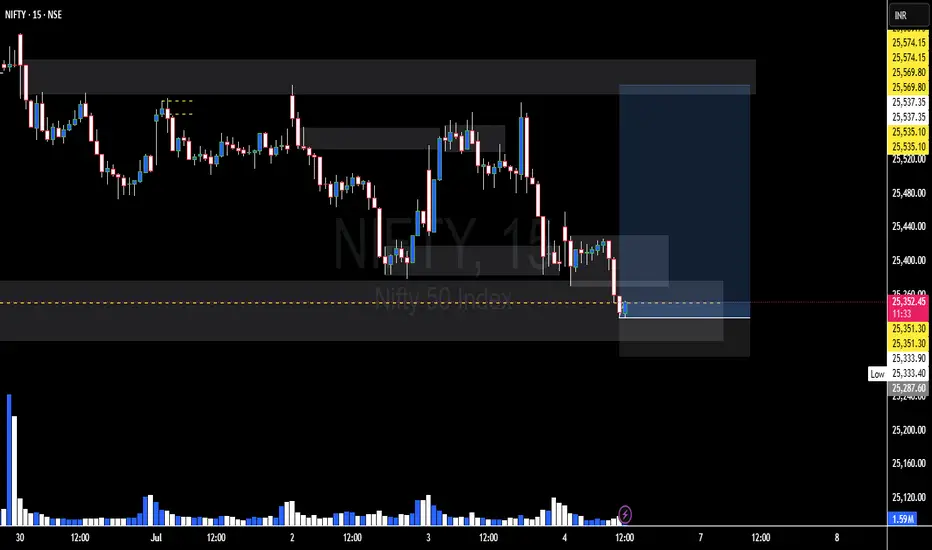
Good Closing by Nifty: Trump Tariff decision awaits us next weekNifty closed the week at 25461 well after gaining 130 points from Friday low of 25331. Overall Nifty closed 55 point positive from Thursday closing. This was a very smart recovery of Nifty from the lows of the day but we are heading towards Trump Tariff deadline of 9th July. That has potential to shake the market and move it any direction so investors should keep an eye on the developments and keep their stop losses and trailing stop losses in place. Overall Nifty is on the path to V shaped recovery as indicated in the chart. If everything works out in favour of India in the negotiation the 816 point gap from previous all time high will be bridged sooner than later. Once we reach the Previous All-time high the recovery will be complete. But we have to be cautiously optimistic.
Nifty supports currently remain at: 25331, 25072, 24843, 24481. If 24481 is broken than Bears will try to drag Nifty towards 23840 (Which is the Mother line of Weekly Chart).
Nifty Resistances currently remain at: 25666 (Trend line Resistance), 25870, 26075, 26277 (Previous All time high).
Disclaimer: The above information is provided for educational purpose, analysis and paper trading only. Please don't treat this as a buy or sell recommendation for the stock or index. The Techno-Funda analysis is based on data that is more than 3 months old. Supports and Resistances are determined by historic past peaks and Valley in the chart. Many other indicators and patterns like EMA, RSI, MACD, Volumes, Fibonacci, parallel channel etc. use historic data which is 3 months or older cyclical points. There is no guarantee they will work in future as markets are highly volatile and swings in prices are also due to macro and micro factors based on actions taken by the company as well as region and global events. Equity investment is subject to risks. I or my clients or family members might have positions in the stocks that we mention in our educational posts. We will not be responsible for any Profit or loss that may occur due to any financial decision taken based on any data provided in this message. Do consult your investment advisor before taking any financial decisions. Stop losses should be an important part of any investment in equity.
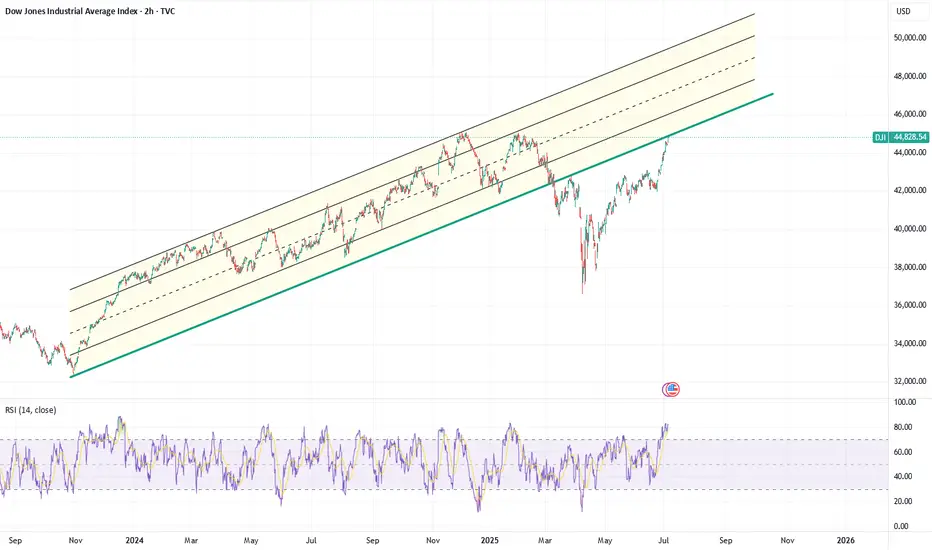
Trendline / Channel retestDJI hits this trendline / channel bottom again. I expect a rejection and a correction from it. It's not a classic channel, so a false break-in is allowed.
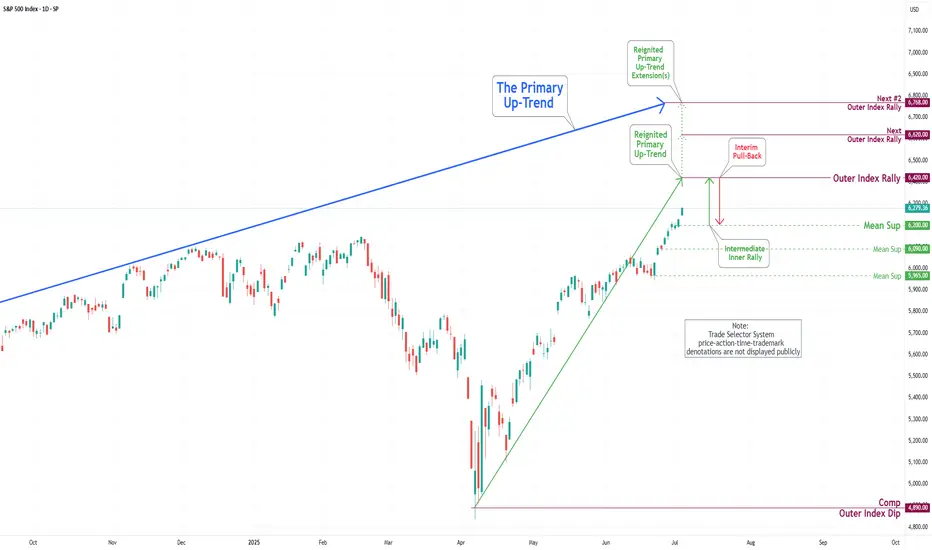
S&P 500 Daily Chart Analysis For Week of July 3, 2025Technical Analysis and Outlook:
During this abbreviated trading week, the S&P 500 Index has primarily shown an upward course, hitting and surpassing our target for the Outer Index Rally of 6235. Currently, the index demonstrates a consistent bullish trend, with the following objective for the Outer Index Rally set at 6420, followed by forthcoming targets of 6620 and 6768. Nevertheless, it is crucial to acknowledge the current price action may cause prices to retrace from their current fluctuation to test the Mean Support at 6200 before resuming their upward movement.
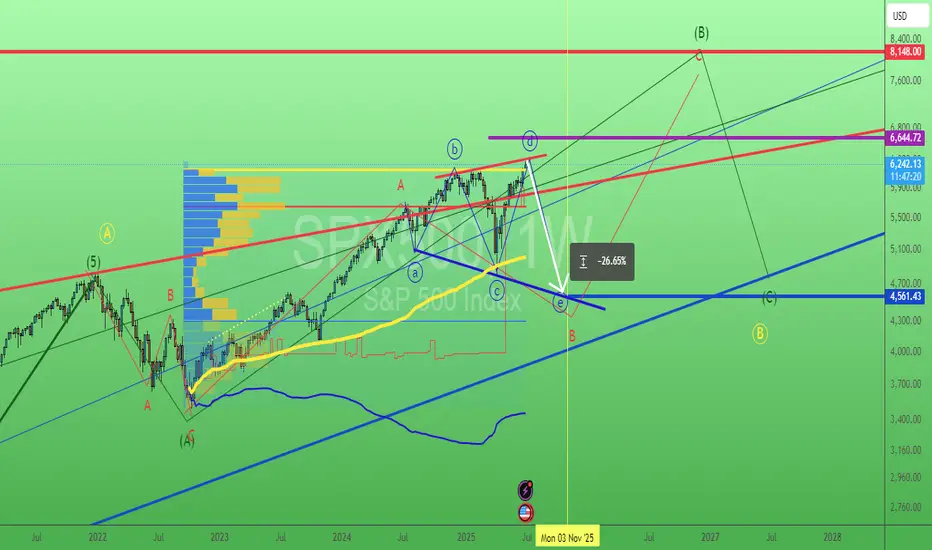
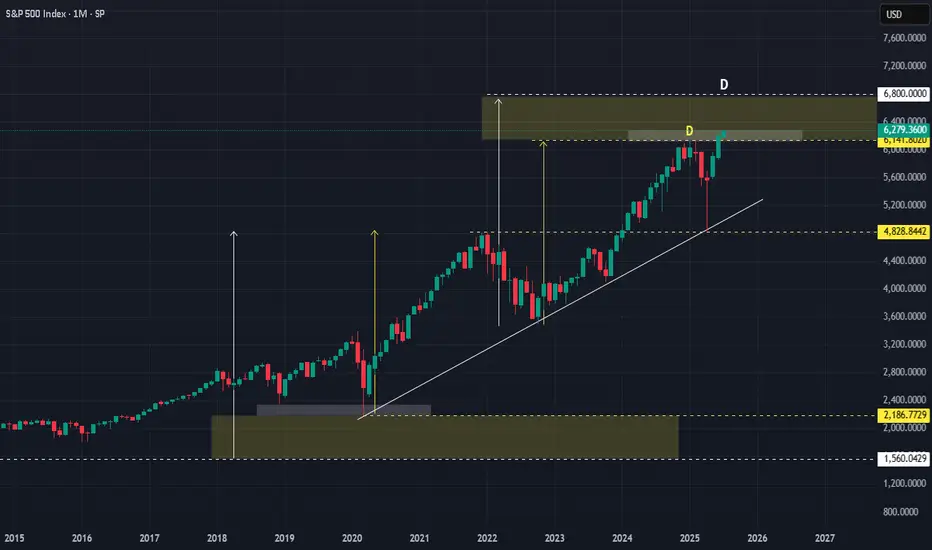
SPX : Next Stop @ 6800 :-)Since we are now expecting a delay in the FED cutting, there will be plenty of liquidity to spice things up.
The 'D' @ yellow had worked once before and since it has been 'used up' , its potency had been somewhat reduced.
But have no fear/worry, there would always be more 'D' ahead. The next one at 6,800
Good luck.
CN50: A Multiple Time Frame AnalysisCN50: A Multiple Time Frame Analysis
In this video, I explained in detail the possible trading scenarios for CN50, considering that it is already testing a critical area.
You May Watch The Analysis For Further Details!
Thank you!

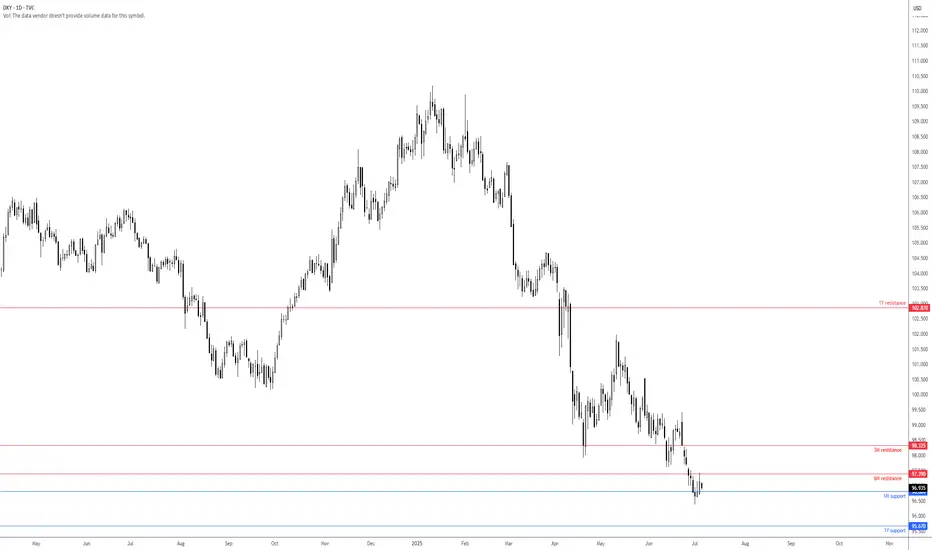
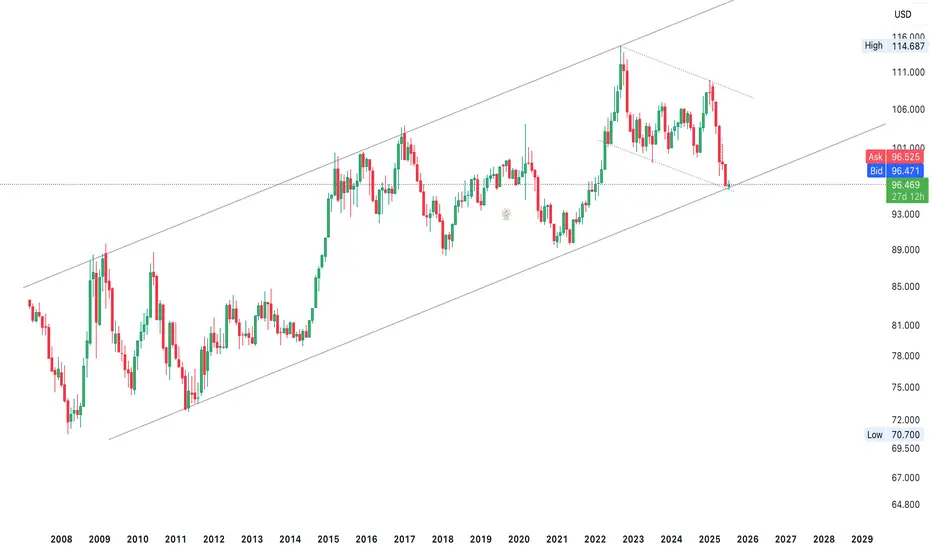
USD Index preparing for fresh YTD lows?As shown on the daily chart of the USD Index, the currency has been biased to the downside for most of this year and recently met with 1M support at 96.80. This has caused the Index to modestly rebound and retest a 6M resistance at 97.39. Given this level's significance and trend direction, sellers could show from 97.39 and refresh year-to-date lows towards 1Y support at 95.67.
- FP Markets Research Team
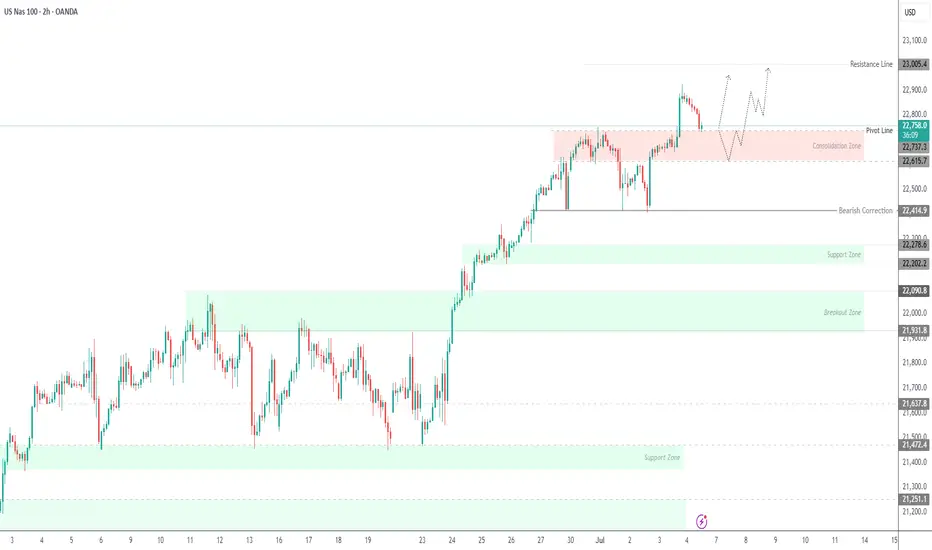
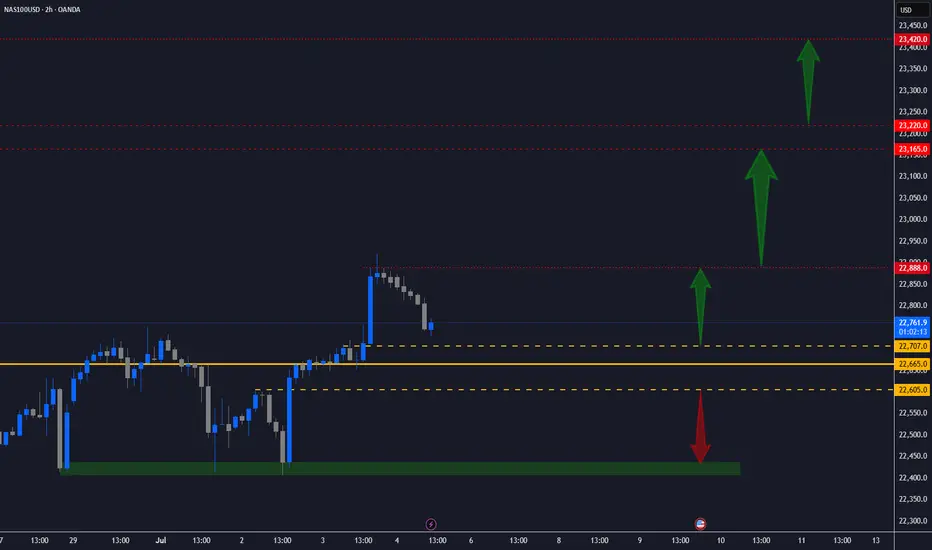
USNAS100 Key Level: 22,740 – Will the Trend Continue or Reverse?USNAS100 Update – Bullish Momentum Holds Above 22,740
USNAS100 has continued to push higher, following through as expected from yesterday’s analysis.
The index maintains bullish momentum as long as it trades above the key pivot at 22,740.
However, a 1H close below 22,730 could trigger a bearish correction toward 22,615.
A sustained break below that level may shift the trend to bearish.
Key Levels:
• Resistance: 22,870 / 23,000
• Support: 22,615 / 22,410
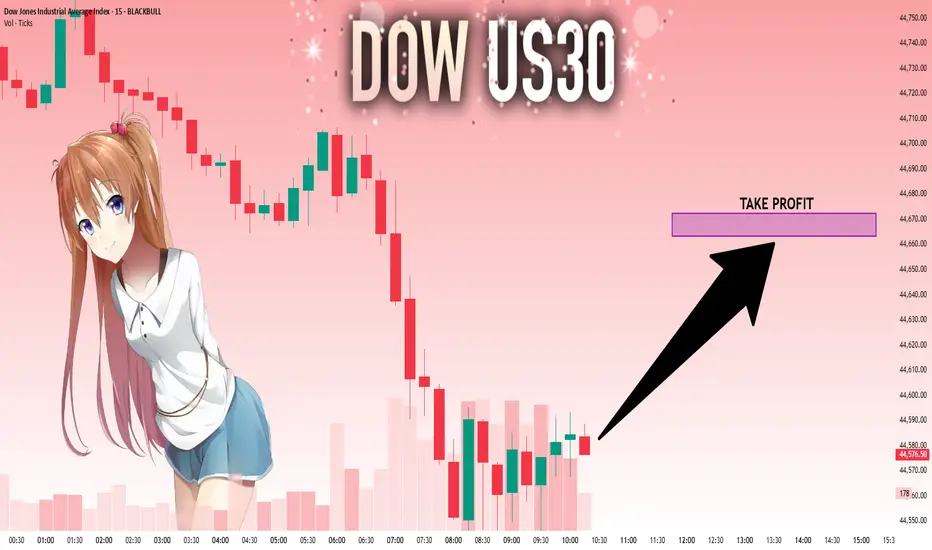
US30: Will Go Up! Long!
My dear friends,
Today we will analyse US30 together☺️
The market is at an inflection zone and price has now reached an area around 44,585.50 where previous reversals or breakouts have occurred.And a price reaction that we are seeing on multiple timeframes here could signal the next move up so we can enter on confirmation, and target the next key level of 44,663.28.Stop-loss is recommended beyond the inflection zone.
❤️Sending you lots of Love and Hugs❤️
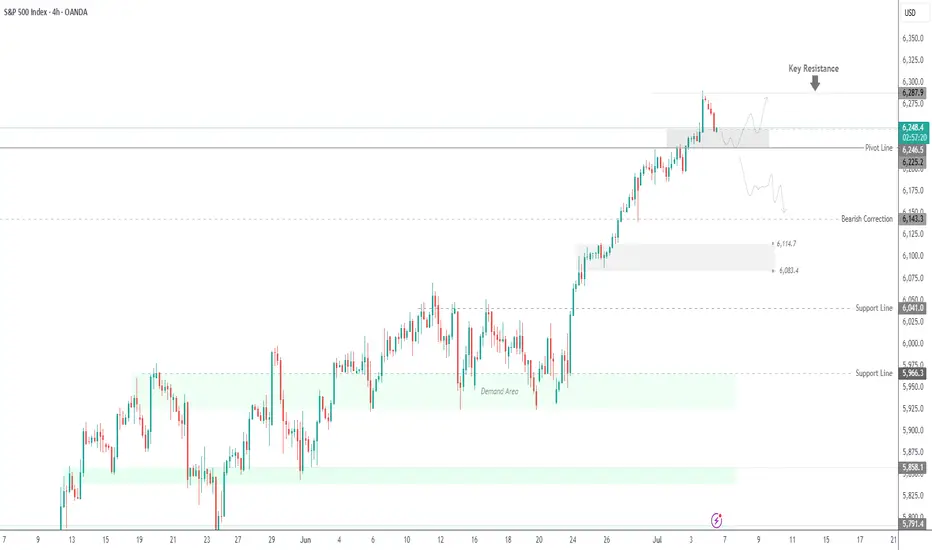
SPX500 Holds Above 6,225 – Bullish Trend Intact for NowSPX500 Update – Bullish Pressure Holds Above Pivot
SPX500 continues to show bullish momentum, as highlighted in our previous analysis. The price remains supported by strong buying volume above the key pivot zone at 6,225.
As long as the price stays above this level, a retest toward 6,225 remains possible before another leg higher.
However, a confirmed break below 6,225 would signal potential bearish momentum and shift the short-term structure.
Key Levels:
• Pivot Line: 6,246
• Resistance: 6,265 / 6,287 / 6,325
• Support: 6,225 / 6,191 / 6,143
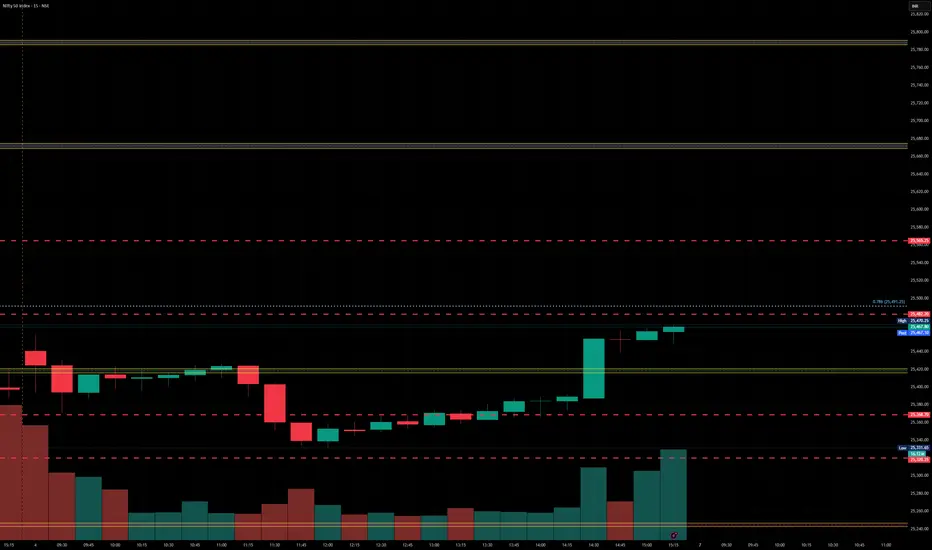
Nifty levels - Jul 07, 2025Nifty support and resistance levels are valuable tools for making informed trading decisions, specifically when combined with the analysis of 5-minute timeframe candlesticks and VWAP. By closely monitoring these levels and observing the price movements within this timeframe, traders can enhance the accuracy of their entry and exit points. It is important to bear in mind that support and resistance levels are not fixed, and they can change over time as market conditions evolve.
The dashed lines on the chart indicate the reaction levels, serving as additional points of significance to consider. Furthermore, take note of the response at the levels of the High, Low, and Close values from the day prior.
We hope you find this information beneficial in your trading endeavors.
* If you found the idea appealing, kindly tap the Boost icon located below the chart. We encourage you to share your thoughts and comments regarding it.
Wishing you success in your trading activities!
Nifty taking support from previous resistance of consolidationNifty was in a consolidation phase from May 12, 2025, to June 25, 2025. On 26th June, it broke up and moved higher. Now it is retesting this consolidation zone again and has successfully taken support from here. Expecting Nifty to test 26200, the previous ATH from here in the coming days, with positive news for India in the tariff deal with the USA
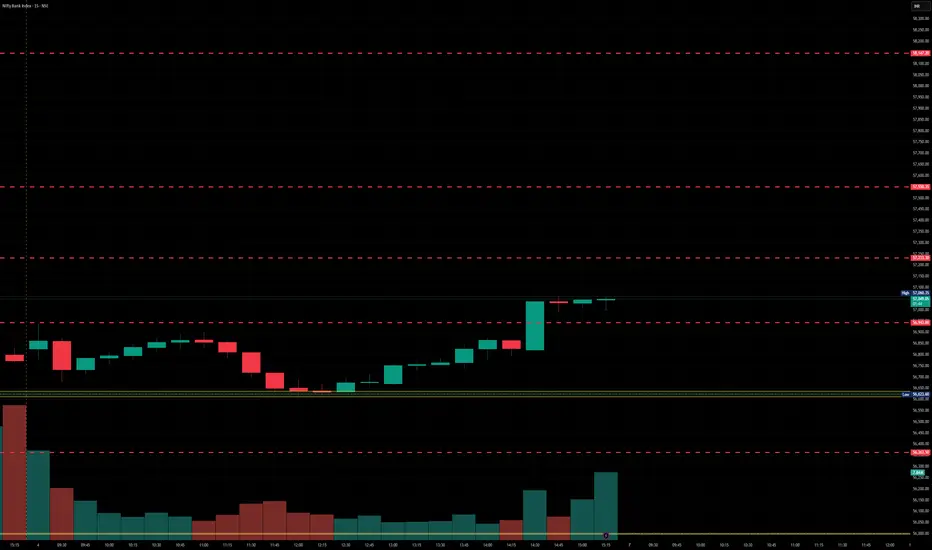
BankNifty levels - Jul 07, 2025Utilizing the support and resistance levels of BankNifty, along with the 5-minute timeframe candlesticks and VWAP, can enhance the precision of trade entries and exits on or near these levels. It is crucial to recognize that these levels are not static, and they undergo alterations as market dynamics evolve.
The dashed lines on the chart indicate the reaction levels, serving as additional points of significance. Furthermore, take note of the response at the levels of the High, Low, and Close values from the day prior.
We trust that this information proves valuable to you.
* If you found the idea appealing, kindly tap the Boost icon located below the chart. We encourage you to share your thoughts and comments regarding it.
Wishing you successful trading endeavors!
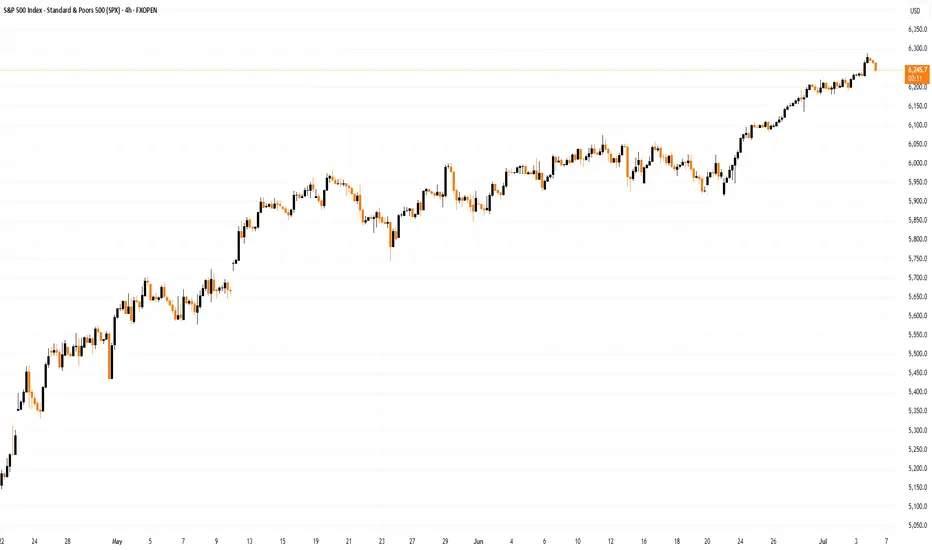
S&P 500 Hit Record High Ahead of Holiday BreakS&P 500 Hit Record High Ahead of Holiday Break
Today, financial markets in the United States are closed in observance of Independence Day. Investor sentiment was likely buoyed by the latest rally in the S&P 500 index (US SPX 500 mini on FXOpen), which set a new all-time high yesterday, surpassing 6,280.
The bullish momentum has been driven by robust labour market data in the US. According to ForexFactory, analysts had anticipated a rise in the unemployment rate from 4.2% to 4.3%, but instead, it unexpectedly declined to 4.1%.
Can the stock market continue to climb?
Technical Analysis of the S&P 500 Chart
Analysing the 4-hour chart of the S&P 500 index (US SPX 500 mini on FXOpen)on 30 June, we observed the following:
→ An ascending channel was formed (indicated in blue);
→ A developing bullish impulse (marked with an orange line) suggested the price would move towards the upper boundary of the channel – a scenario that materialised with yesterday’s rally (as shown by arrow 1).
However, from a price action perspective, the recent downward move (arrow 2) has now gained significance. It may indicate that sellers are becoming more active around the identified resistance level.
Should the price decline towards the lower orange line, this could negate the current bullish impulse altogether, effectively reflecting a classic bearish engulfing pattern.
Given the above, there is reason to believe that bears are attempting to regain control after the S&P 500 (US SPX 500 mini on FXOpen) surged over 5% in the past 10 days. As such, a potential breakout below the orange line cannot be ruled out, with price action possibly targeting the median of the blue ascending channel.
What happens next?
The market’s trajectory will largely hinge on developments related to tariffs. Trade policy will remain in the spotlight next week, as key deadlines set by the White House approach — events that traders will be closely monitoring.
This article represents the opinion of the Companies operating under the FXOpen brand only. It is not to be construed as an offer, solicitation, or recommendation with respect to products and services provided by the Companies operating under the FXOpen brand, nor is it to be considered financial advice.
NAS100 UPDATE - Potential Targets Dear Friends in Trading,
How I see it,
Key Support / Pivot @ 22665.00
If key support holds, bullish rally can potentially remain intact
A strong breach below 22605.00, can potentially force
price back to original demand.
I sincerely hope my point of view offers a valued insight.
Thank you for taking the time to study my analysis.
FOLLOW THE TREND The DXY is showing signs of a momentum shift, transitioning into a bullish recoup as Q2 progresses. This shift may signal a change in broader market sentiment, with the dollar seeking strength amidst evolving macroeconomic conditions. Traders should watch for confirmation at key structural levels. follow for more insights , so you can make informed decisions ,comment for opinions , and boost idea
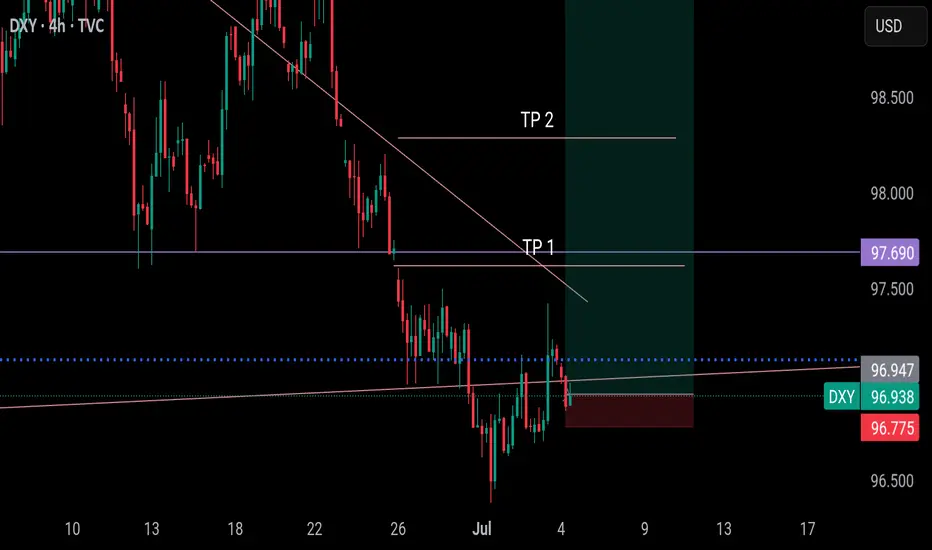
DXY IS BULLISH, SELL EURUSD, GBPUSD, WANNA BET?My last publish about dxy was stopped out but that doesn't invalidate the trade. We will still see a bullish dollar and bearish EURUSD AND GBPUSD.
SL @ 96.775
TP 1 @ 97.620
TP 2 @ 98.285
TP 3 @ 99.420
Use this trade to learn compounding and grow your account. Dont just take 10 pips and run off, once in profit,add more at a discount prices. The TP is certain
Enjoy
Follow me as my trades are market order, so you will see them on time and enter on time.
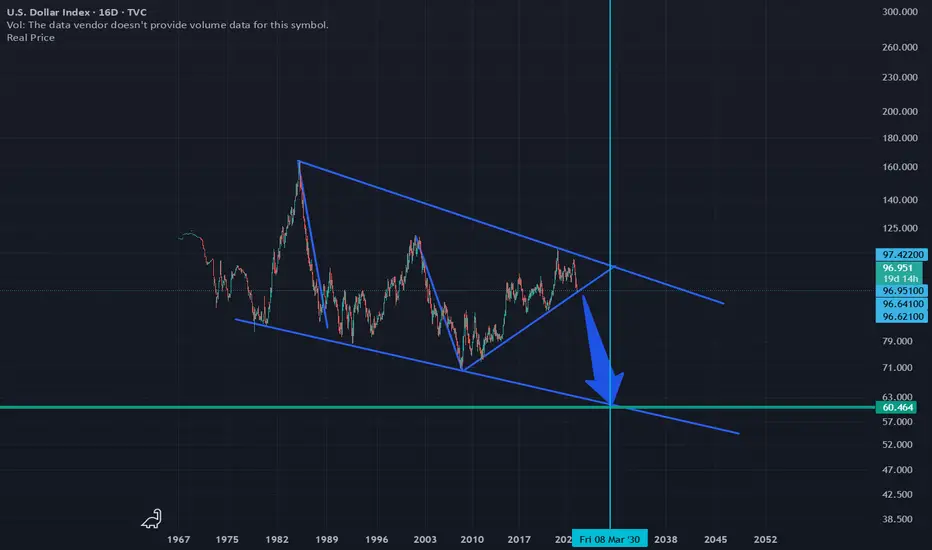
Dollar about to lose 35% of its value in the next 5 yearsDXY testing its last support line before the slide into a steep value crush.
What's another 5 trillion added to the debt anyway? Billionaires need more tax breaks!
#NIFTY 50 Bullish move should continue from hereLongs on #NIFTY50 Bullish OB which supported price earlier too grabber liq from the swing lows.

SP500 rock & roll with Trump.. 4/July/25SPX500 breaking ATH again are we in bullish stage? Or again Donald Trump "Inviting" us come to his WWE stage for his favourite "wrestling" games.. Jumping up and down or up side down.( expanding triangle) ......