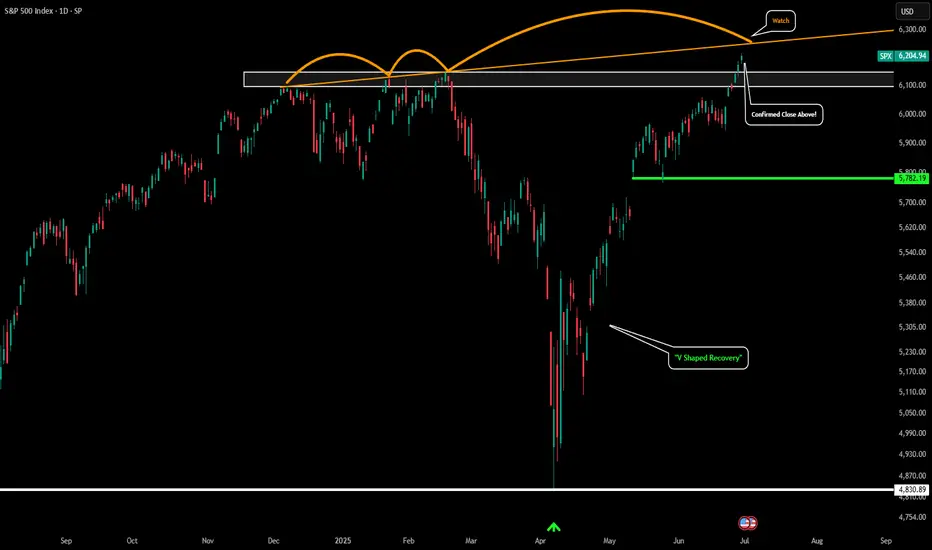
S&P 500 - Confirmed New All Time HighPlease refer to our last post:
The S&P could now be gearing up for the run towards our 1.618 extension around $7k.
We just had a confirmed daily candle breakout above our white box which we have been eyeing for so long. This is the first signal of a major ATH breakout rally for the S&P.
However there is only one thing that could potentially hinder this rally. That would be the orange trendline I have drawn. If price gets rejected somewhere along this orange trendline and price falls back below the white box that would signal a few warning signs. The first would be a failed breakout and the second would be a massive bearish divergence forming on the HTF. With higher highs in price but strength continuing to get weaker keep an eye out for that.
So far things just look great, but just wanted to point that out as a potential scenario.
Market indices
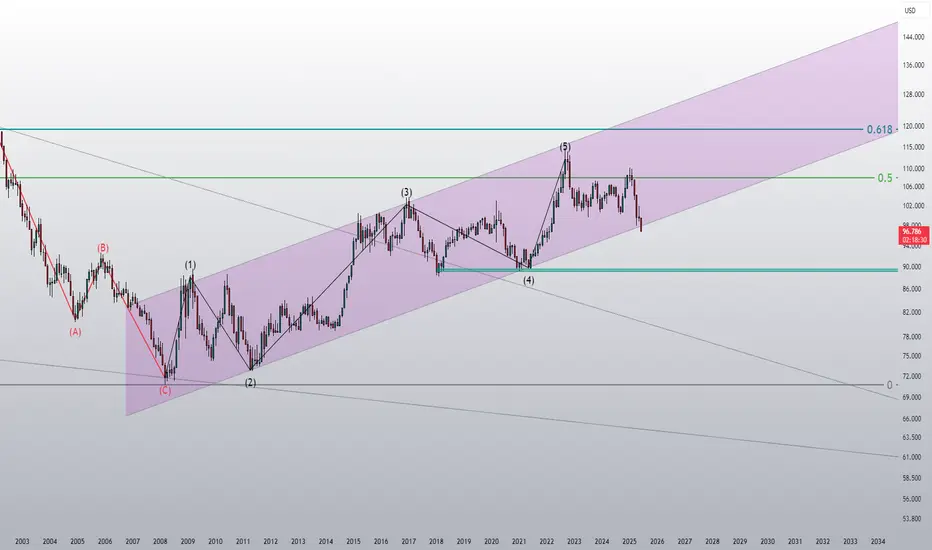
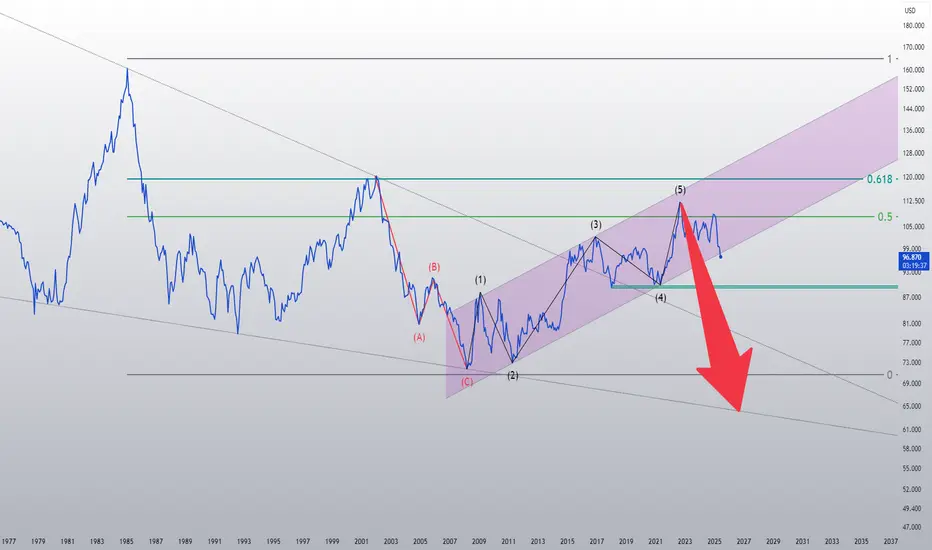
This look promising for Crypto!The DXY breaking below its trend channel is a really positive sign for risk assets like Bitcoin and Altcoins. Usually, a weak dollar means more money flows into risk assets. The DXY's technical target is 89, which is the level to watch for the end of the crypto bull run.
The fate has already been written, it's in your hands Neo. ;)Fate has already been written and their is no return, get ready ;)
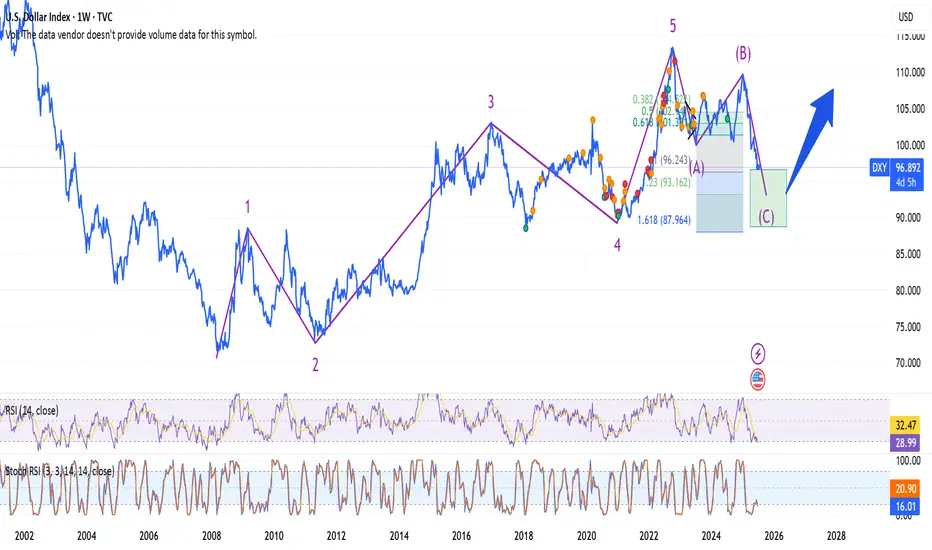
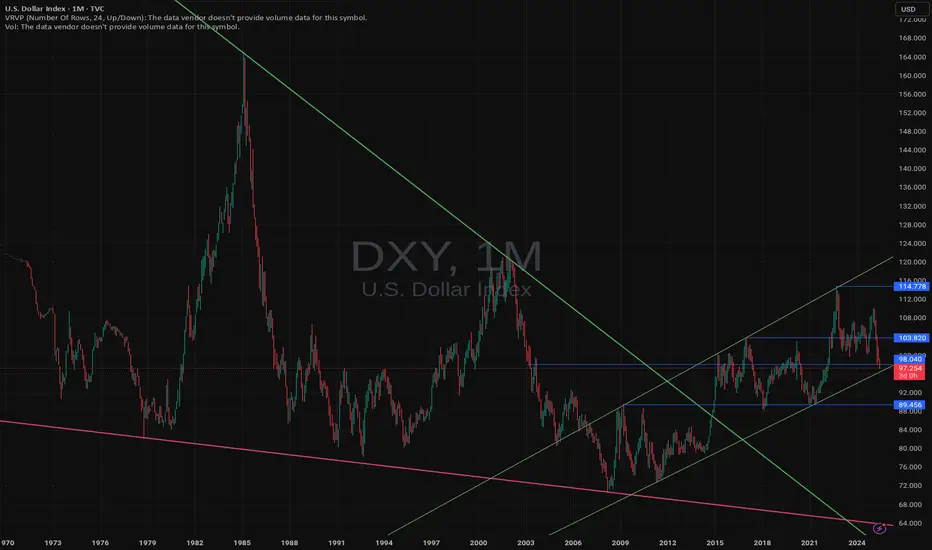
The DXY looks doomedI drew this chart in September 2022. Now, almost three years later, the DXY has broken below its channel.
Overfitting Will Break Your Strategy — Here’s Why█ Why Your Backtest Lies: A Quant’s Warning to Retail Traders
As a quant coder, I’ve seen it time and again: strategies that look flawless in backtests but fall apart in live markets.
Why? One word: overfitting.
Compare the signals in the images below. They’re from the same system, but one is overfitted, showing how misleading results can look when tuned too perfectly to the past.
⚪ Overfitting is what happens when you push a strategy to perform too well on historical data. You tweak it, optimize it, and tune every rule until it fits the past perfectly, including every random wiggle and fluke.
To retail traders, the result looks like genius. But to a quant, it’s a red flag .
█ Trading strategy developers have long known that “curve-fitting” a strategy to historical data (overfitting) creates an illusion of success that rarely holds up in live markets. Over-optimizing parameters to perfectly fit past price patterns may produce stellar backtest results, but it typically does not translate into real profits going forward.
In fact, extensive research and industry experience show that strategies tuned to past noise almost inevitably disappoint out-of-sample.
The bottom line: No one succeeds in markets by relying on a strategy that merely memorized the past — such “perfect” backtests are fool’s gold, not a future edge.
█ The Illusion of a Perfect Backtest
Overfitted strategies produce high Sharpe ratios, beautiful equity curves, and stellar win rates — in backtests. But they almost never hold up in the real world.
Because what you’ve really done is this:
You built a system that memorized the past, instead of learning anything meaningful about how markets work.
Live market data is messy, evolving, and unpredictable. An overfit system, tuned to every quirk of history, simply can’t adapt.
█ A Warning About Optimization Tools
There are many tools out there today — no-code platforms, signal builders, optimization dashboards — designed to help retail traders fine-tune and "optimize" their strategies.
⚪ But here’s the truth:
I can't stress this enough — do not rely on these tools to build or validate your strategy.
They make it easy to overfit.
They encourage curve-fitting.
They give false hope and lead to false expectations about how markets actually work.
⚪ The evidence is overwhelming:
Decades of academic research and real-world results confirm that over-optimized strategies fail in live trading. What looks good in backtests is often just noise, not edge.
This isn’t something I’ve made up or a personal theory.
It’s a well-documented, widely accepted fact in quantitative finance, supported by decades of peer-reviewed research and real-world results. The evidence is overwhelming. It’s not a controversial claim — it’s one of the most agreed-upon truths in the field.
█ Why Overfitting Fails
Let me explain it like I do to newer coders:
Random patterns don’t repeat: The patterns your strategy "learned" were noise. They won't show up again.
Overfitting kills the signal: Markets have a low signal-to-noise ratio. Fitting the noise means you've buried the signal.
Markets change: That strategy optimized for low-volatility or bull markets? It breaks in new regimes.
You tested too many ideas: Try enough combinations, and something will look good by accident. That doesn’t make it predictive.
█ The Research Backs It Up
Quantopian’s 888-strategy study:
Sharpe ratios from backtests had almost zero predictive power for live returns.
The more a quant optimized a strategy, the worse it performed live.
Bailey & López de Prado’s work:
After testing enough variations, you’re guaranteed to find something that performs well by chance, even if it has no edge.
█ My Advice to Retail Traders
If your strategy only looks great after a dozen tweaks… It’s probably overfit.
If you don’t validate on out-of-sample data… you’re fooling yourself.
If your equity curve is “too good” to be true… it probably is.
Real strategies don’t look perfect — they look robust. They perform decently across timeframes, markets, and conditions. They don’t rely on lucky parameter combos or obscure filters.
█ What to Do Instead
Use out-of-sample and walk-forward testing
Stick to simpler logic with fewer parameters
Ground your system in market rationale, not just stats
Risk management over performance maximization
Expect drawdowns and variability
Treat backtest performance as a rough guide, not a promise
Overfitting is one of the biggest traps in strategy development.
If you want your trading strategy to survive live markets, stop optimizing for the past. Start building for uncertainty. Because the market doesn’t care how well your model memorized history. It cares how well it adapts to reality.
-----------------
Disclaimer
The content provided in my scripts, indicators, ideas, algorithms, and systems is for educational and informational purposes only. It does not constitute financial advice, investment recommendations, or a solicitation to buy or sell any financial instruments. I will not accept liability for any loss or damage, including without limitation any loss of profit, which may arise directly or indirectly from the use of or reliance on such information.
All investments involve risk, and the past performance of a security, industry, sector, market, financial product, trading strategy, backtest, or individual's trading does not guarantee future results or returns. Investors are fully responsible for any investment decisions they make. Such decisions should be based solely on an evaluation of their financial circumstances, investment objectives, risk tolerance, and liquidity needs.
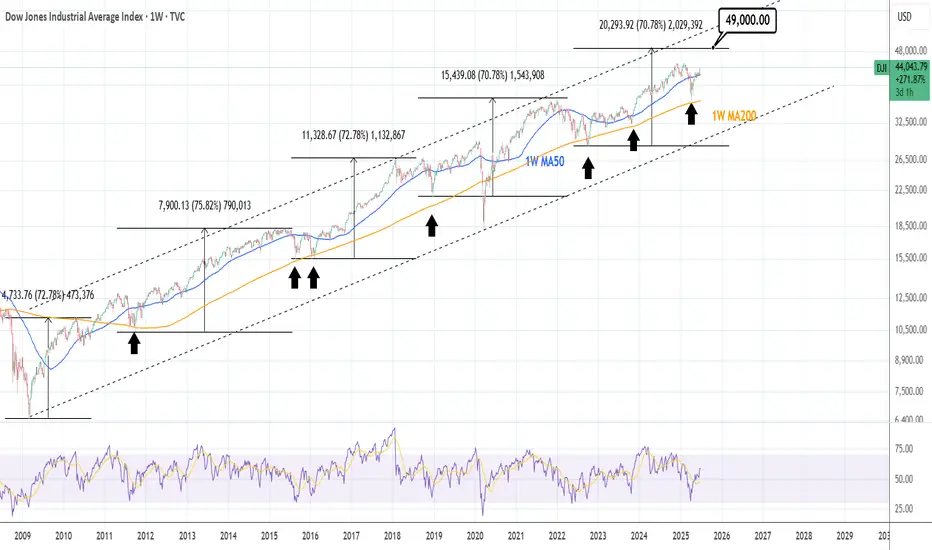
DOW JONES: Final phase of bullish wave has started.Dow is practically overbought on its 1D technical outlook (RSI = 69.306, MACD = 518.450, ADX = 36.217) but that should little affect the heavily bullish price action on the long term. The reason is that after the April bounce on the 1W MA200, Dow entered the final phase of the Bull Cycle that started on the October 2022 bottom and according to all prior bullish waves inside the 16 year Channel Up, it should rise by a minimum of +71%. That gives a TP = 49,000.
## If you like our free content follow our profile to get more daily ideas. ##
## Comments and likes are greatly appreciated. ##
DXY USD Dollar Bearish Short term, then bullishI am not a financial advisor. This is not meant to be and does not constitute financial, investment, trading, or any other types of advice or recommendation.
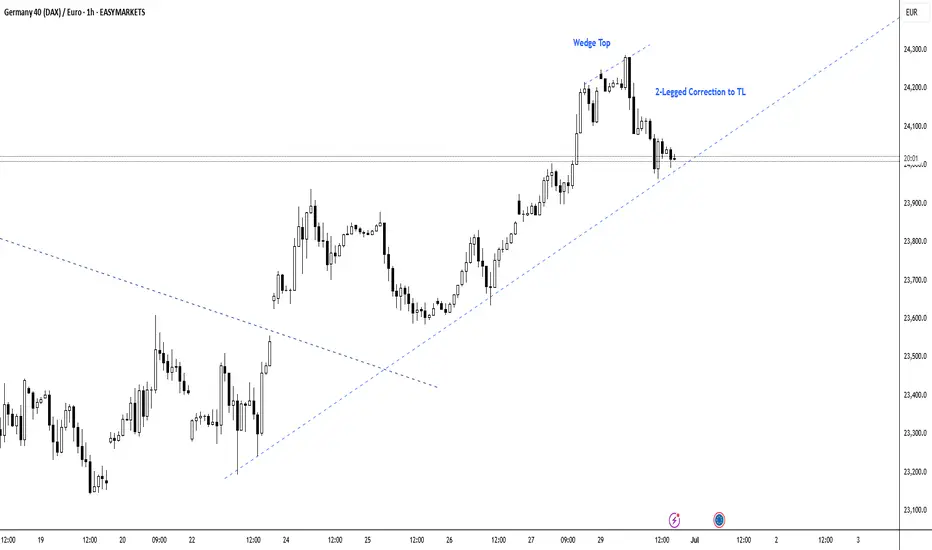
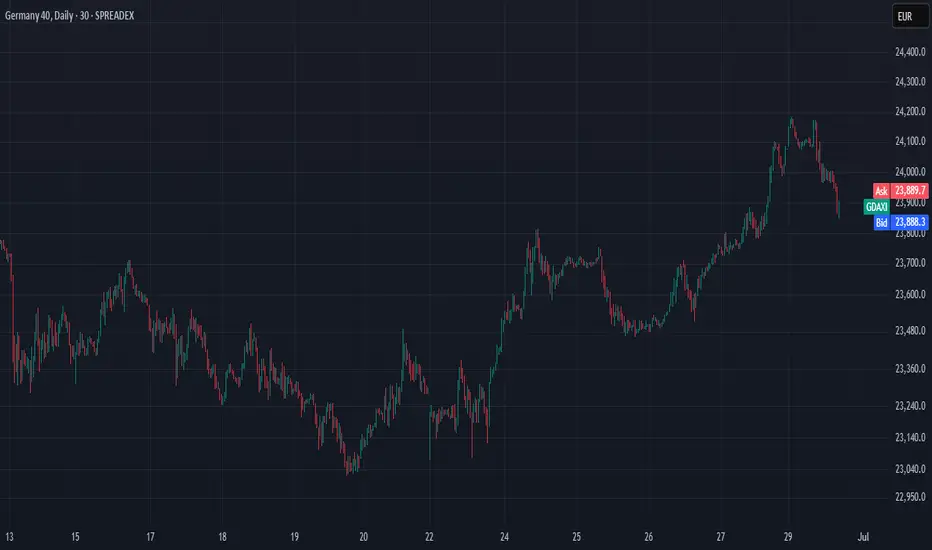
DAX Long Position ManagementI'm long on DAX since last week, but market made a sharp and strong correction today. Bears showed a lot of strength today, so tomorrow is going to be key.
If the market bounces of the bull trendline me might see another leg up to the previous high. But given the strength of this pullback, the probability of getting to the All Time High in the next few days is much lower than I thought. This way, I'm watching closely to see if the market is going to bounce. Even if it does, if the momentum is not extremely strong, I'll be trailing my SL and exit with a smaller profit.
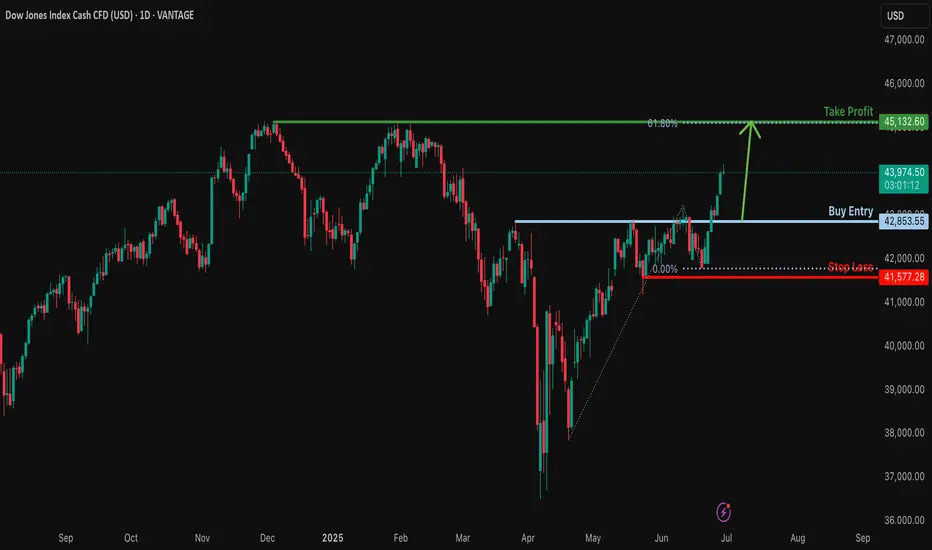
Bullish momentum to extend?DJ30 is falling towards the support level which is a pullback support and could bounce from this level to our take profit.
Entry: 42,853.55
Why we like it:
There is a pullback support level.
Stop loss: 41,577.28
Why we like it:
There is a pullback support level.
Take profit: 45,132.60
Why we like it:
There is a pullback resistance that lines up with the 61.8% Fibonacci projection.
Enjoying your TradingView experience? Review us!
Please be advised that the information presented on TradingView is provided to Vantage (‘Vantage Global Limited’, ‘we’) by a third-party provider (‘Everest Fortune Group’). Please be reminded that you are solely responsible for the trading decisions on your account. There is a very high degree of risk involved in trading. Any information and/or content is intended entirely for research, educational and informational purposes only and does not constitute investment or consultation advice or investment strategy. The information is not tailored to the investment needs of any specific person and therefore does not involve a consideration of any of the investment objectives, financial situation or needs of any viewer that may receive it. Kindly also note that past performance is not a reliable indicator of future results. Actual results may differ materially from those anticipated in forward-looking or past performance statements. We assume no liability as to the accuracy or completeness of any of the information and/or content provided herein and the Company cannot be held responsible for any omission, mistake nor for any loss or damage including without limitation to any loss of profit which may arise from reliance on any information supplied by Everest Fortune Group.
SPX500 Detailed Trading Game Plan🎯 Current Market Context:
Current Price: 6,000 (Approx.)
Trend: Bullish; forming higher highs and higher lows.
Key Technical Observations:
Strong support and trendline respecting bullish structure.
Fibonacci confluence points towards potential upside momentum continuation.
Volume Profile indicating key levels at 5,950–6,000.
🚦 Trading Scenarios & Probabilistic Setups:
🟢 Scenario A (High Probability Long Trade ~65%):
Entry Zone: Current Levels (6,000–5,950) or retest to 5,863 support.
Stop Loss: Below 5,709 (critical structural support).
Targets:
Primary: 6,262 (100% Fibonacci Extension)
Secondary: 6,460 (Key Horizontal Resistance)
Risk-to-Reward: Favorable (~1:3)
🟡 Scenario B (Medium Probability Short Trade ~45%):
Entry Zone: 6,460–6,500 (strong resistance confluence)
Stop Loss: Above 6,600 (clear invalidation)
Targets:
Primary: 6,100 (structural retest)
Secondary: 5,950–5,863 (previous support zone)
Risk-to-Reward: Good (~1:2)
🔴 Scenario C (Low Probability but High Reward Long Trade ~35%):
Entry Zone: Deep retracement at ~5,408–5,106
(Invalidated if price breaks below 5,107.)
Stop Loss: Below 5,107 (firm invalidation)
Targets:
Primary: 5,950 (key resistance)
Extended: 6,460–7,176 (long-term bullish target)
Risk-to-Reward: Excellent (~1:5+), but lower likelihood of triggering.
📊 Probability & Risk Management Summary:
Scenario Probability Risk Reward Potential
A (Long) 65% ✅ Moderate High
B (Short) 45% ⚠️ Moderate Moderate
C (Long Deep) 35% ❗ Lower Very High
⚙️ Recommended Approach:
Primary Strategy: Bullish Continuation (Scenario A) due to current market structure and volume profile confirmation.
Secondary Consideration: Watch closely for Short Setup (Scenario B) only upon clear resistance signals.
Contingency Setup: Deep retracement (Scenario C) provides excellent value entry if fundamentals trigger a major correction.
🛠 Trade Management Tips:
Position Size according to scenario probabilities. Allocate larger sizing to Scenario A, cautious sizing for Scenario B, and small, speculative sizing for Scenario C.
Trailing Stops: As price approaches targets, adjust stops to lock profits progressively.
🗓 Timeline & Key Levels for Reference:
Immediate actionable trades: Scenario A (Long) setup at current levels.
Monitor closely by Mid-August 2025 for Scenario B potential short setup.
Watch closely for deep retracement scenario by November 2025 if substantial correction occurs.
🚨 Important Note: Always adjust your trades dynamically based on evolving macroeconomic and geopolitical news. These probabilities are guidelines—not certainties.
⚠️ Disclaimer:
Trading involves substantial risk and is not suitable for every investor. The information provided is purely for educational and informational purposes and does not constitute financial advice, a recommendation, or solicitation to buy or sell any financial instrument. Always perform your own analysis, consider your financial situation and risk tolerance, and consult with a qualified financial advisor before executing trades. Past performance does not guarantee future results. You alone bear the full responsibility for any investment decision you make.
Stay disciplined, trade wisely, and good luck! 🍀📊

$DXY Looks like a long.If the TVC:DXY can hold this trend line, it would suggest a bounce back up to the resistance.
makes sense if the yields end up higher at some point.
Will see
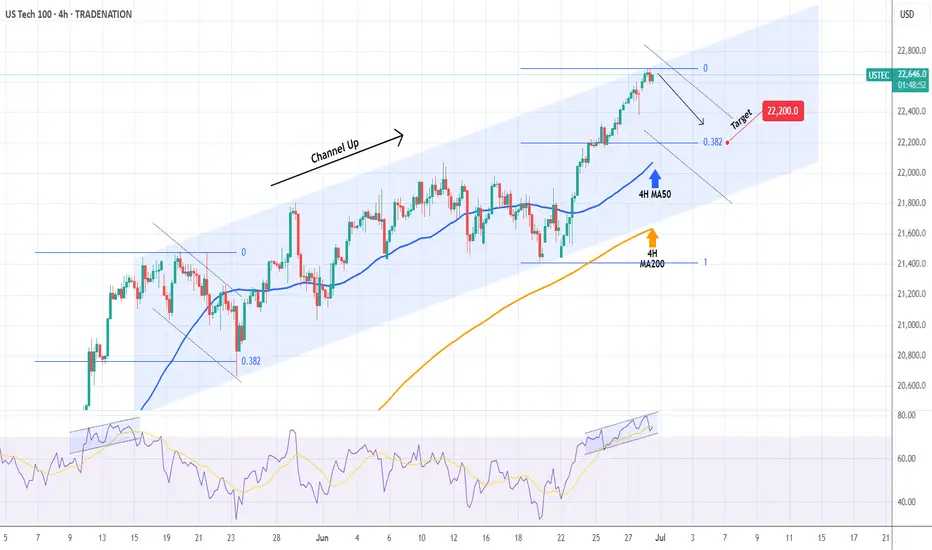
NASDAQ Possible short-term pull-back.Last time we analyzed Nasdaq (NDX) was a week ago (June 23, see chart below), giving a comfortable buy signal as the price was rebounding at the bottom of the 6-week Channel Up:
The price hit our 22300 Target and has now touched the top of the Channel Up. Based on the 4H RSI, it resembles the May 15 price action, which soon after pulled back to the 0.382 Fibonacci retracement level.
It is possible to see such relief profit taking on the short-term and a test of 22200 (Fib 0.382).
-------------------------------------------------------------------------------
** Please LIKE 👍, FOLLOW ✅, SHARE 🙌 and COMMENT ✍ if you enjoy this idea! Also share your ideas and charts in the comments section below! This is best way to keep it relevant, support us, keep the content here free and allow the idea to reach as many people as possible. **
-------------------------------------------------------------------------------
Disclosure: I am part of Trade Nation's Influencer program and receive a monthly fee for using their TradingView charts in my analysis.
💸💸💸💸💸💸
👇 👇 👇 👇 👇 👇
DXY Game Plan - USD IndexIt is important to watch the DXY to understand the strength of the USD across global markets.
The DXY is a key index that reflects the U.S. dollar’s dominance in foreign exchange. Therefore, tracking it can provide valuable insights into the potential direction of all major asset classes.
In this post, I’ll break down both technical and fundamental expectations.
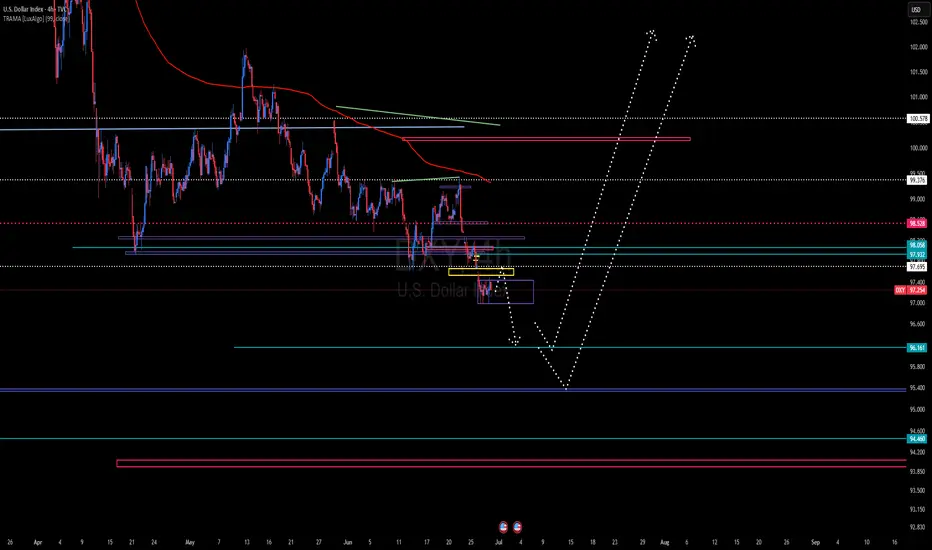
Technical Analysis
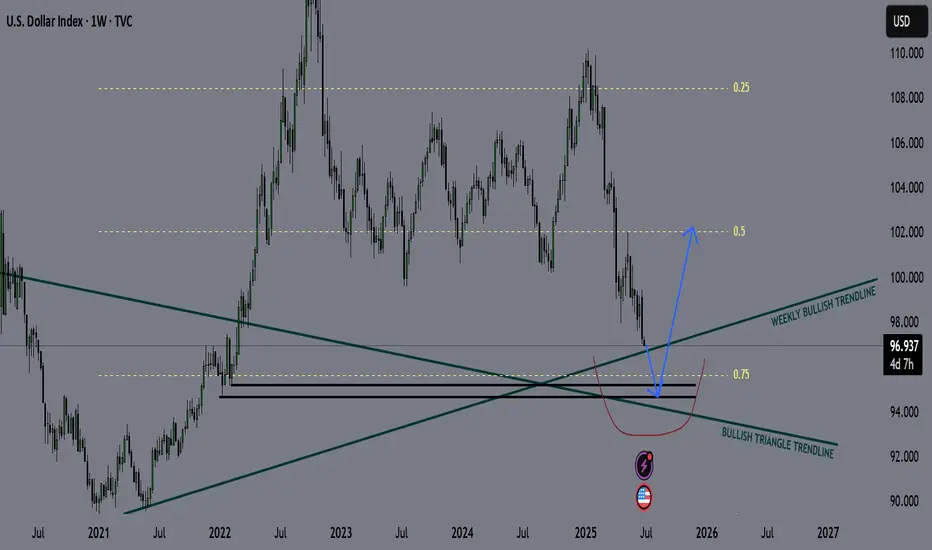
DXY has been in a retracement phase (bearish) since January 2025. During this time, we’ve seen EUR and other major forex pairs form strong bullish trends.
Currently, the DXY is approaching a weekly bullish trendline, where I expect a potential bounce.
Additionally, DXY is trading within a discount zone (below the 0.5 Fibonacci level, also known as equilibrium). Personally, I’m watching for a deeper move into the maximum discount zone (around the 0.75 Fib level).
This area also aligns with key liquidity concepts. Ideally, I want to see a deviation below the bullish trendline, with a sweep of one of the weekly liquidity levels marked on the chart (two black horizontal lines).
I'm not relying on a clean triangle trendline retest, but it's a possibility.
Game Plan
DXY taps the bullish trendline
Deviates below it, running weekly liquidity (black lines)
Hits the max discount zone (~0.75 Fib)
Then shows signs of reversal and strength
Once that setup completes, I’ll be expecting strong USD performance, and will look to short risk assets — including stocks and major forex pairs.
Fundamental Analysis
The Federal Reserve is currently resisting pressure to cut interest rates, while Trump is vocally pushing for rate cuts.
The market is already pricing in a 79% probability of a September rate cut (source: CME FedWatch Tool), so if that happens as expected, I don’t anticipate major market reaction.
However, a surprise rate cut in July would likely trigger a flash crash in DXY/USD — though based on my game plan, I would expect a V-shaped recovery shortly afterward.
EUR, GBP, AUD, and CAD have also hit key resistance zones, so I believe we're likely to see USD strength for a while.
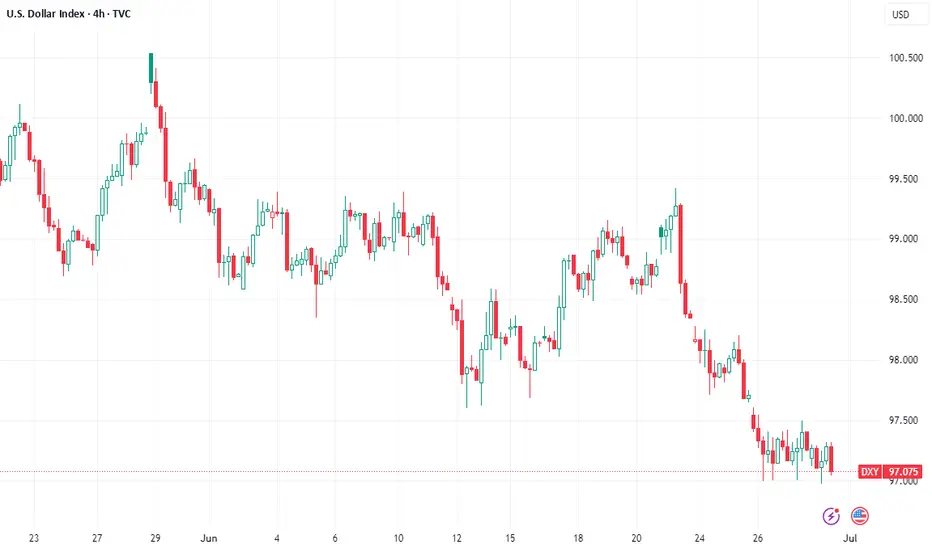
DXY Outlook: Mild Bearish Movement Anticipated 4hrThe DXY (US Dollar Index) appears to be entering a mild bearish phase, with a potential move down from the 97.721 level. Based on current momentum and technical indicators, it is likely to approach key support zones between 96.22 and 96.00, where a bullish reversal could potentially occur.
However, there is a reasonable chance the market could extend its decline beyond these levels, possibly reaching as low as 95.404 before finding a more stable support base.
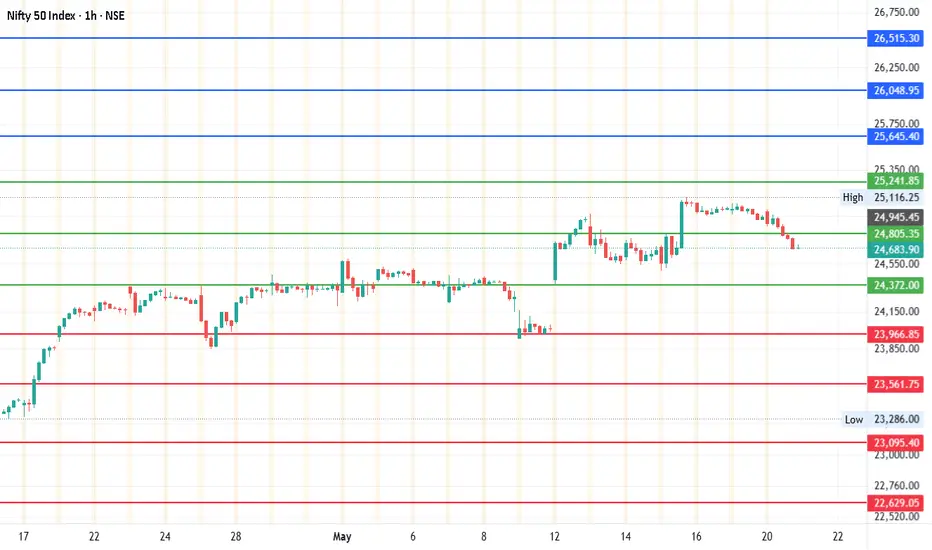
#Nifty - 1500 Points Move Expected?Date: 20-05-2025
#Nifty Current Price: 24683.9
Mid-Point: 24805.35
Upside Targets: 25645.39, 26048.95, 26515.30 and 26981.65
Downside Targets: 23966.86, 23561.75, 23095.40 and 22629.05
Support: 24371.97
Resistance: 25241.83
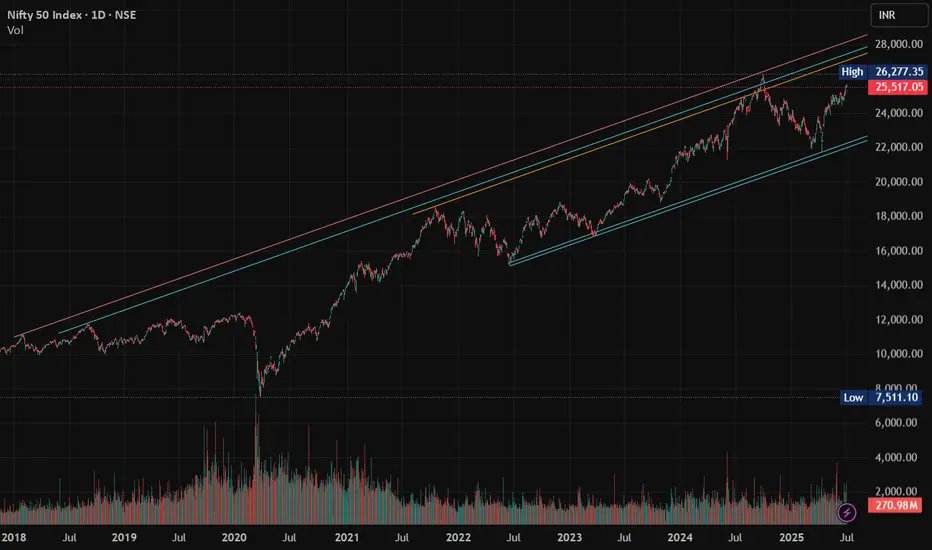
nifty view .. bullish nifty is in bullish cahnnel. itmay touch 26180 , 27000, 27254 ,27861 by the end of 2026 or mid 2027.
enjoy 27000 crossing in 2027
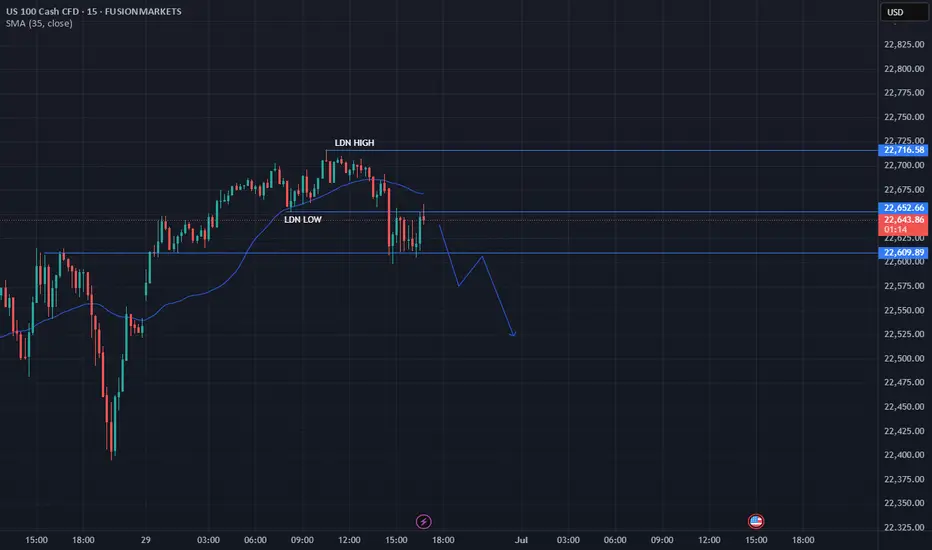
Bullish BiasMarked the LDN highs and lows, Waited for the sweep of sell side liquidity on LDN lows, waiting for BOS and CHoCH and FVG before we enter buys back to the SSL at the London highs.

Economic Red Alert: China Dumps $8.2T in US BondsThe Great Unwinding: How a World of Excess Supply and Fading Demand Is Fueling a Crisis of Confidence
The global financial system, long accustomed to the steady hum of predictable economic cycles, is now being jolted by a dissonant chord. It is the sound of a fundamental paradigm shift, a tectonic realignment where the twin forces of overwhelming supply and evaporating demand are grinding against each other, creating fissures in the very bedrock of the world economy. This is not a distant, theoretical threat; its tremors are being felt in real-time. The most recent and dramatic of these tremors was a stark, headline-grabbing move from Beijing: China’s abrupt sale of $8.2 trillion in U.S. Treasuries, a move that coincided with and exacerbated a precipitous decline in the U.S. dollar. While the sale itself is a single data point, it is far more than a routine portfolio adjustment. It is a symptom of a deeper malaise and a powerful accelerant for a crisis of confidence that is spreading through the arteries of global finance. The era of easy growth and limitless demand is over. We have entered the Great Unwinding, a period where the cracks from years of excess are beginning to show, and the consequences will be felt broadly, from sovereign balance sheets to household budgets.
To understand the gravity of the current moment, one must first diagnose the core imbalance plaguing the global economy. It is a classic, almost textbook, economic problem scaled to an unprecedented global level: a glut of supply crashing against a wall of weakening demand. This imbalance was born from the chaotic response to the COVID-19 pandemic. In 2020 and 2021, as governments unleashed trillions in fiscal stimulus and central banks flooded the system with liquidity, a massive demand signal was sent through the global supply chain. Consumers, flush with cash and stuck at home, ordered goods at a voracious pace. Companies, believing this trend was the new normal, ramped up production, chartered their own ships, and built up massive inventories of everything from semiconductors and furniture to automobiles and apparel. The prevailing logic was that demand was insatiable and the primary challenge was overcoming supply-side bottlenecks.
Now, the bullwhip has cracked back with a vengeance. The stimulus has faded, and the landscape has been radically altered by the most aggressive coordinated monetary tightening in modern history. Central banks, led by the U.S. Federal Reserve, hiked interest rates at a blistering pace to combat the very inflation their earlier policies had helped fuel. The effect has been a chilling of economic activity across the board. Demand, once thought to be boundless, has fallen off a cliff. Households, their pandemic-era savings depleted and their purchasing power eroded by stubborn inflation, are now contending with cripplingly high interest rates. The cost of financing a home, a car, or even a credit card balance has soared, forcing a dramatic retrenchment in consumer spending. Businesses, facing the same high borrowing costs, are shelving expansion plans, cutting capital expenditures, and desperately trying to offload the mountains of inventory they accumulated just a year or two prior.
This has created a world of profound excess. Warehouses are overflowing. Shipping rates have collapsed from their pandemic peaks. Companies that were once scrambling for microchips are now announcing production cuts due to a glut. This oversupply is deflationary in nature, putting immense downward pressure on corporate profit margins. Businesses are caught in a vise: their costs remain elevated due to sticky wage inflation and higher energy prices, while their ability to pass on these costs is vanishing as consumer demand evaporates. This is the breeding ground for the "cracks" that are now becoming visible. The first casualties are the so-called "zombie companies"—firms that were only able to survive in a zero-interest-rate environment by constantly refinancing their debt. With borrowing costs now prohibitively high, they are facing a wave of defaults. The commercial real estate sector, already hollowed out by the work-from-home trend, is buckling under the weight of maturing loans that cannot be refinanced on favorable terms. Regional banks, laden with low-yielding, long-duration bonds and exposed to failing commercial property loans, are showing signs of systemic stress. The cracks are not isolated; they are interconnected, threatening a chain reaction of deleveraging and asset fire sales.
It is against this precarious backdrop of a weakening U.S. economy and a global supply glut that China’s sale of U.S. Treasuries must be interpreted. The move is not occurring in a vacuum. It is a calculated action within a deeply fragile geopolitical and economic context, and it carries multiple, overlapping meanings. On one level, it is a clear continuation of China’s long-term strategic objective of de-dollarization. For years, Beijing has been wary of its deep financial entanglement with its primary geopolitical rival. The freezing of Russia’s foreign currency reserves following the invasion of Ukraine served as a stark wake-up call, demonstrating how the dollar-centric financial system could be weaponized. By gradually reducing its holdings of U.S. debt, China seeks to insulate itself from potential U.S. sanctions and chip away at the dollar's status as the world's undisputed reserve currency. This $8.2 trillion sale is another deliberate step on that long march.
However, there are more immediate and tactical motivations at play. China is grappling with its own severe economic crisis. The nation is battling deflation, a collapsing property sector, and record-high youth unemployment. In this environment, its primary objective is to stabilize its own currency, the Yuan, which has been under intense downward pressure. A key strategy for achieving this is to intervene in currency markets. Paradoxically, this intervention often requires selling U.S. Treasuries. The process involves the People's Bank of China selling its Treasury holdings to obtain U.S. dollars, and then selling those dollars in the open market to buy up Yuan, thereby supporting its value. So, while the headline reads as an attack on U.S. assets, it is also a sign of China's own domestic weakness—a desperate measure to defend its own financial stability by using its vast reserves.
Regardless of the primary motivation—be it strategic de-dollarization or tactical currency management—the timing and impact of the sale are profoundly significant. It comes at a moment of peak vulnerability for the U.S. dollar and the Treasury market. The dollar has been extending massive losses not because of China’s actions alone, but because the underlying fundamentals of the U.S. economy are deteriorating. Markets are increasingly pricing in a pivot from the Federal Reserve, anticipating that the "cracks" in the economy will force it to end its tightening cycle and begin cutting interest rates sooner rather than later. This expectation of lower future yields makes the dollar less attractive to foreign investors, causing it to weaken against other major currencies.
China’s sale acts as a powerful accelerant to this trend. The U.S. Treasury market is supposed to be the deepest, most liquid, and safest financial market in the world. It is the bedrock upon which the entire global financial system is built. When a major creditor like China becomes a conspicuous seller, it sends a powerful signal. It introduces a new source of supply into a market that is already struggling to absorb the massive amount of debt being issued by the U.S. government to fund its budget deficits. This creates a dangerous feedback loop. More supply of Treasuries puts downward pressure on their prices, which in turn pushes up their yields. Higher Treasury yields translate directly into higher borrowing costs for the entire U.S. economy, further squeezing households and businesses, deepening the economic slowdown, and increasing the pressure on the Fed to cut rates, which in turn further weakens the dollar. China’s action, therefore, pours fuel on the fire, eroding confidence in the very asset that is meant to be the ultimate safe haven.
The contagion from this dynamic—a weakening U.S. economy, a falling dollar, and an unstable Treasury market—will not be contained within American borders. The cracks will spread globally, creating a volatile and unpredictable environment for all nations. For emerging markets, the situation is a double-edged sword. A weaker dollar is traditionally a tailwind for these economies, as it reduces the burden of their dollar-denominated debts. However, this benefit is likely to be completely overshadowed by the collapse in global demand. As the U.S. and other major economies slow down, their demand for raw materials, manufactured goods, and services from the developing world will plummet, devastating the export-driven models of many emerging nations. They will find themselves caught between lower debt servicing costs and a collapse in their primary source of income.
For other developed economies like Europe and Japan, the consequences are more straightforwardly negative. A rapidly falling dollar means a rapidly rising Euro and Yen. This makes their exports more expensive and less competitive on the global market, acting as a significant drag on their own already fragile economies. The European Central Bank and the Bank of Japan will find themselves in an impossible position. If they cut interest rates to weaken their currencies and support their exporters, they risk re-igniting inflation. If they hold rates firm, they risk allowing their currencies to appreciate to levels that could push their economies into a deep recession. This currency turmoil, originating from the weakness in the U.S., effectively exports America’s economic problems to the rest of the world.
Furthermore, the instability in the U.S. Treasury market has profound implications for every financial institution on the planet. Central banks, commercial banks, pension funds, and insurance companies all hold U.S. Treasuries as their primary reserve asset. The assumption has always been that this asset is risk-free and its value is stable. The recent volatility and the high-profile selling by a major state actor challenge this core assumption. This forces a global repricing of risk. If the "risk-free" asset is no longer truly risk-free, then the premium required to hold any other, riskier asset—from corporate bonds to equities—must increase. This leads to a tightening of financial conditions globally, starving the world economy of credit and investment at the precise moment it is most needed.
In conclusion, the abrupt sale of $8.2 trillion in U.S. Treasuries by China is far more than a fleeting headline. It is a critical data point that illuminates the precarious state of the global economy. It is a manifestation of the Great Unwinding, a painful transition away from an era of limitless, debt-fueled demand and toward a new reality defined by excess supply, faltering consumption, and escalating geopolitical friction. The underlying cause of this instability is the deep imbalance created by years of policy missteps, which have left the world with a glut of goods and a mountain of debt. The weakening U.S. economy and the resulting slide in the dollar are the natural consequences of this imbalance. China’s actions serve as both a symptom of this weakness and a catalyst for a deeper crisis of confidence in the U.S.-centric financial system. The cracks are no longer hypothetical; they are appearing in the banking sector, in corporate credit markets, and now in the bedrock of the system itself—the U.S. Treasury market. The tremors from this shift will be felt broadly, ushering in a period of heightened volatility, economic pain, and a fundamental reordering of the global financial landscape.
Technical Weekly AnalysisStart your week by identifying the key price levels and trends.
The SpreadEx Research team has analysed the most popular markets, including stocks, indices, commodities & forex.
--------------------------------------------------------------------------------------------------------------
Analysis
Germany 40 is neutral and ranging, eyeing a possible breakout. It trades at 24,021, close to its VWAP of 23,601. The RSI at 58 shows mild bullish bias. Support is at 22,882 and resistance at 24,320.
UK 100 is also in a neutral range phase, trading at 8,791 just under the VWAP of 8,833 - still with 9k on the horizon. RSI sits at 52, indicating balance. Key support lies at 8,731, with resistance at 8,916.
Wall Street has broken out above 43k into a new bullish phase. It’s trading at 44,032, significantly above its VWAP of 42,673. RSI at 71 confirms strong upward momentum. Support is at 41,379, resistance is being tested now.
Brent Crude is currently in a neutral range phase, trading at 6,699 having slumped back below its VWAP of 7,063. The RSI at 45 signals low momentum. Support is noted at 6,206, with resistance at 7,919.
Gold is moving sideways in a neutral range, drifting lower after a failed breakout over 3,400, priced at 3,293 with VWAP at 3,349. RSI is soft at 44. Support comes in at 3,252 and resistance at 3,446.
EUR/USD is bullish and breaking out - with the 1.20 handle in sight. It trades at 1.1722, easily above the VWAP of 1.1552. RSI at 71 reflects strong buying pressure. Support is at 1.1349, resistance at 1.1730.
GBP/USD is bullish and moving impulsively. It trades at 1.3700, above the VWAP of 1.3559. RSI at 63 signals steady upward momentum. Support sits at 1.3358, and resistance at 1.3761.
USD/JPY is neutral and ranging, trading at 144.13 slightly below VWAP at 144.87. The RSI is weak at 46. Support via May & June lows is only just below with the 2 s.d. of the VWAP at 143.42, while resistance is higher at 146.32.
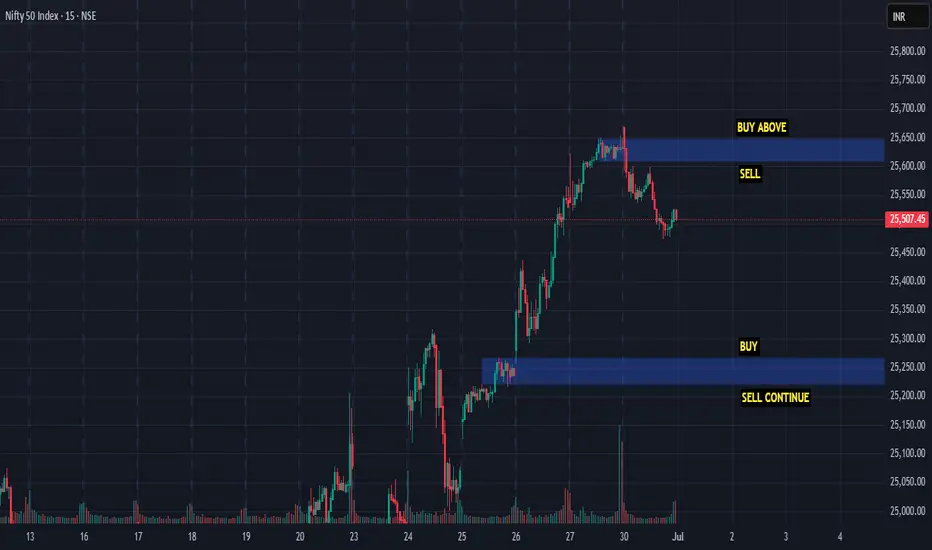
NIFTY Short Term View <25650-25200>If you follow my other ideas, I think you are gaining trust on the tool ZZ. Please don't blindly follow me and my posts. I just want to make you curios that one tool with clear idea is enough to predict the market. But condition is you have to practice a ton.
Here I am sharing just glimpse of it, there are so many things to do with ZZ.
Keep learning || Trust analysis || Keep Trading & Investing
Any question or suggestion please feel free to comment below.
NIFTY THIS WEEK? What's the plan
"There’s more hidden in a candle chart than most headlines will ever reveal.”
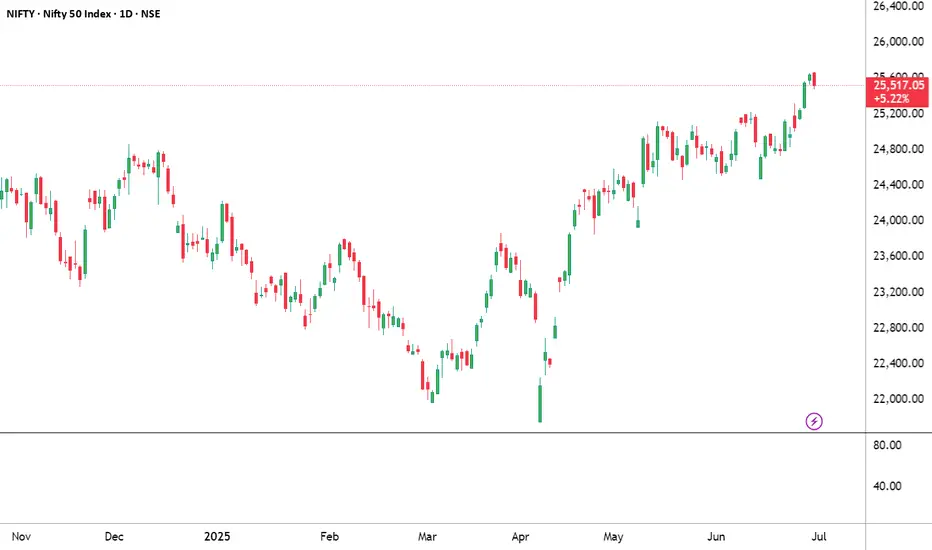
If you look at this NIFTY chart casually, you’ll see just another uptrend. But if you feel the price — really look into the structure — you’ll notice something deeper:
We’re not just in a rally. We’re in a breakout after base-building. And that’s a very different game.
What I Noticed This Week:
1. Strong Follow-Through
NIFTY didn’t just pop — it’s sustaining gains. Each green candle is following the next without hesitation. That means institutions are buying, not just retailers reacting.
2. Previous Resistance = Gone
Look back at 25,200–25,300. That zone rejected price multiple times. Now? It’s broken clean, with a bullish Marubozu-style candle. That’s a confirmation, not just a fluke.
3. No Panic Selling Yet
Usually, breakouts invite profit booking. This one? Sellers are quiet. When there's no rejection at new highs, it tells you confidence is strong.
But Here’s What You Must Watch:
Are we near psychological exhaustion? Markets can get euphoric and overextend - even in strong trends. Volume Spike or Divergence? If volumes dry or RSI starts diverging, stay alert.
Global cues & Bank Nifty:
If Bank Nifty stalls, NIFTY will slow too. Watch correlation.
What This Means for You:
Trend is strong, but smart traders plan exits in upmoves - not panic in downmoves.
Ask yourself:
Do you have entries based on structure?
Are you overexposed at highs, hoping for more?
Are you following momentum blindly or with plan?
Personal Reflection:
I’ve learned this the hard way:
“Buying strength is good. But riding strength without a stop loss is just greed in disguise.”
So this week:
Observe, don’t chase.
Track - don’t blindly enter.
There’s always another breakout. But there’s only one portfolio.
Nearly UK time to shine to 9,721Now it looks like it's UK time to shine.
It is priming for a strong breakout above the Cup and Handle.
Once it breaks the brim, it could be all upside to 9,721.
Large Cup and Handle
Price near above 20 and 200
Target 9,721
Disclosure: I am part of Trade Nation's Influencer program and receive a monthly fee for using their TradingView charts in my analysis.
