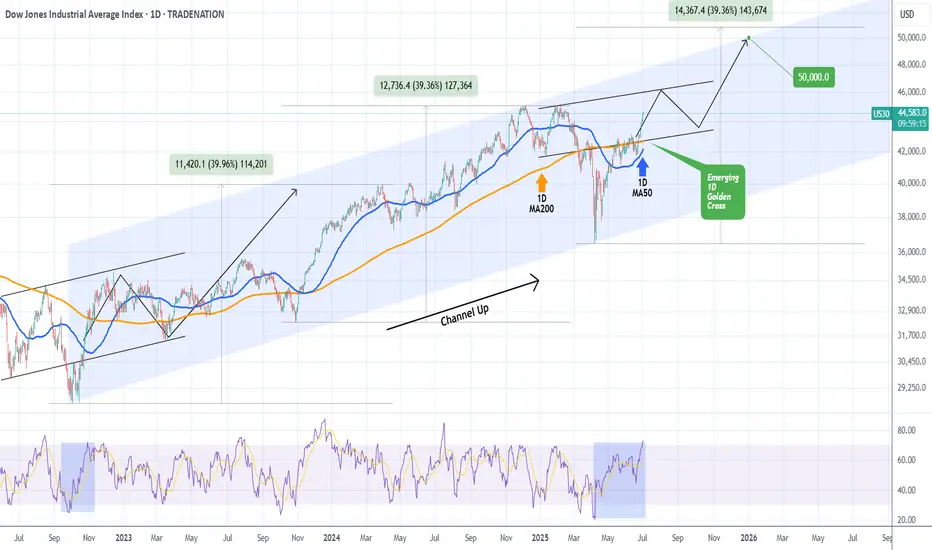
DOW JONES This is how it hits 50000 by the end of the year.Dow Jones (DJI) has been trading within a Channel Up pattern since the October 03 2022 market bottom and since the April 07 2025 Low, it's been unfolding the pattern's new Bullish Leg.
Ahead of an emerging 1D Golden Cross, the first since December 13 2022, the price action looks more bullish than ever strongly supported by the 1D MA50 (blue trend-line).
In fact, it is not that different from the fractal of that last 1D Golden Cross, which traded inside a neckline before the Bullish Leg broke upwards and completed eventually a +39.96% rise.
We expect a 50000 test towards the end of the year at the top of the Channel Up, which is still marginally below the tolerance levels of a +39.36% rise.
-------------------------------------------------------------------------------
** Please LIKE 👍, FOLLOW ✅, SHARE 🙌 and COMMENT ✍ if you enjoy this idea! Also share your ideas and charts in the comments section below! This is best way to keep it relevant, support us, keep the content here free and allow the idea to reach as many people as possible. **
-------------------------------------------------------------------------------
Disclosure: I am part of Trade Nation's Influencer program and receive a monthly fee for using their TradingView charts in my analysis.
💸💸💸💸💸💸
👇 👇 👇 👇 👇 👇
Market indices
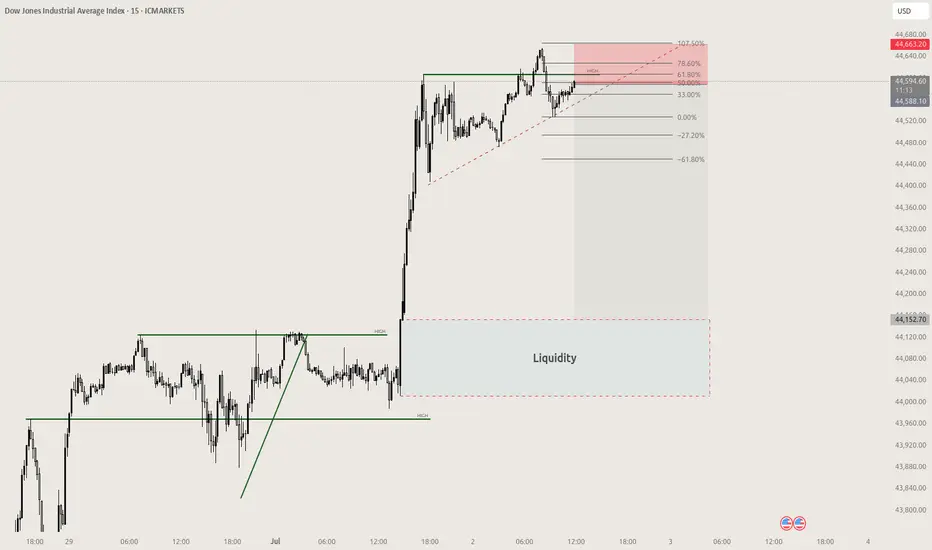
US30 Scalp short Swing failure patternSwing failure pattern with bearish FVG, wait for bearish candle confirmation, liquidity below
Potential long trade DAXRisk appetite seems to have returned to the market with most global indices reaching new all time highs. The DAX should be no exception to joining the long rally with tariff jitters become the least of investor worries. The overall trend on a daily chart and 4H are bullish. A clear break of the short-term retracement trendline should spark another bullish sequence the could create new highs.
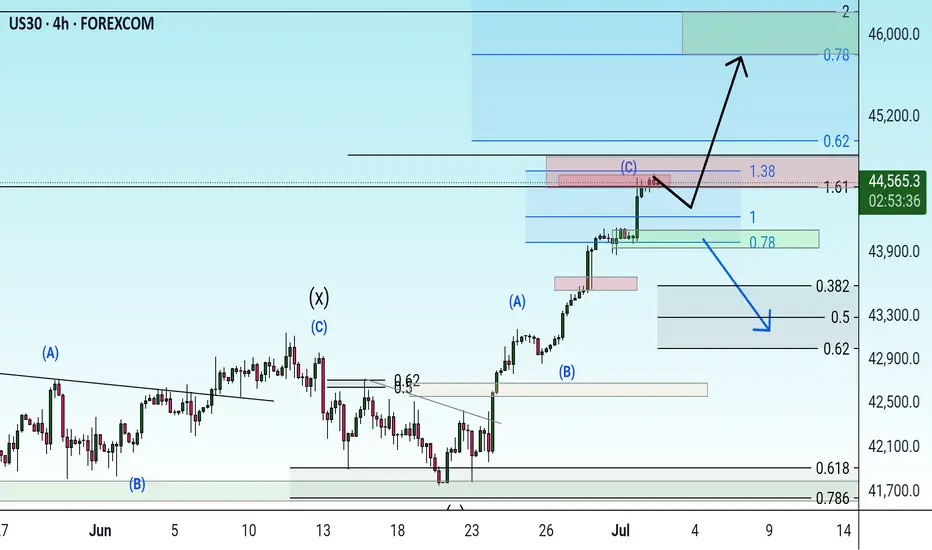
Possibility of uptrend It is expected that after some fluctuation and correction, the resistance area will be broken and the upward trend will continue. If the index crosses the green support area, a downward trend to the specified support levels will be possible.
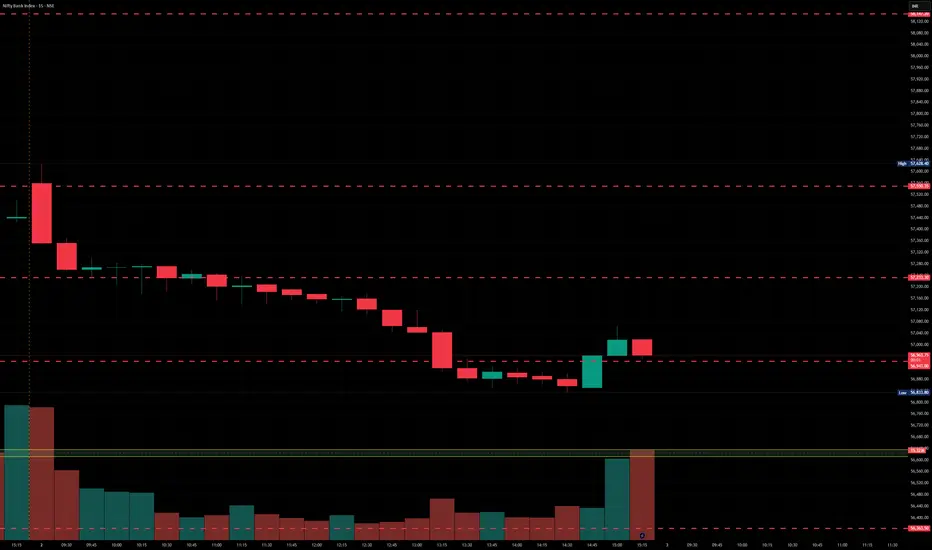
BankNifty levels - Jul 03, 2025Utilizing the support and resistance levels of BankNifty, along with the 5-minute timeframe candlesticks and VWAP, can enhance the precision of trade entries and exits on or near these levels. It is crucial to recognize that these levels are not static, and they undergo alterations as market dynamics evolve.
The dashed lines on the chart indicate the reaction levels, serving as additional points of significance. Furthermore, take note of the response at the levels of the High, Low, and Close values from the day prior.
We trust that this information proves valuable to you.
* If you found the idea appealing, kindly tap the Boost icon located below the chart. We encourage you to share your thoughts and comments regarding it.
Wishing you successful trading endeavors!
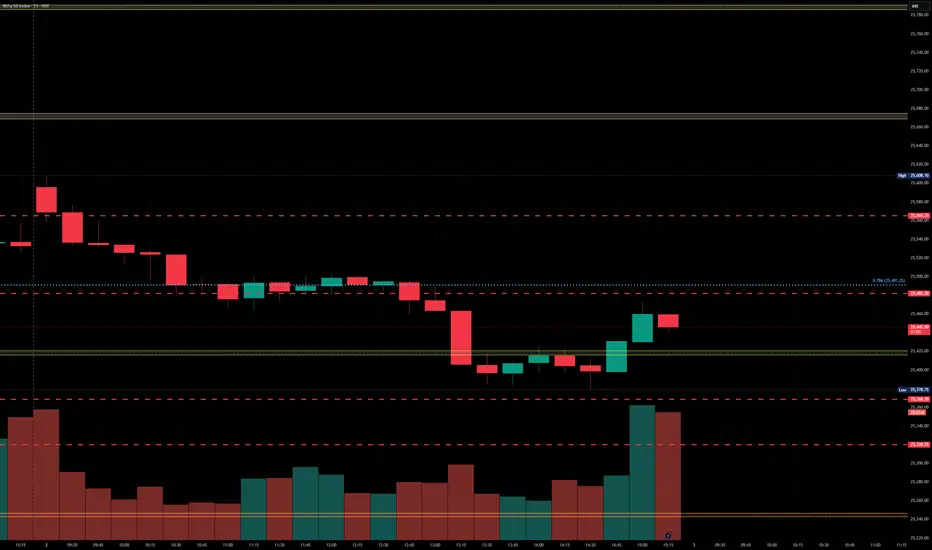
Nifty levels - Jul 03, 2025Nifty support and resistance levels are valuable tools for making informed trading decisions, specifically when combined with the analysis of 5-minute timeframe candlesticks and VWAP. By closely monitoring these levels and observing the price movements within this timeframe, traders can enhance the accuracy of their entry and exit points. It is important to bear in mind that support and resistance levels are not fixed, and they can change over time as market conditions evolve.
The dashed lines on the chart indicate the reaction levels, serving as additional points of significance to consider. Furthermore, take note of the response at the levels of the High, Low, and Close values from the day prior.
We hope you find this information beneficial in your trading endeavors.
* If you found the idea appealing, kindly tap the Boost icon located below the chart. We encourage you to share your thoughts and comments regarding it.
Wishing you success in your trading activities!
DXY UpdateAs expected the dollar has decreased in value over the past couple weeks as seen with my earlier post
We have come to a key level here for the dollar. FX tends to move in prolonged waves of price increases and decreases so this could potentially be the be the start of a prolonged decline
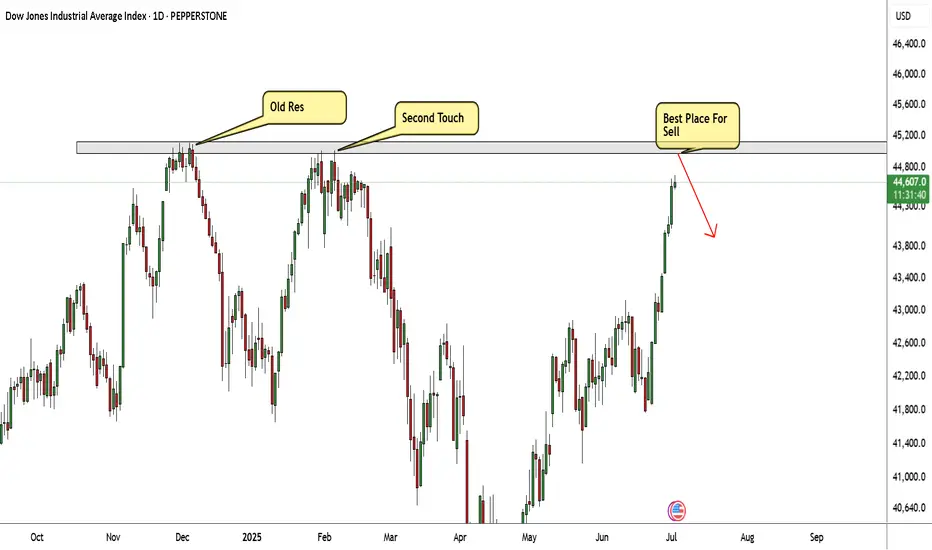
US30 Very Near Strong Res Area , Short Setup To Get 500 Pips !Here is my US30 Daily Chart , the price very near the highest price area , this res area forced the price to go down very hard 2 times so i think this time will be the biggest movement to downside , so i`m waiting the price to touch it and give me a good bearish price action and then we can enter a sell trade and targeting at least 500 pips . if we have a daily closure above then this idea will not be valid .
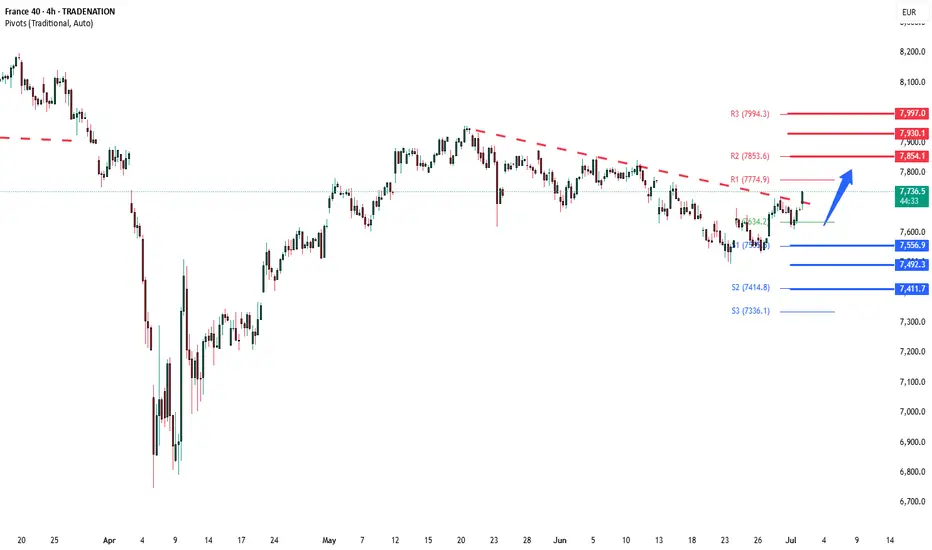
CAC40 Bullish breakout supported at 7560Key Support and Resistance Levels
Resistance Level 1: 7850
Resistance Level 2: 7930
Resistance Level 3: 7995
Support Level 1: 7560
Support Level 2: 7490
Support Level 3: 7410
This communication is for informational purposes only and should not be viewed as any form of recommendation as to a particular course of action or as investment advice. It is not intended as an offer or solicitation for the purchase or sale of any financial instrument or as an official confirmation of any transaction. Opinions, estimates and assumptions expressed herein are made as of the date of this communication and are subject to change without notice. This communication has been prepared based upon information, including market prices, data and other information, believed to be reliable; however, Trade Nation does not warrant its completeness or accuracy. All market prices and market data contained in or attached to this communication are indicative and subject to change without notice.
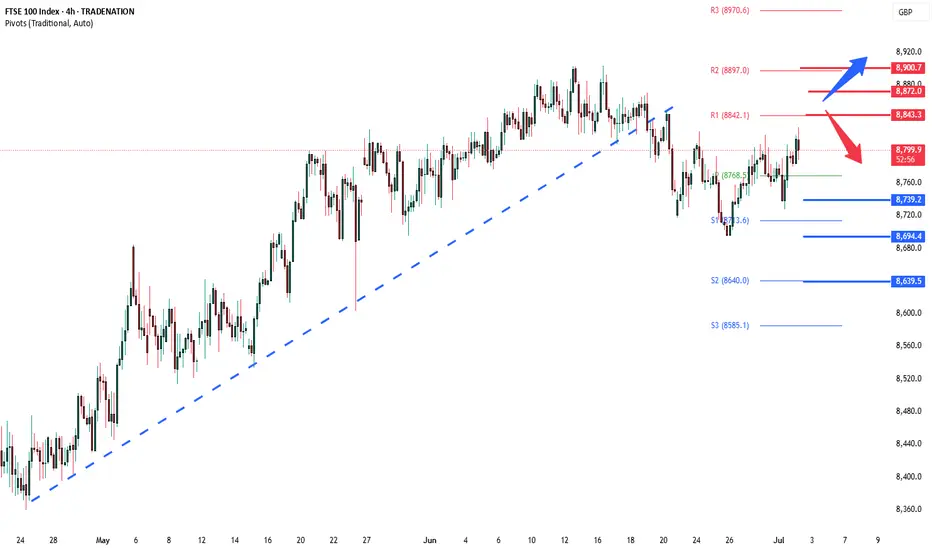
FTSE oversold rally resistance at 8820The FTSE remains in a bullish trend, with recent price action showing signs of a corrective pullback within the broader uptrend.
Support Zone: 8740 – a key level from previous consolidation. Price is currently testing or approaching this level.
A bullish rebound from 8740 would confirm ongoing upside momentum, with potential targets at:
8840 – initial resistance
8870 – psychological and structural level
8900 – extended resistance on the longer-term chart
Bearish Scenario:
A confirmed break and daily close below 8740 would weaken the bullish outlook and suggest deeper downside risk toward:
8695 – minor support
8640 – stronger support and potential demand zone
Outlook:
Bullish bias remains intact while the FTSE holds above 8740. A sustained break below this level could shift momentum to the downside in the short term.
This communication is for informational purposes only and should not be viewed as any form of recommendation as to a particular course of action or as investment advice. It is not intended as an offer or solicitation for the purchase or sale of any financial instrument or as an official confirmation of any transaction. Opinions, estimates and assumptions expressed herein are made as of the date of this communication and are subject to change without notice. This communication has been prepared based upon information, including market prices, data and other information, believed to be reliable; however, Trade Nation does not warrant its completeness or accuracy. All market prices and market data contained in or attached to this communication are indicative and subject to change without notice.
Dow Reverses for Pullback, Bullish Case Valid Above 44,400US30 OVERVIEW
Dow Jones Maintains Uptrend, Poised for Retest and Potential Extension
Dow Jones futures edged up by 69 points early Wednesday, signaling cautious optimism as investors shifted focus away from technology stocks to kick off the second half of the year.
The price continued its bullish trend until it reached the resistance zone, then reversed for a correction, falling below 44,630. Remaining below this level could extend the correction toward 44,400, which now serves as key support and pivot line for confirming a bearish trend.
As long as the index trades above 44400, the bullish trend remains intact, targeting 44,630, and potentially crossing the resistance zone within 44760 and 44920.
Resistance Levels: 44,630 → 44760 → 44920.
Support Levels: 44400 → 44120 → 43960.
XU100 — BIST100 indexStarting from the assumption that the corrective movement which began on July 18, 2024, is a WXY pattern, I consider the current movement to be the final leg of this formation. Accordingly, I have marked in yellow on the chart what I see as the most likely reversal date and target price level. The overall potential reversal zone is indicated by the two vertical grey lines, while the target price area is marked in green.

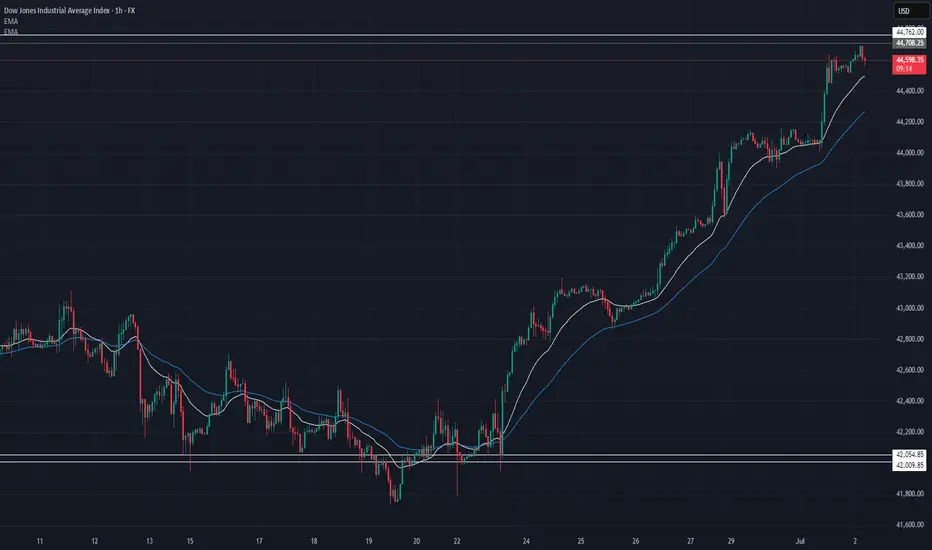
US30 Technical Outlook – 07/02/2025📍 US30 Technical Outlook – 07/02/2025
The bull train keeps rolling! 🚂 Price smashed through the 44,250 resistance level and is now testing the next major zone at 44,700 → 44,760 🔥
🧠 Key Observations:
Price has extended way above the EMAs ✅
EMAs (44,266 and 44,496) still pointing sharply upward ✅
Market consolidating right under 44,760 resistance 📍
📊 Key Price Zones:
🔼 Resistance: 44,700 → 44,760 → 45,000
🔽 Support: 44,500 → 44,250 → 44,000
📈 Trade Setup Ideas:
🔹 Long Bias (Still favored trend-side):
Wait for pullbacks toward 44,500 → 44,250
Buy dips with bullish confirmation patterns (engulfing, pin bars, EMA support hold) ✅
Target: 44,760 → 45,000
🔻 Short Bias (Countertrend – Only on rejection!):
Watch for rejection wicks or bearish reversal setups from 44,700–44,760
Could target quick flush down to 44,500 → 44,250 support
⚠️ Important: Price has been parabolic, so chasing here is dangerous. Wait for clear setups, either dip buys or high-timeframe rejection.
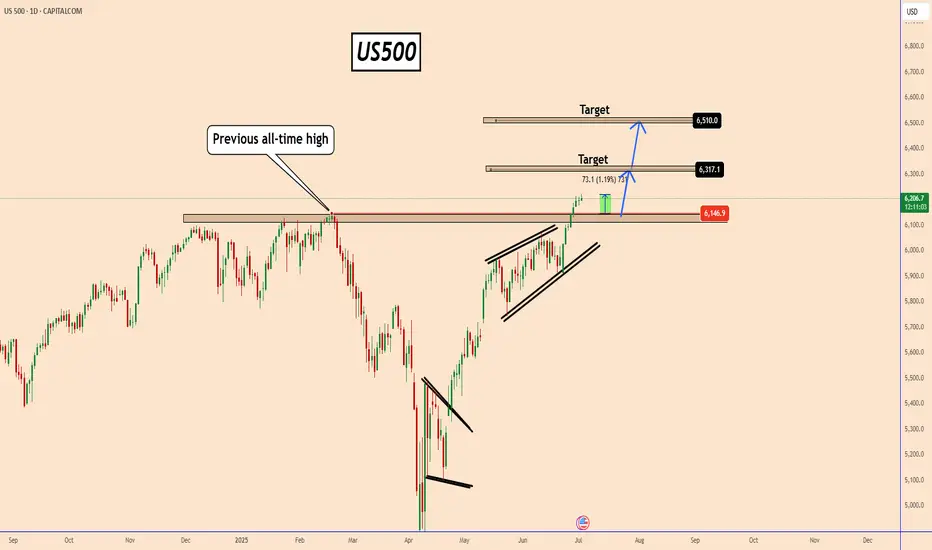
US500 Eyes 6317 and 6510 After Historic BreakoutUS500 Eyes 6317 and 6510 After Historic Breakout
The US500 has broken out above its previous all-time high near 6147, following news of a ceasefire agreement between the U.S., Israel, and Iran.
Since then, equity markets have surged, with indices leading the rally.
US500 has now reached a fresh all-time high at 6220, confirmed by a strong weekly candle close above the former peak, adding technical value to the breakout.
Looking ahead, the US500 appears poised to extend its gains toward the 6317 and 6510 levels on the daily chart.
A stronger-than-expected Non-Farm Payroll (NFP) report could further fuel this bullish momentum.
You may find more details in the chart!
Thank you and Good Luck!
PS: Please support with a like or comment if you find this analysis useful for your trading day
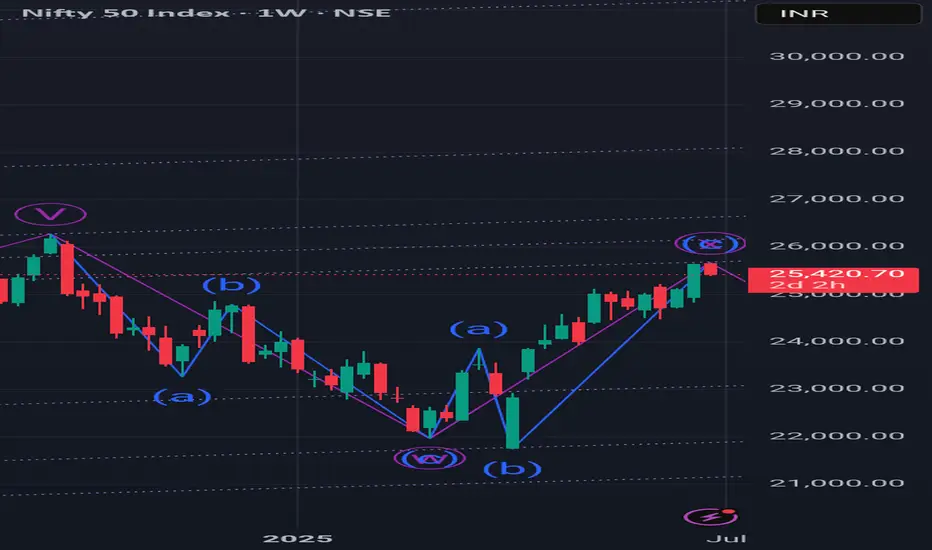
Wave counts on larger TFThis is how I see Nifty wave count on a Larger TF. We are currently in wave 4 correction of after covid bull run of wave 3. We have corrected 0.236 of this post covid growth by Feb's end and going to correct up to 0.382 level now.
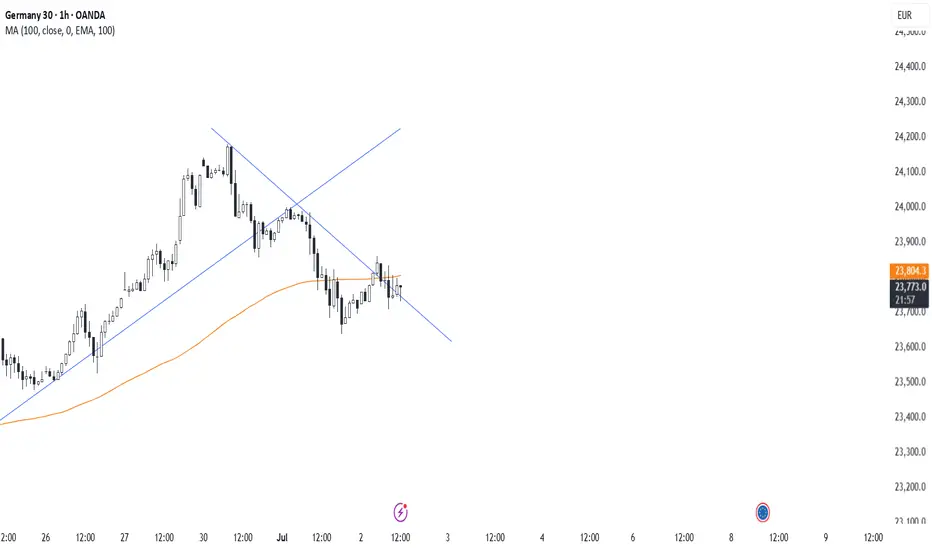
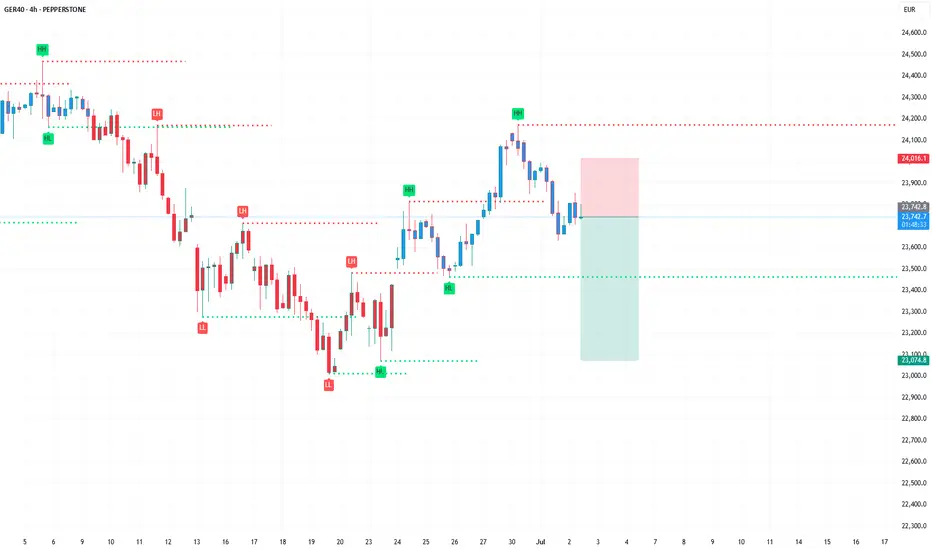
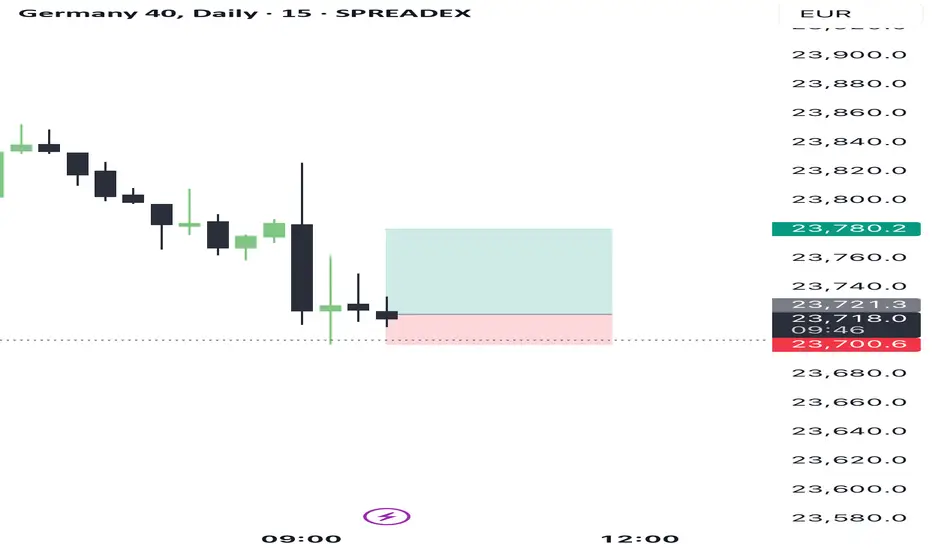
Buy signal TiqGPT MARKET NARRATIVE:
Analyzing the Germany 40 across multiple timeframes, we observe a complex interplay of institutional activity and liquidity dynamics. Starting from the daily chart down to the 1-minute chart, there is a visible shift in market structure and momentum that suggests a nuanced institutional footprint.
Daily Chart (1D): The market shows a series of bullish and bearish candles with no clear directional bias, indicating a phase of distribution where institutions might be balancing their positions. The presence of wicks on both sides of the candles suggests indecision and liquidity hunts at both higher and lower price levels.
4-Hour Chart (4H): Recent candles show a sharp decline followed by a recovery, indicating a potential sweep of lows to capture liquidity below prior lows. This could be an inducement phase to trap bearish retail traders before a possible upward move.
1-Hour Chart (1H): The sharp downward candle followed by smaller bullish candles suggests a reaction from a liquidity pool or a mitigation block, indicating that institutions might be absorbing sell-side liquidity and potentially preparing for a push higher.
15-Minute Chart (15M): This timeframe shows a clearer picture of the liquidity sweep with a sharp decline and subsequent recovery, suggesting a possible change of character (CHoCH) from bearish to bullish.
5-Minute Chart (5M) and 1-Minute Chart (1M): Both these lower timeframes show consolidation after a sharp move down, typically indicative of accumulation after a liquidity sweep, setting the stage for a potential bullish reversal.
INSTITUTIONAL THESIS:
The overarching thesis is that institutions are likely in the phase of accumulation after having engineered a liquidity sweep across multiple lower timeframes. The expectation is for a bullish reversal as retail bearish positions are likely trapped.
LEARNING POINT:
"1H liquidity sweep and mitigation followed by potential accumulation on lower timeframes."
SIGNAL: BUY
SYMBOL: Germany 40
ENTRY PRICE: $23,720
STOP LOSS: $23,700
TARGET PRICE: $23,780
CONDITION: Buy limit order post-confirmation of bullish momentum on 15M chart.
RATIONALE: The setup aligns with a liquidity sweep followed by accumulation, a typical institutional play. The entry is set just above the recent consolidation, targeting the next potential liquidity pool.
STRATEGIES USED: Liquidity Sweep and Accumulation Phase
URGENCY: MEDIUM
TIMEFRAME: Short-term
CONFIDENCE SCORE: 85%
RISK/REWARD RATIO: Risk=$20.00, Reward=$60.00, Ratio=1:3.0
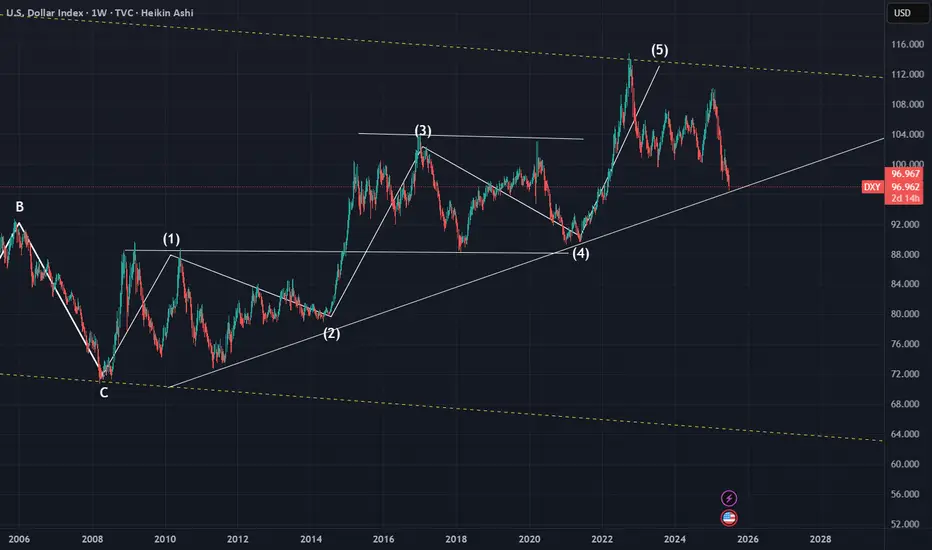
DXY Long-Term Technical Outlook: Channel Structure, Pullbacks & ## **DXY (Dollar Index) Technical Analysis – 2W Chart**
### **1. Uptrend Since 2008**
The Dollar Index (DXY) has been in a **long-term uptrend** since the 2008 bottom (around 70.70). The chart shows a clear pattern of **higher highs and higher lows**, establishing a bullish market structure over the past 15+ years.
---
### **2. Ascending Channel**
The price has been moving consistently within a well-defined **ascending channel**. Several reactions from the channel boundaries are visible:
- **Support (lower trendline):** 2008, 2011, 2018, 2021, 2024
- **Resistance (upper trendline):** 2009, 2017, 2022
This suggests that the market is respecting the technical boundaries of the channel remarkably well.
---
### **3. Historical Pullbacks Within the Channel (13.5% – 15%)**
The chart highlights major **pullbacks** from local tops, all falling within the **-12.6% to -16.9%** range, showing high consistency:
| Year | Drop | % Decline |
|-------------|----------|----------------|
| 2009 | -14.76 | -16.47% |
| 2010 | -14.97 | -16.90% |
| 2017 | -15.17 | -14.61% |
| 2020 | -13.65 | -13.25% |
| 2022 | -14.90 | -12.98% |
| 2024/2025 | -13.90 | -12.61% |
This implies that **a retracement of 13–15%** from a local high is a historically "normal" correction within the ongoing uptrend.
---
### **4. EMA Analysis – 24, 120, 240** (2Y,5Y,10Y)
The chart includes three Exponential Moving Averages (EMAs), reflecting short-, medium-, and long-term trends:
- **EMA 24 (white line):** Reacts to short-term price action. Price is currently breaking below it, suggesting weakness in short-term momentum.
- **EMA 120 (red line):** Reflects the mid-term trend. Price is **right at the edge**, often acting as a **support level** in bullish markets.
- **EMA 240 (blue line):** Represents the long-term outlook. **Price has never stayed below this level for long** over the past 15 years, making this EMA a **critical support** for the long-term trend.
---
### **Conclusion & Potential Scenarios**
📉 **Bearish Scenario:**
If DXY breaks below the **EMA 240** and the **lower channel boundary**, it could indicate a **reversal of the long-term uptrend**, which hasn’t happened since 2008.
📈 **Bullish Scenario:**
If DXY holds above the **EMA 120** or bounces from the **EMA 240** and the **channel support**, we could expect a rally toward the **Fibonacci levels** (0.5 at 102.04 or 0.382 at 105.04), or even a retest of the highs around **114.78**.

Wind of Change - VOO ETFPlease watch this interesting article and feel the cool nice breeze blowing along...........
Nice , isn't it ?
As I read this article, I can't help as if a REAL giant fan was blowing at me although I know it is not REAL, just an image in my mind, magnified by the LED image and the sound as well.
And for a moment, I allowed it to play with my mind and instantly, I felt cooler.........
It is the same for reporters/journalists worldwide who made a living covering news and writing sensational news headlines to capture your eyeballs. Although we are not in Israel/Iran war, we too feel the pain and tragedy suffered by the innocent people.
How about the numerous floods happening in China ? I can't help but feel a sense of gratitude for where I am born - Singapore , free from natural disasters.
It is the same as INVESTING/TRADING. If you look at your P&L statement on a daily/hourly basis, it somehow spurs you to take an impulsive action. This is especially if you have lost some money and you wanted to quickly recover your losses. On one hand , you wanted it to go along but afraid the pullback may be too strong and your profits turn to losses again.
I remembered the book I read about - it says yesterday result was history. Whatever had happened , leave it there. Today is a fresh start and if you want to trade, you must have a brave heart and start afresh , look at your available capital (not including what you had lost) and do what you are supposed to do in the moment.
Social media is a double edge sword and every day, there are doomsday porns including marketing gurus telling you that the stock market is overvalued, tariffs this , tariffs that and you should sell. Did you ?
And there are also Asia bulls or rather China bulls that claims US funds are shifting to China and the price is going to the moon. I have often said treat this as entertainment , as reference but do your own due diligence.
A safer and lower risk is to get exposed to the VOO ETF where it is more diversified and you need not worry about a single company performance dragging the rest down.
Position sizing is also important - just because you had made some money (could be luck), it does not mean you should increase your position size (increase in risk) due to your greed. Consistency is the game in trading not BIG IN BIG OUT.

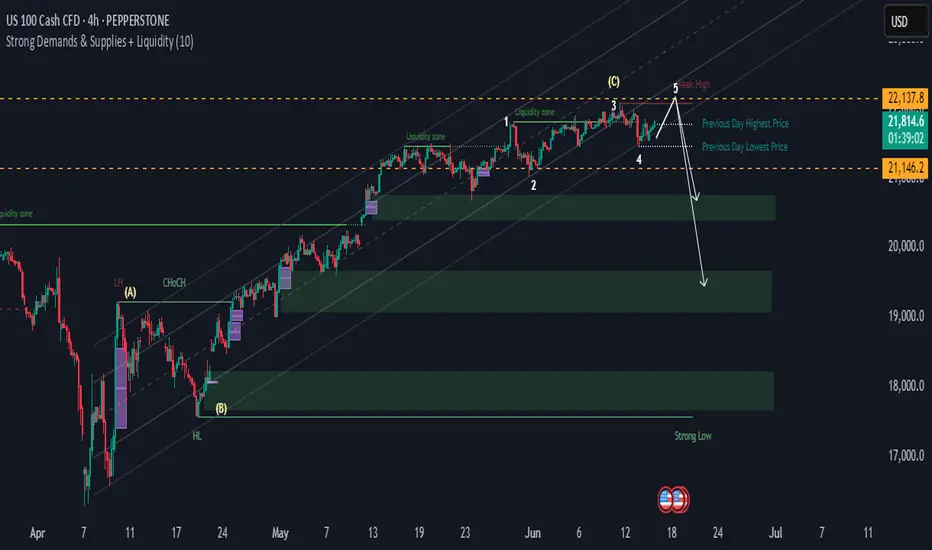
NAS100 Potential ReversalHi there,
The NAS100 is slightly bullish and fairly stagnant. It is consolidating between two key levels (orange lines). A break below the price might fall into deeper demand zones.
Short Notes
- **Elliott Wave**: 5-wave structure appears complete at resistance (22,137.8), signalling a possible reversal.
- **Liquidity Zones**: Price is at/near a major liquidity zone, increasing reversal risk.
- **Break High**: There's a potential for a false breakout above wave 5 before dropping.
- **Support Levels**: The 21,800.6 (previous day high) and 21,146.2 (previous day low) for first support.
- **Demand Zones**: Strong demand below 21,146.2, with deeper support near 20,000 and 18,800.
- **Overview: A possible bearish move ahead from current highs, targeting lower demand zones.
Happy Trading,
K.
Not trading advice
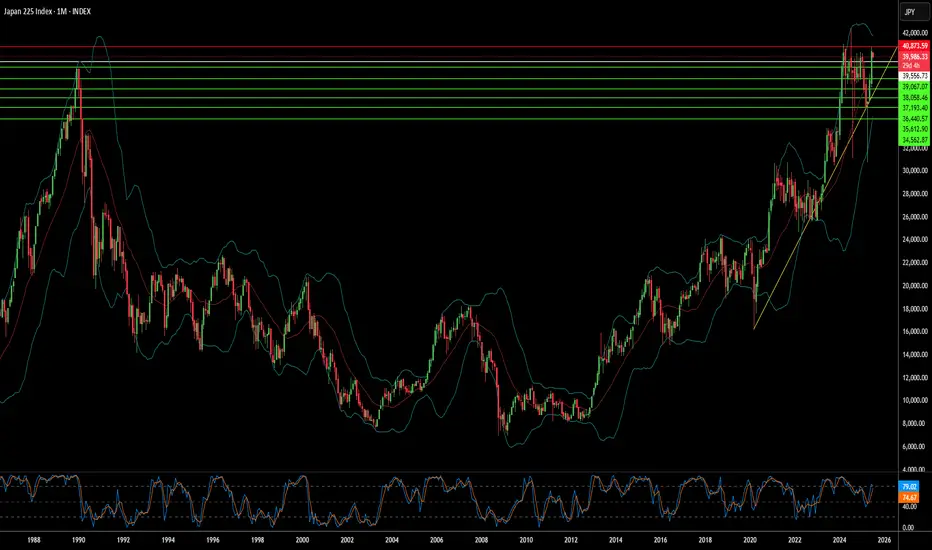
Is Japan's Economic Future at a Tariff Crossroads?The Nikkei 225, Japan's benchmark stock index, stands at a critical juncture, facing significant pressure from potential US tariffs of up to 35% on Japanese imports. This assertive stance by US President Donald Trump has already triggered a notable decline in Japanese equities, with the Nikkei 225 experiencing a 1.1% drop and the broader Topix Index falling 0.6% on Wednesday, marking consecutive days of losses. This immediate market reaction, characterized by a broad-based selloff across all sectors, underscores profound investor concern and a pre-emptive pricing-in of negative outcomes, particularly for the highly vulnerable automotive and agricultural sectors.
The looming July 9 deadline for a trade agreement is pivotal, with President Trump explicitly stating his intention not to extend the current tariff pause. These proposed tariffs would far exceed previous rates, adding substantial financial burdens to industries already facing existing levies. Japan's economy, already struggling with a recent contraction in GDP and persistent declines in real wages, is particularly susceptible to such external shocks. This pre-existing economic fragility implies that the tariffs could amplify existing weaknesses, pushing the nation closer to recession and intensifying domestic discontent.
Beyond immediate trade concerns, Washington appears to be leveraging the tariff threat to compel allies like Japan to increase military spending, aiming for 5% of GDP amidst rising geopolitical tensions. This demand strains the "ironclad" US-Japan military alliance, as evidenced by diplomatic setbacks and Japan's internal political challenges in meeting such ambitious defense targets. The unpredictable nature of US trade policy, coupled with these geopolitical undercurrents, creates a complex environment where Japan's economic stability and strategic autonomy are simultaneously challenged, necessitating significant strategic adjustments in its international relationships.
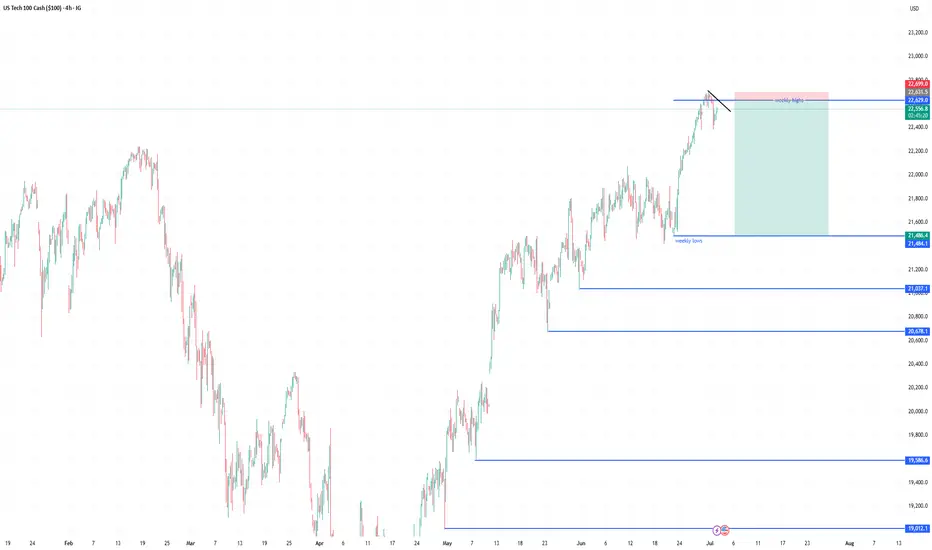
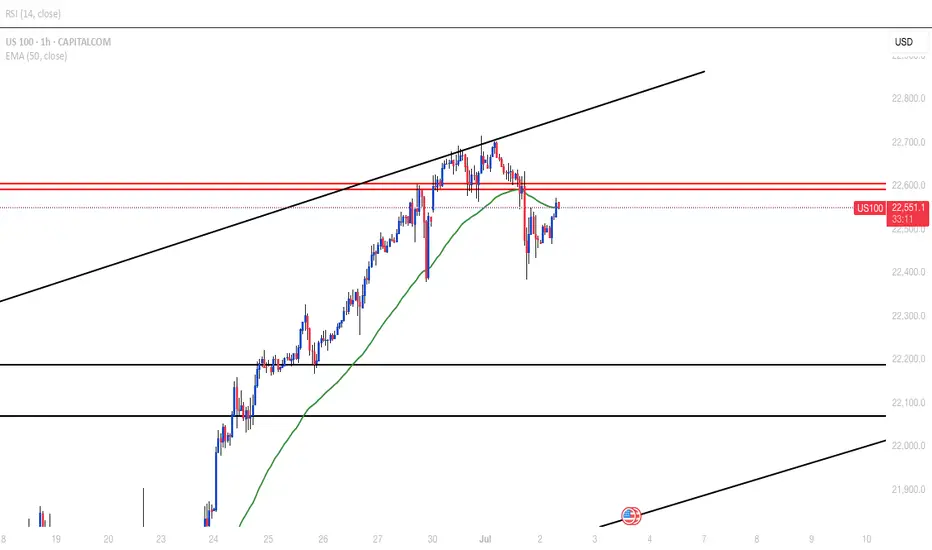
US100Price broke daily resistance last week and now looks like a retracement is on the way. H4 gave a double top at the rising channel resistance. Pulling back to retest the neckline. target is 22,200.
Weekly highs swept, aiming for weekly lows now.Liquidity Grab above Weekly Highs
Bearish Rejection Wicks
Trendline Break
Imbalance / Fair Value Gaps below
Reversion to Mean / Higher Timeframe Discount Zones