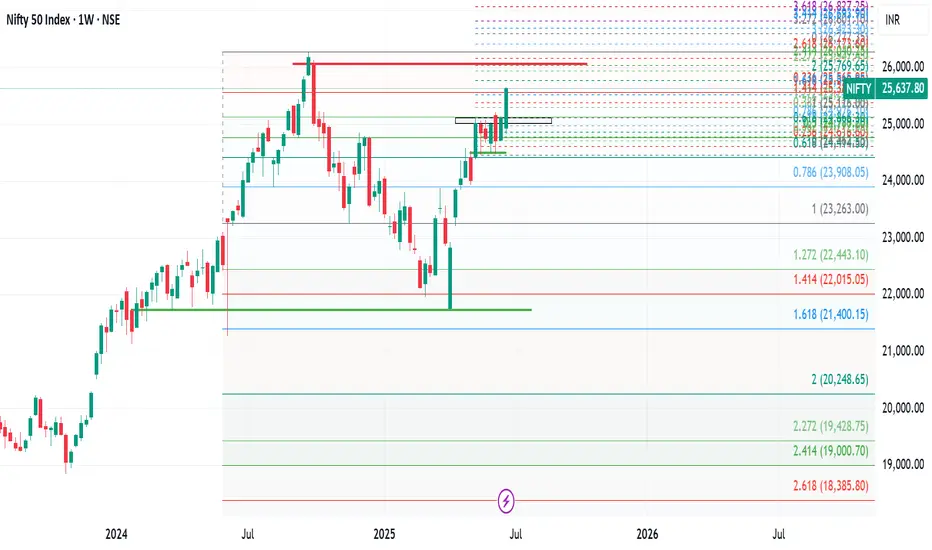
Market Recap: Nifty Breaks Out After 5 Weeks of Consolidation!The Indian stock market saw a strong bullish move this week, with Nifty 50 closing at 25,637, marking a significant gain of 525 points from the previous week's close. The index made a high of 25,654 and a low of 24,824, finally breaking out of the key resistance zone of 25,000–25,100 after five weeks of sideways consolidation.
This breakout is a critical technical development, signaling renewed strength in the broader market. However, to sustain this momentum and target the all-time high zone of 26,134–26,277, Nifty may need to either:
Consolidate within the previous week's range of 25,650–24,800, or
Retest the breakout level near 25,200 for confirmation.
Failing to do so could make this breakout a false one.
Weekly Outlook for Nifty:
For the coming week, the expected trading range is between 25,200 and 26,150. Price action around these levels will be key to watch.
On a broader sectoral view, out of 14 NSE indices, only Nifty Financial Services is showing relative strength on the monthly chart—a potential red flag for sustained bullish sentiment. When just one sector leads while others lag, it's often a sign to remain cautious.
Strategy Suggestion:
Consider booking partial profits and trailing stop losses on the remaining positions. Until the monthly time frame turns decisively bullish, it's wise to stay alert and manage risk actively.
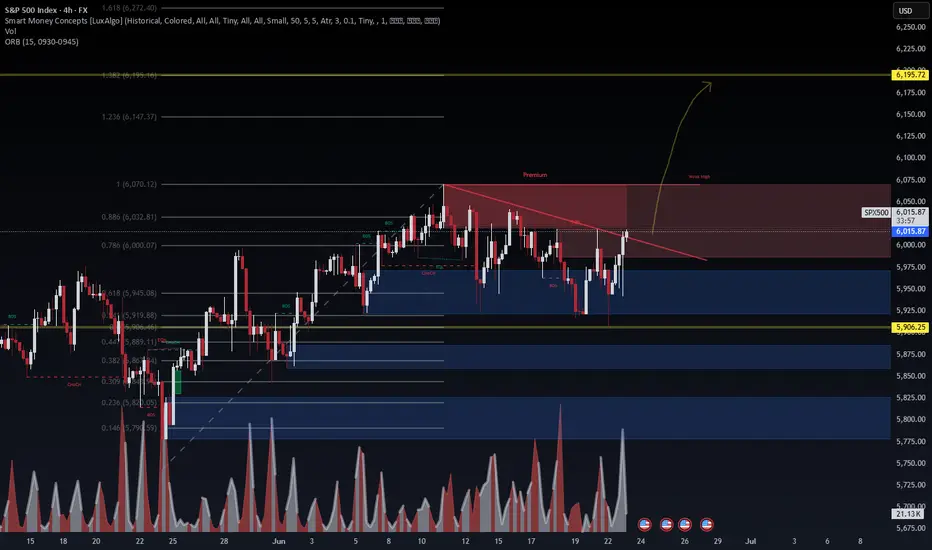
Global Markets: S&P 500 Breaks Out!
In the U.S., the S&P 500 surged to close at 6,173, successfully breaking above its key resistance level at 6,013. This breakout, if sustained above 6,150 next week, opens up the path toward higher targets: 6,225 / 6,376 / 6,454 / 6,500.
However, traders should remain flexible. If the breakout fails, we could see a pullback to support zones near 6,013 or even 5,899.
Pro Tip:
Be ready to switch trading positions quickly if the breakout doesn’t hold—volatility is still very much in play in both Indian and U.S. markets.
Market indices
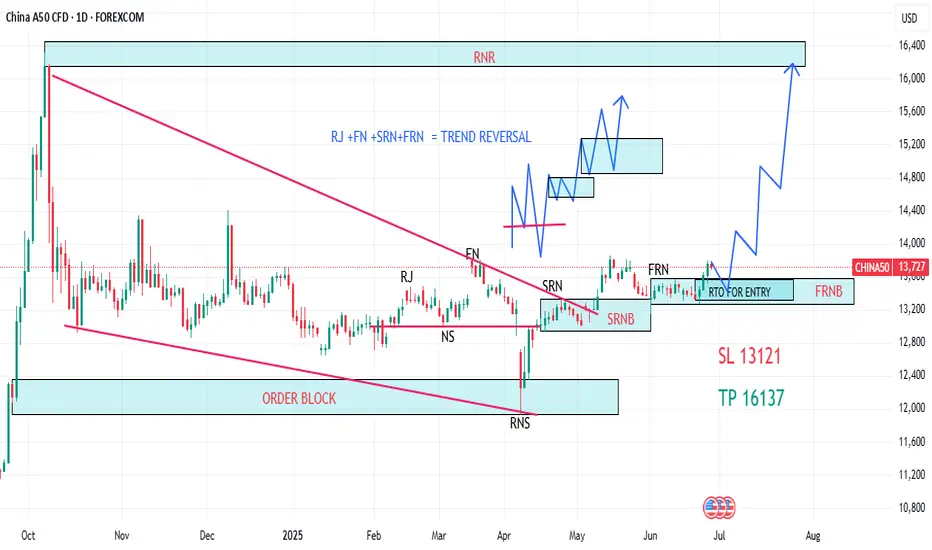
CHINA A50 MARKET ANAYALIS AND PRICE PREDICTIONCHINA A50 Has activated a reverse order at an Institutional order Block. The reverse SET UP is perfect and complete because renegotiation has succeeded and also failed in the opposite direction and a renegotiation trend line has been broken with shift candle creating an imbalance in the market. Decision has been taken in favor of the Bulls already. Price will retrace very little to mitigate the Bullish order Block and Give the Bulls a perfect entry. RNR( Renegotiation Resistance) is the Target. This move is the rally for this week.
Entry, Stop Loss and Take Profits are clearly stated on the Chat.
GOOD LUCK GUYS!
DISCLAIMER
Any Analysis Can Fail Based on Market sentiments and uncertainties. You are advised to take full responsibility of your capital and manage your risk!
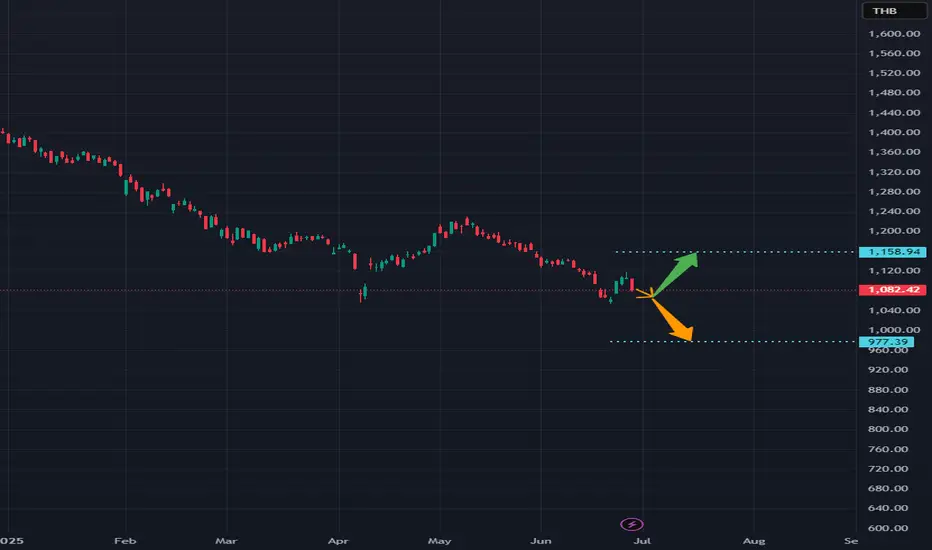
Analysis on SET INDEX: Time to bet (Continued)Dear All
Continued from the previous post,
It seem to choose to come down first before rising up.
So now, it is easy to plan the trade, as long as
There is buying flow coming around 1063 1053 // that would be the best point to buy.
But if broken, the long bias set up will become incorrect and cut loss is needed.
Now there are two choices again:
first it can hold, => should went up very rapidly to 1120 1160 1230 consecutively.
second it cannot hold, => 970
Best regards,
TraderPP
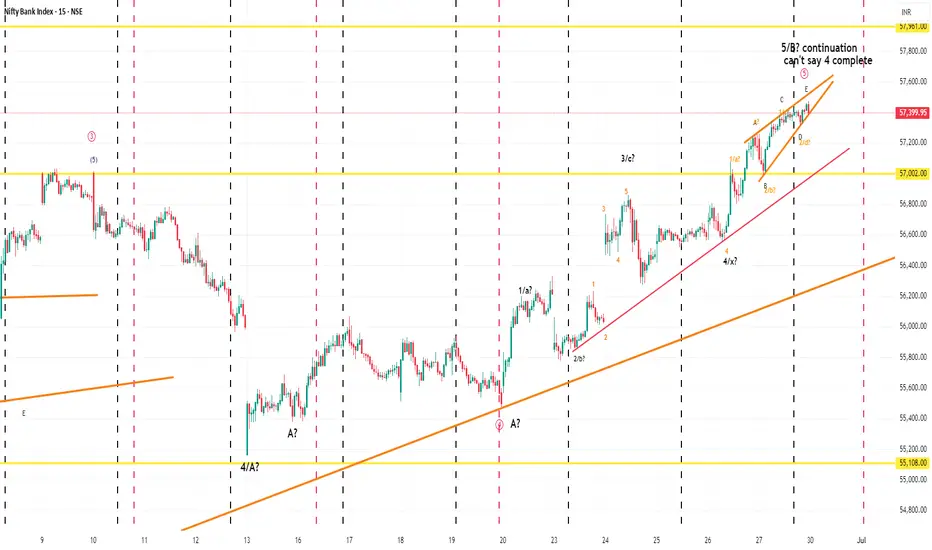
bank nifty cashtime wise from 2 to 3rd wave top appear wave 4 yet not complete in irregular correction,
Alternatively we may be in wave 5 first wave let see Monday clear more picture , though some people started giving target of 59000+, if so this is wave 1 and still one correction due as bearish divergence also emergins in hourly charts. Thanz just a learner may be wrong and not a sebi registered RA.Thanz
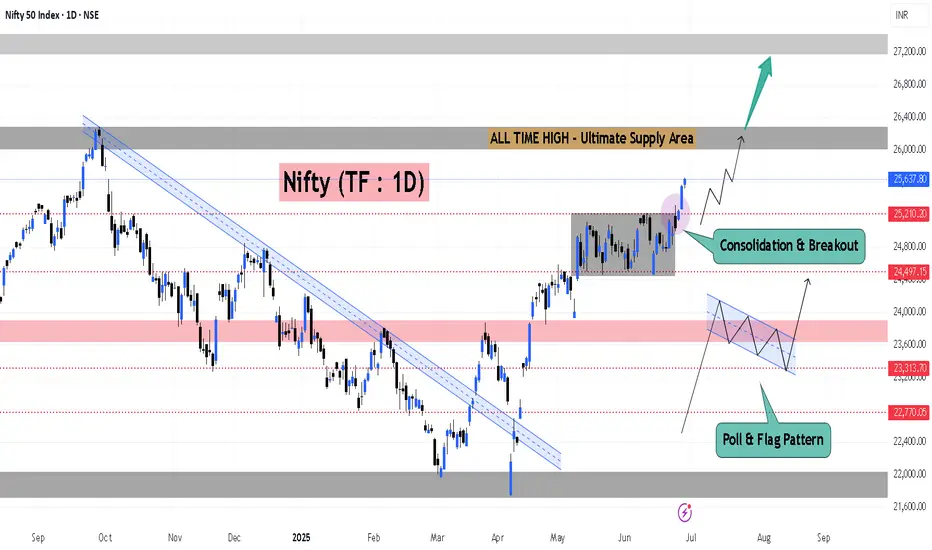
Nifty : Strong Breakout MomentumBreaking out from a 5‑week consolidation, The Nifty ended positively.
Fading geopolitical tensions & Rising FII long-short ratio and futures rollover suggest bullish sentiment.
With key time-based levels and technical thresholds in focus, we could see Nifty scale toward 26,000 📈
📌 There is also a Poll & Flag pattern breakout visible on higher time frame. Which indicates targets towards 27200 / 28000.
These upper range open once Nifty starts sustain above ATH oh Daily & Weekly time frame on medium term
Bull Flag on DailyDXY looking bullish on the daily timeframe with a bull flag noticed. Bullish confirmation candles should be looked out and confirmed before placing any long positions
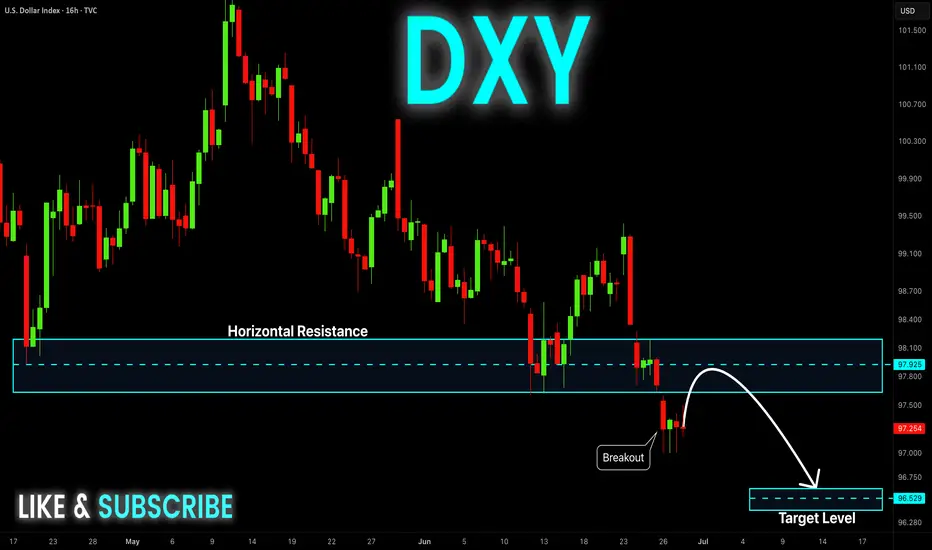
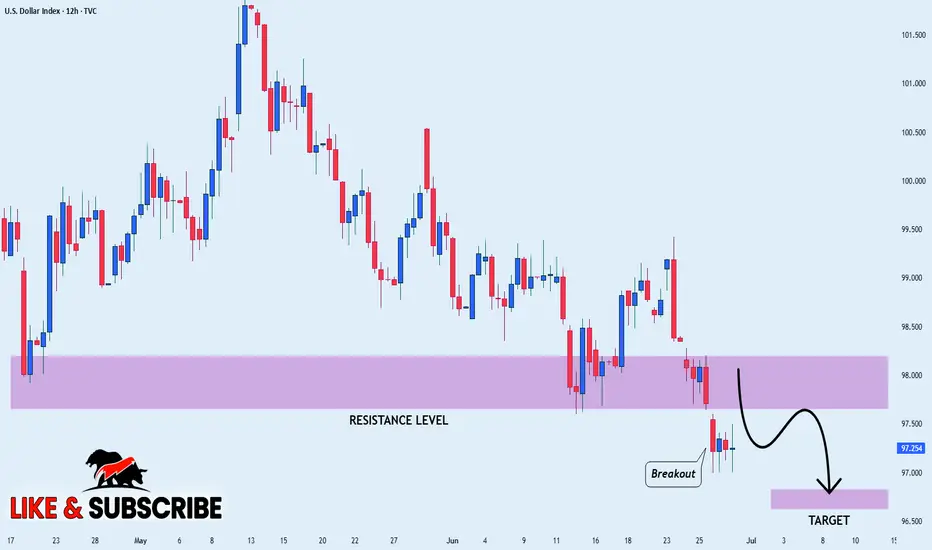
DXY Swing Short! Sell!
Hello,Traders!
DXY keeps falling down
And the index broke the
Key wide horizontal level
Around 97.800 which is now
A resistance and the breakout
Is confirmed so we are very
Bearish biased and we will
Be expecting a bearish
Continuation on Monday
Sell!
Comment and subscribe to help us grow!
Check out other forecasts below too!
Disclosure: I am part of Trade Nation's Influencer program and receive a monthly fee for using their TradingView charts in my analysis.
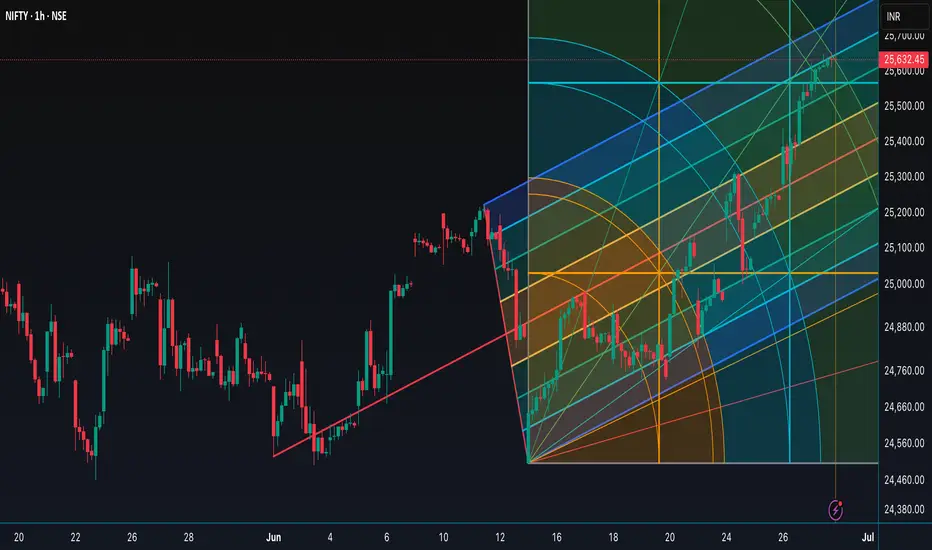
Nifty 50 Hourly Chart Update 📊 Nifty 50 Hourly Chart Update 📊
Nifty’s leap hits 25,600 🚀
But signs of a short-term pause are showing up… ⚠️
🔹 RSI at 75 🔼
🔹 ATR dropping 📉
🔹 Price at Pitchfork & Gann Square resistance 🎯
📉 A mild reversal may be on the cards before the next move.
⏳ A better entry opportunity might come in the next few days. Stay patient, stay sharp! ⚔️📅
Let's see how it goes. www.youtube.com
"The true strength of any government, military, or society lies in its commitment to protect civilians. When that principle is compromised, we lose the very reason these institutions exist. Power must serve humanity, not harm it."
US30 Is on the move up as sellers get low buyers are winning the move pushing the price all the way up as there is a lot of pressure for the price to go all thr way higher to create a w shape as seen in the chart watch out for more buys than sells on this pair goodday
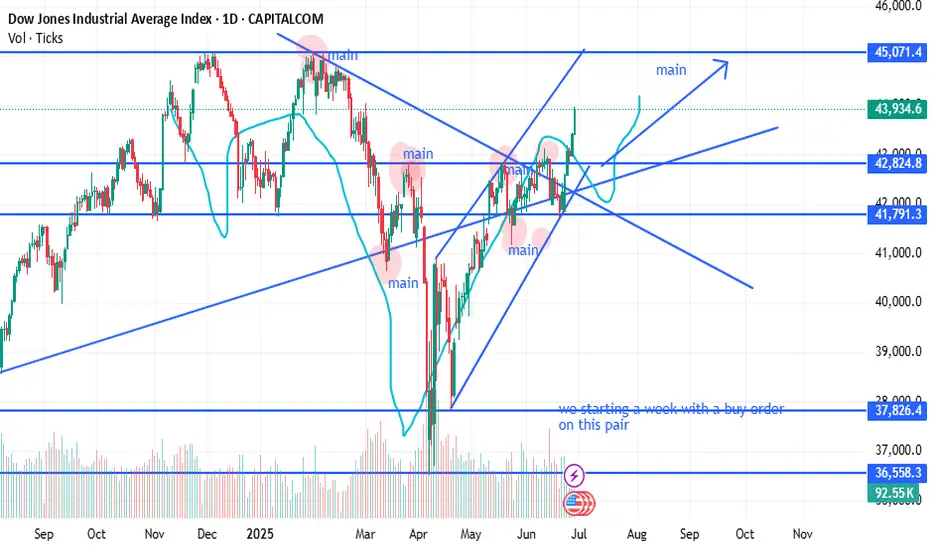
US30Persistent inflation and expectations about Federal Reserve interest rate policy continue to influence investor sentiment.
Sector Performance: The rally has been broad-based, with increased activity in industrials and technology components.

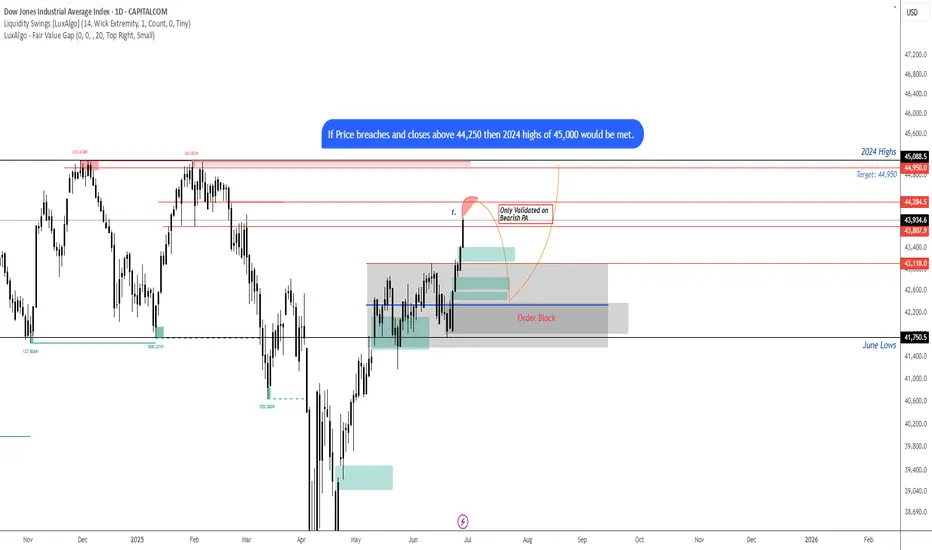
US30 looking for the short on Bearish PAI believe we can expect a pull back down to JuBias: Short-term Bearish (Contingent Setup)
Context: Price is currently trading just below a high-probability supply zone between 44,048 – 44,277. This area aligns with prior highs and liquidity, making it a prime zone to look for a short-term rejection if strong bearish price action (PA) appears on the 4H or Daily timeframes.
We are currently seeing strong bullish momentum on the Weekly, Daily, and H4 candles. Any short positions from this zone must be reactive — not anticipatory. A clear bearish signal (e.g., engulfing, structure break, supply confirmation) is required to consider entry.
Key Zone:
Seek bearish PA between 44,048 – 44,277
Contingency: If price breaks and closes above 44,250 (2024 highs), expect continuation toward 45,000
Short Targets if Rejection Occurs:
Target 1: 43,350
Target 2: 42,500
Extended Target: 41,734 (June Low)
Post-Rejection Bullish Scenario:
If we do get a rejection and targets are met, we will then look for bullish PA in the demand zones (42,500 or 41,700) to consider long setups back toward the 2024 highs and potentially beyond.
Breakout Scenario:
If price breaks and closes above the 44,277 zone early this week, we anticipate the next leg to 45,000 before any meaningful reversal.
At this stage, it’s a waiting game — let price action lead. We don’t predict, we react.ne lows before an
Nifty Weekly Analysis as of 29/06/2025Nifty analysis
banknifty analysis
stocks analysis
dji nasdaq etc etc

Weekly Forex Outlook Sun.June.29.2025 - Fri.July.4.2025Like and Comments would be appreciated :D Not Financial Advice, Just my outlook/opinion

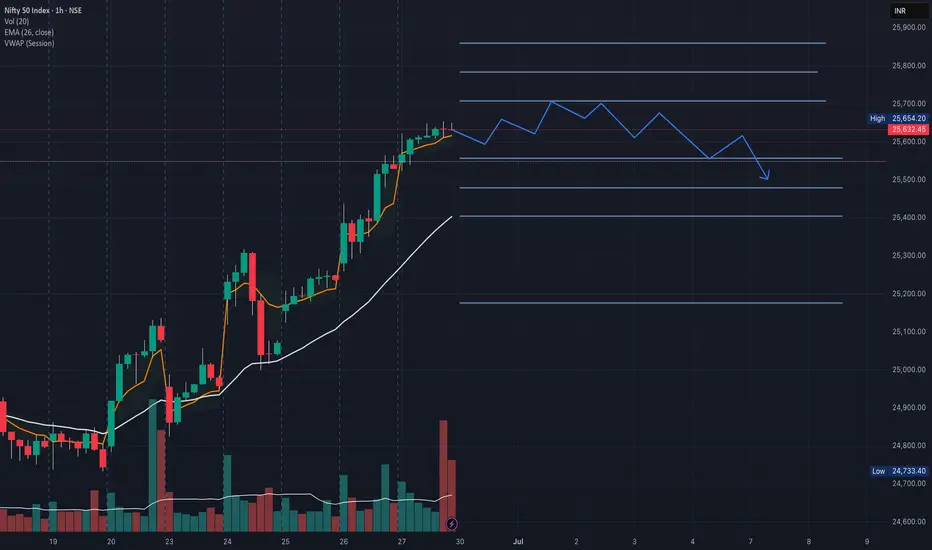
Nifty in next 2-3 WeeksNifty 50 Index has given a sharp pull back from months lows. But there is a pull back expected but before that Index should touch 25700 and then a 500 point pull back in coming days.
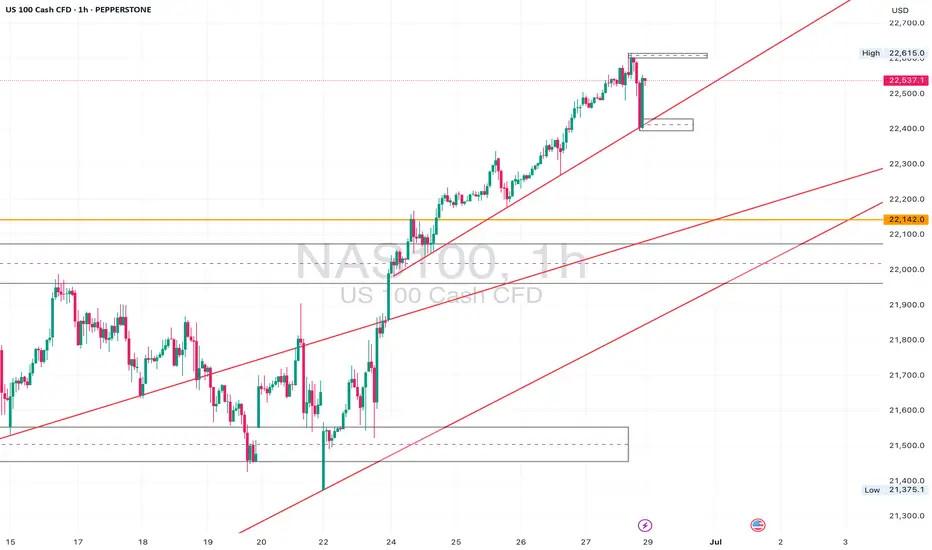
NAS100 Breakout – Eyeing Bullish Extensions or False Break?The NAS100 (US100) is in full breakout mode on the daily, surging past previous highs near 22,140 with strong momentum. Price is now trading at ~22,550, decisively above prior resistance, which could now act as support if we retest.
🔎 Multi-Timeframe Breakdown:
✅ Daily Chart:
• Massive bullish structure intact.
• Clean breakout above horizontal resistance at 22,140.
• Price riding an aggressive ascending trendline — watching for sustained closes above breakout level.
✅ 4H Chart:
• Higher lows and bullish impulsive candles confirm buyers in control.
• Multiple support zones below (22,300, 22,100) for potential retests.
• Key short-term resistance formed near 22,650 — a rejection here could trigger correction.
✅ 1H & 23m Charts:
• Micro pullback seen after tagging fresh highs; price still holding above short-term trendlines.
• Consolidation zone between 22,500–22,600 could be decisive for next move.
⸻
📌 Key Zones to Watch:
• Support: 22,300 / 22,140
• Resistance: 22,650 / 22,800
• A breakout retest could confirm continuation; otherwise, failure to hold support might signal a fakeout.
⸻
📈 Bias: Bullish (Long)
While momentum remains strong, be prepared for potential sharp corrections given overextension.
⸻
What do you think? Drop your thoughts below! 🚀👇
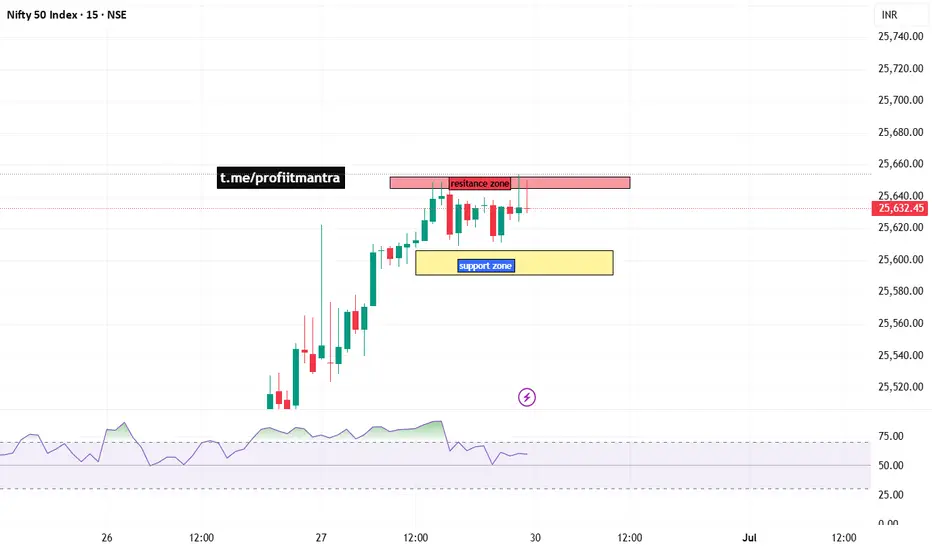
NIFTY 50 INDEX CHART ANALYSIS FOR INTRADAYNIFTY 50 INDEX CHART ANALYSIS FOR INTRADAY.
here we are seeing of nifty 50 index chart, and one is resistance and one box is support that is yellow color and if price will come to support and then we will try to find of buy opportunity. if support zone breaks then we will plan for sell of nifty and if break of resistance, then we will see big rally.
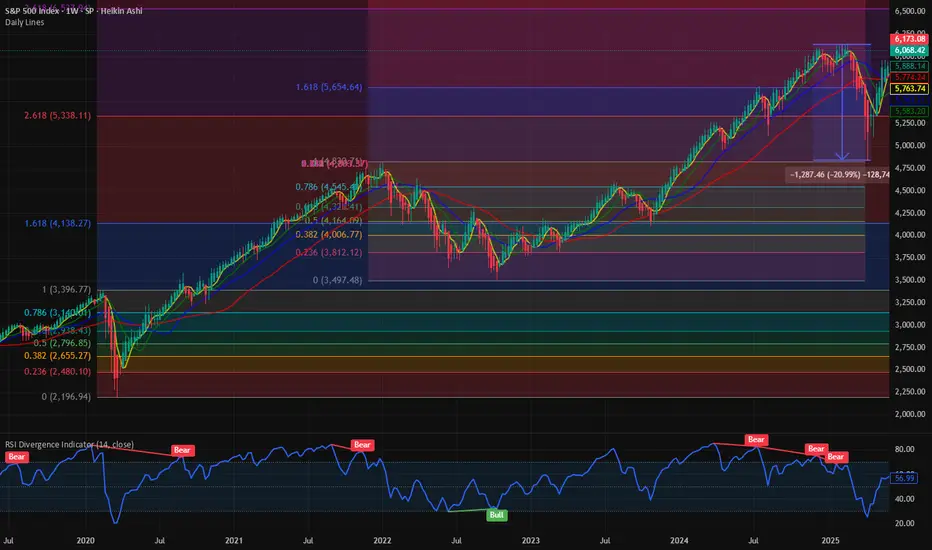
$SPX Path of least resistance is higher. Next Stop : 6500 This week we officially recovered all the losses from the liberation day low. We had a 20% bear market crash and since then there has been a V shaped rally in the major averages. NASDAQ:QQQ and SP:SPX have fully recovered the losses and then some. It is 0% form its ATH. We have been closely following the chart of SP:SPX for the last few weeks and have marked various Fib Retracement levels and Fib Extenstion. IN my opinion the Covid lows were one of the majot drawdown moments.
If we plot the Fib Extension on the COVID highs and lows, we can clearly see the Support and Resistance zones. As per the Fib Levels the next consequential level in SP:SPX will be 6550, which is the 3.618 Fib level. That I would suggest as the path to least resistance. First, we go higher before we can see any major correction. In case of a Major correction, we get support @ 5300.
Verdict : SP:SPX goes higher first before correction. 6550 is the next stop.
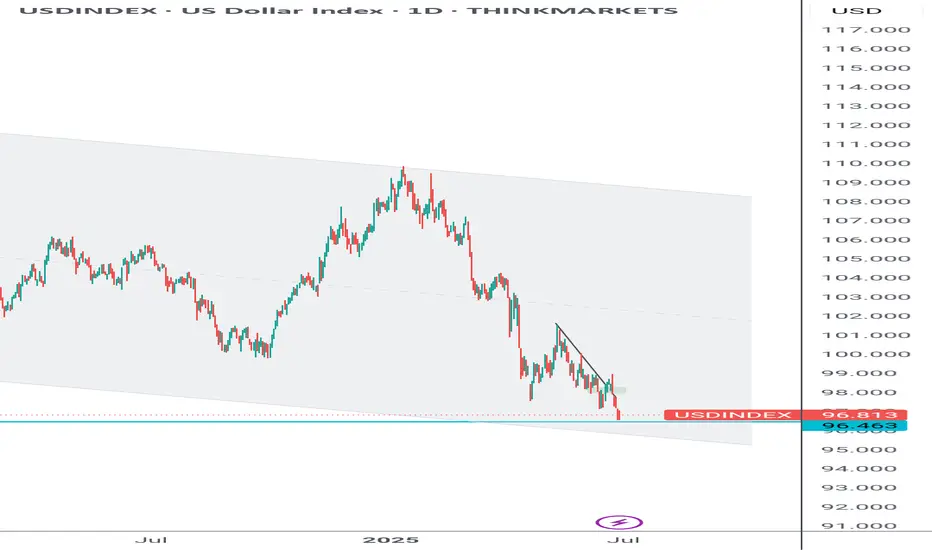
DXY STRONG DOWNTREND CONTINUES|SHORT|
✅DXY is going down currently
In a strong downtrend and the index
Broke the key structure level of 98.000
Which is now a resistance,
And after the pullback
And retest, I think the price
Will go further down next week
SHORT🔥
✅Like and subscribe to never miss a new idea!✅
Disclosure: I am part of Trade Nation's Influencer program and receive a monthly fee for using their TradingView charts in my analysis.
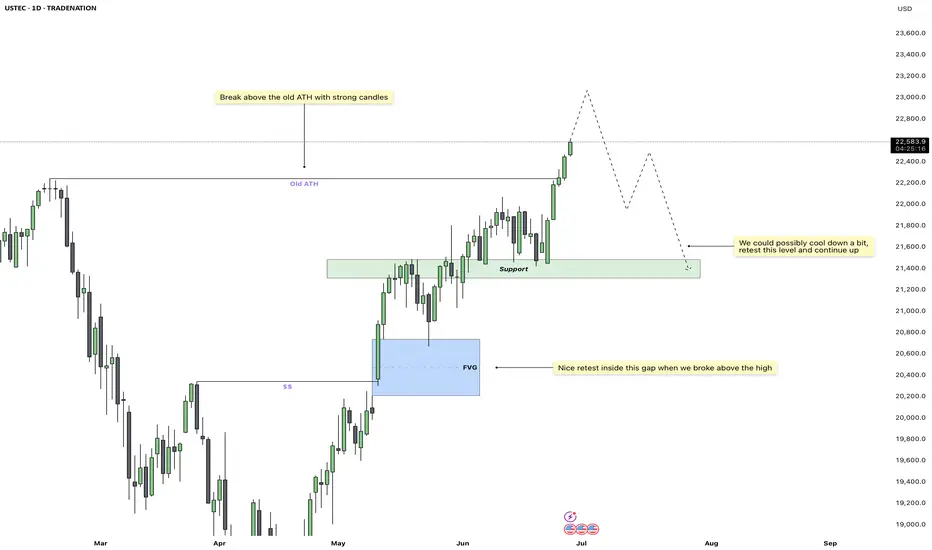
US100 – Extended Rally, Eyes on Pullback to Key SupportUS100 continues to show impressive strength, with no real signs of slowing down yet. The recent push above the previous all-time high came with strong bullish candles and high volume, confirming the breakout as legitimate rather than a false pump. This surge followed a clean retest of the fair value gap below, which acted as a springboard for the next leg higher.
Imbalance Retest and ATH Break
Before the breakout, price perfectly respected the FVG just above the 20,800 zone. That retest was crucial, showing institutional interest in defending higher prices. From there, the index cleared the old ATH with authority, and we are now trading comfortably above it, establishing new highs in the process.
Support Zone Outlook
While momentum remains bullish, the market doesn’t move in a straight line forever. A short-term cool-off is possible. I’m eyeing the marked-out support zone just above 21,400, which previously acted as resistance and now flips to demand. If we do pull back, this is the most logical area for buyers to step back in.
Potential Price Path
The dotted projection outlines two possible paths: one, a minor pullback followed by immediate continuation, and two, a deeper retest into the green support zone before resuming the uptrend. Both scenarios remain bullish as long as price stays above that support. A retest into this level would be healthy and provide a clean long entry for continuation.
Key Levels to Watch
The area around 21,400 to 21,700 is critical. If we revisit this zone, I’ll be watching for bullish price action to confirm continuation. On the upside, we’re now in price discovery mode, so upside targets are more open-ended, but 23,000+ becomes a magnet if momentum stays intact.
Conclusion
US100 is in strong bullish territory, with institutional signs backing the move. A pullback would be welcome and likely provide a high-probability long setup. Until the structure breaks, I remain bullish on this index, watching for a healthy dip into the support zone for potential continuation higher.
Disclosure: I am part of Trade Nation's Influencer program and receive a monthly fee for using their TradingView charts in my analysis.
___________________________________
Thanks for your support!
If you found this idea helpful or learned something new, drop a like 👍 and leave a comment, I’d love to hear your thoughts! 🚀
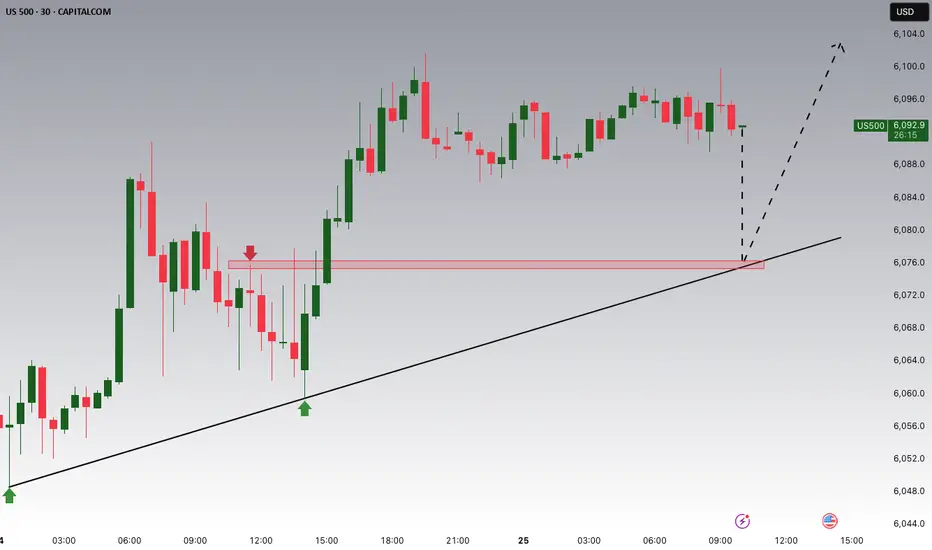
S&P500 Potential UpsidesHey Traders, in today's trading session we are monitoring US500 for a buying opportunity around 6,075 zone, S&P500 is trading in an uptrend and currently is in a correction phase in which it is approaching the trend at 6,075 support and resistance area.
Trade safe, Joe.
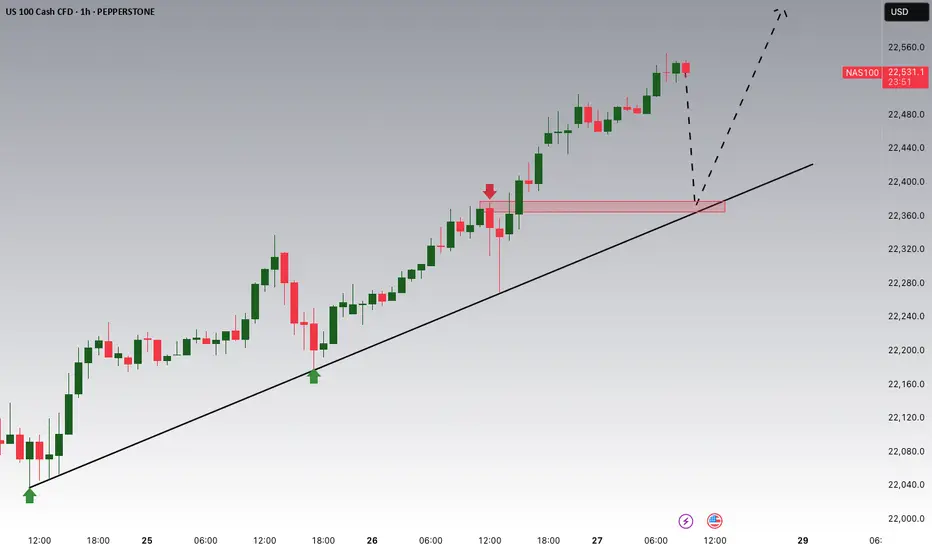
NASDAQ Potential UpsidesHey Traders, in today's trading session we are monitoring NAS100 for a buying opportunity around 22,380 zone, NASDAQ is trading in an uptrend and currently is in a correction phase in which it is approaching the trend at 22,380 support and resistance area.
Trade safe, Joe.
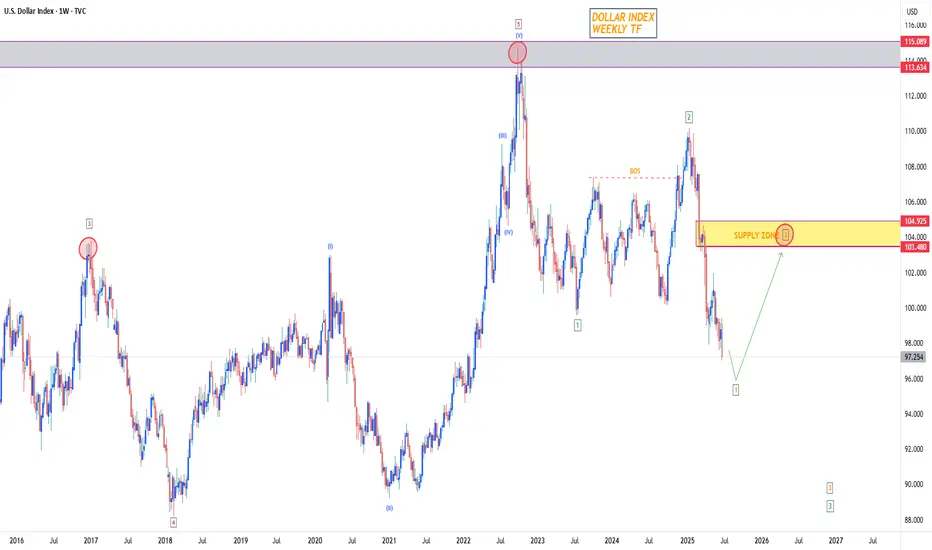
Dollar Bullish Correction To $103 - $105While we expected to see some Dollar upside in Q2, the economy was in such a bad state that the Dollar could not hold its value. Since the start of 2025 the Dollar is down 12% and this is only the beginning.
I believe we will see more downside in the future. But for the coming quarter there is a chance for the Dollar to get some breathing space & recover in the short term. Overall, the trend of the Dollar remains bearish, so what we want to keep an eye on is small pumps (short term recovery) into price zones which will allow us to short the Dollar back down.
I want to see a dip lower towards $96 - $94 before sellers lose bearish momentum. If this move takes place, then we can slowly see buyers step back into the market & start pushing back to the upside. Once price hits our ‘Supply Zone’ of $103 again, it’ll give us a more clear indication of what the Dollar will do next; whether that’s a longer term uptrend or a continuation to the downside.