#Nifty directions and levels for June 25:Good morning, Friends! 🌞
Here are the market directions and levels for June 25:
Market Overview
The global market is showing bullish sentiment, while our local market is still maintaining a moderately bullish bias.
However, Gift Nifty is indicating a positive start of 103 points today.
So, what can we expect today?
Once again, the same thing happened in the previous session — even though the market started with a positive bias, it couldn't sustain.
Structurally, we are still in a range-bound market,
so even if the market opens positive, we can expect a correction at some point.
Let’s look at the chart for more clarity.
Both Nifty and Bank Nifty appear to be showing a similar structure.
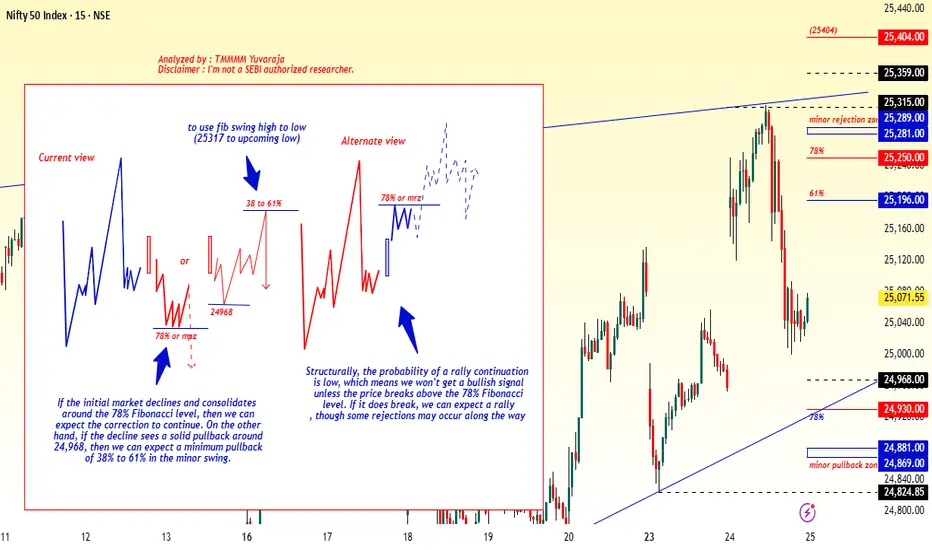
Current View
The current structure suggests that even if the market opens with a gap-up, it may not sustain.
If the initial market declines and consolidates around the 78% Fibonacci level, then we can expect the correction to continue.
On the other hand, if the decline sees a solid pullback around 24,968, then we can expect a minimum pullback of 38% to 61% in the minor swing.
Alternate View
Structurally, the probability of a rally continuation is low,
which means we won’t get a bullish signal unless the price breaks above the 78%,level.
If it does break, we can expect a rally, though some rejections may occur along the way.
Market indices
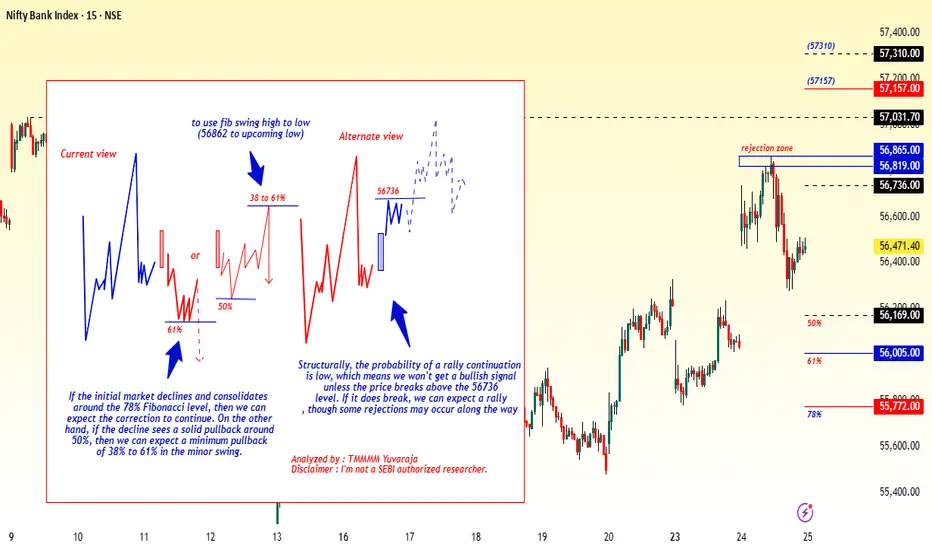
#Banknifty directions and levels for June 25:Current View
The current structure suggests that even if the market opens with a gap-up, it may not sustain.
If the initial market declines and consolidates around the 78% Fibonacci level, then we can expect the correction to continue.
On the other hand, if the decline sees a solid pullback around 50%, then we can expect a minimum pullback of 38% to 61% in the minor swing.
Alternate View
Structurally, the probability of a rally continuation is low,
which means we won’t get a bullish signal unless the price breaks above the 56736)level.
If it does break, we can expect a rally, though some rejections may occur along the way.
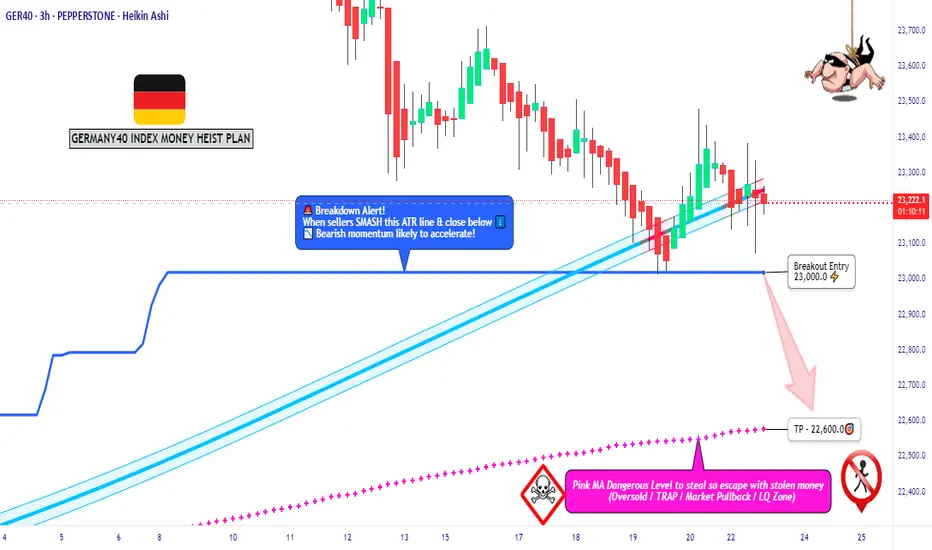
“GER40 Heist in Progress – Bearish Blueprint Deployed!”🦹♂️💼 “Operation: Black Forest Heist” – DAX Day/Swing Trade Plan 💼🦹♀️
📍Thief Trading Style | CFD Tactical Chart Blueprint | GER40 Recon Mission
🌟Hi! Hola! Ola! Bonjour! Hallo! Marhaba!🌟
Dear Money Movers, Risk Raiders & Precision Planners 🧠💸,
Suit up for a clean-cut operation on the Germany 40 (GER40) Index! 🎯
With our sharp-edged Thief Trading blueprint 🔪, we’re scanning for a potential bearish trap—market’s heating up with oversold setups and momentum cracks near key resistance. Watch for the green MA zone—we suspect it's where bullish imposters hide. 🕵️♂️📉
🔓 Entry Plan
“The vault’s cracking... get ready!”
Wait for price to breach the ATR Line (23000.0). Once the level is crossed cleanly, it’s go-time:
🧨 Use Sell Stop orders just under the breakout
🎣 Or hunt pullback setups on 15m/30m charts with Sell Limit entries at resistance
🔐 Stop-Loss Strategy
Keep it tight. Protect your loot.
🚧 Place SL around swing high/low on the 4H chart (e.g. 23400.0)
⚖️ Adapt SL based on lot size, risk appetite, and number of entries
🎯 Target Zone
Mission Objective: 22600.0
Or exit earlier if the security alarm (price action shift) starts ringing. Don't get greedy—get out smart. 💼🚪💨
📉 Market Outlook:
Current trend: Neutral but suspiciously wobbly – early signs of bearish dominance. 🐻
This trade aligns with multiple signals:
📊 Technical: Consolidation near highs
💼 Fundamental: Macro & news risks
🧠 Sentiment: Crowd leaning long = opportunity for reversal
📰 Caution Note – News Events = Laser Tripwires
Stay sharp during releases!
Avoid new setups when big headlines drop
Use trailing stops to secure gains on running trades
Position smart, manage tighter, act quicker 🕶️
💥 Smash that Boost Button if this plan sharpens your edge or adds value to your mission! 💥
Together, we move like shadows and strike like lightning—Thief Traders never miss a clean setup.⚔️🕵️♀️
Stay tuned for the next raid… the market’s full of opportunities waiting to be unlocked. 🗝️🚀
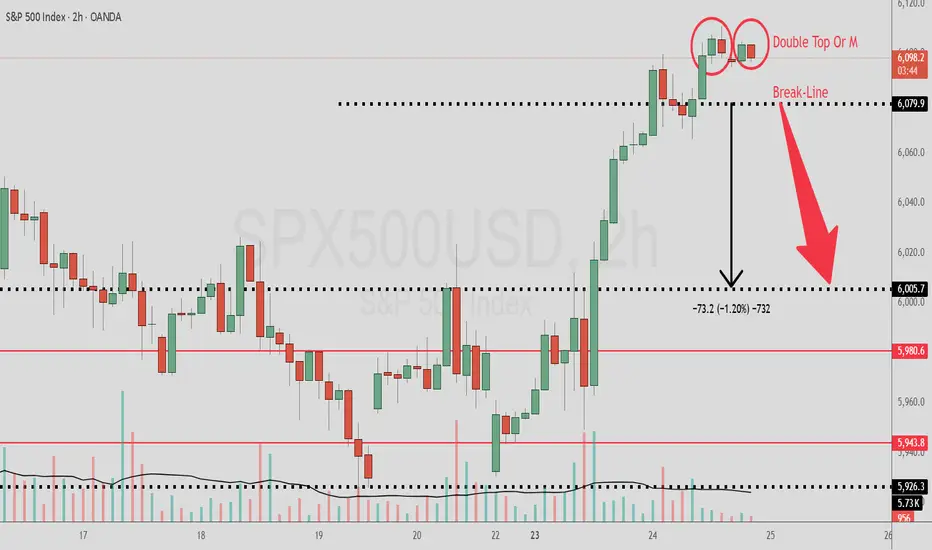
Double Top Or M Pattern On SPXTraders and Followers , we have another opportunity in SPX/USD .
2 hr chart shows me a M pattern or double top. Lot's of points can be made if one takes a short position if the break-line 6079.9 area gets taken out. I have a sell stop just below that area and looking for 6005.7 as a target area.
A good trader waits for price to setup before entering any trade .
Best of luck in all your trades $$$
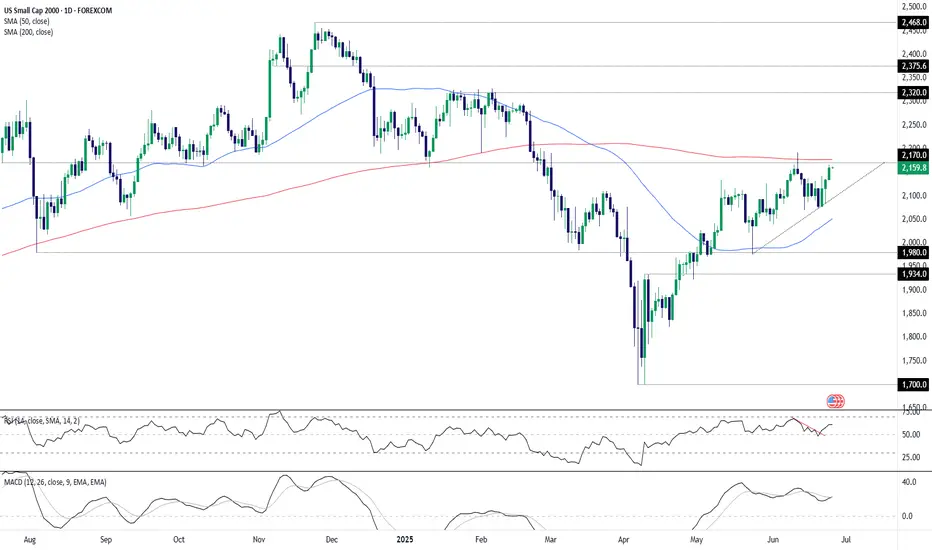
U.S. Small Caps Eye Breakout as Fed Rate Cut Bets BuildUnless it’s accompanied by a recession, there are few things U.S. small cap stocks enjoy more than rate cuts—especially given how many rely on the kindness of others to fund their growth ambitions. With another soft core PCE report expected at the end of the week, and with some Fed officials signalling a preparedness to cut rates again as soon as July, the ducks look to be lining up for a potential bullish break in the U.S. Small Cap 2000.
Recent price action backs this up, coiling within an ascending triangle on the daily chart just beneath horizontal resistance at 2170 and the key 200-day moving average just above. Price momentum is also on board, with RSI (14) breaking its downtrend and moving further above 50. MACD has crossed the signal line above zero, reinforcing the bullish message.
One look at how price has interacted with the 200-day moving average in the past suggests the higher probability play would be to wait for a break and close above the level before establishing longs, allowing a stop to be placed beneath it or 2170 for protection against reversal.
2320 looms as an obvious target, coinciding with a known resistance level. If hit, traders can assess whether to cut, hold or reverse the trade depending on how price reacts at that level.
Good luck!
DS
XAUUSD
🚨 Smart Money Sniper Signal – XAU/USD (Gold)
🕒 Timeframe: M15 or H1
📅 Date: June 25, 2025
---
🔍 Market Context
Current price: ~$3,326
Market structure: Bullish on H1
Liquidity grab zone: Observed around $3,322
Order block support: $3,318 – $3,322
RSI: Above 50 (bullish momentum)
---
🟢 Buy Setup (Sniper Entry)
Entry zone: $3,322 – $3,324 (on bullish confirmation)
Confirmation: Bullish engulfing or strong bullish candle on M15
Stop Loss: Below $3,318
Take Profit targets:
TP1: $3,330
TP2: $3,336
TP3: $3,344
🧠 Tip: Use a Risk:Reward ratio of at least 1:2. Set trailing stop once TP1 is reached.
---
🔴 Sell Scenario (If invalidation)
If price breaks below $3,318 with volume:
→ Wait for a retest of the zone and enter SELL
TP1: $3,312
TP2: $3,304
---
🔔 For TalionPromosal (TradingView page)
Use this caption for your idea post:
> 💥 Smart Money Signal (Gold – M15/H1)
Bullish structure still valid. Looking for sniper entry near $3,322 with OB + RSI confluence.
SL below $3,318. TP targets $3,330 / $3,336 / $3,344.
Risk-managed & institutionally aligned setup.
#SmartMoney #XAUUSD #Gold #SniperEntry #TalionPromosal #TradingView
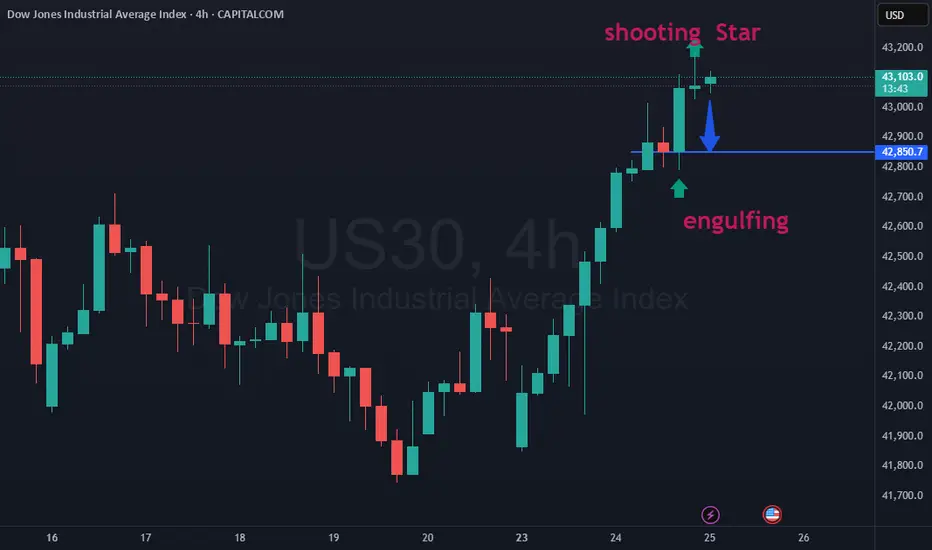
us30 analysis 25-06-2025There was engulfing in the 4 hour candle and the next candle was a shooting star. So there is a lot of liquidity in the previous engulfing. So the market can come to 22092 to grab this liquidity. However, to take an entry, you should take confirmation of lower time frames like 1 minute, 5 minutes.
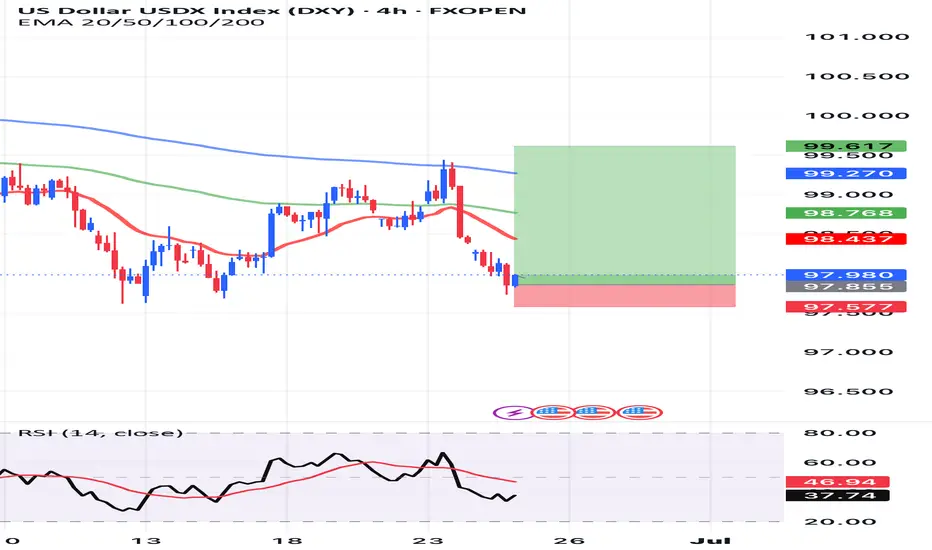
DXYThe DXY (U.S. Dollar Index) measures the strength of the U.S. dollar against a basket of major world currencies — mainly the euro, yen, pound, Canadian dollar, Swedish krona, and Swiss franc.
What it tells you:
• If DXY rises → The dollar is getting stronger overall.
• If DXY falls → The dollar is weakening.
Why DXY matters:
• It reflects global demand for the U.S. dollar.
• It reacts to U.S. interest rate decisions, inflation data, recession fears, geopolitical tensions, etc.
• Traders and investors use it to gauge the dollar’s trend — helping in decisions like shorting EUR/USD, buying gold, or trading commodities.
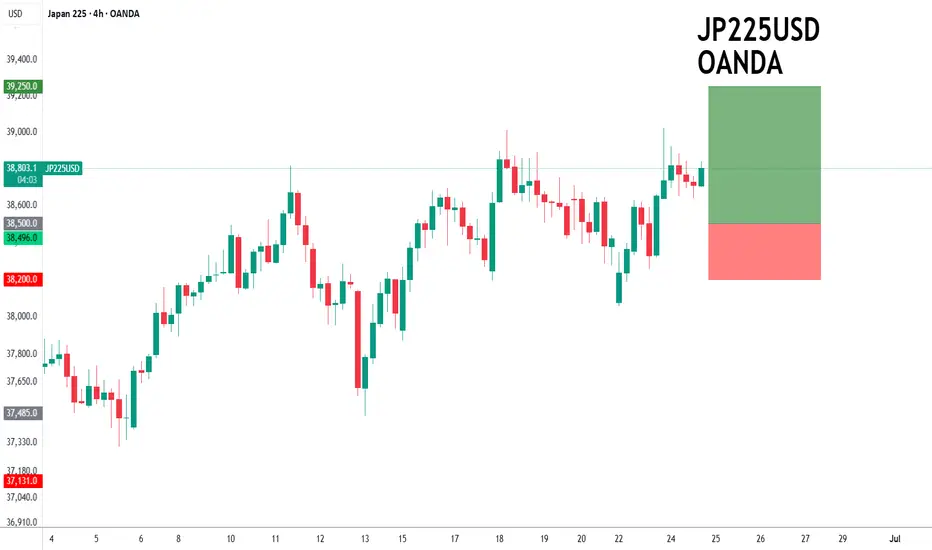
Nikkei to continue in the upward move?NIK225 - 24h expiry
Short term RSI has turned positive. Further upside is expected.
Risk/Reward would be poor to call a buy from current levels.
A move through 38750 will confirm the bullish momentum.
The measured move target is 39500.
We look to Buy at 38500 (stop at 38200)
Our profit targets will be 39250 and 39500
Resistance: 39000 / 39250 / 39500
Support: 38500 / 38250 / 38000
Risk Disclaimer
The trade ideas beyond this page are for informational purposes only and do not constitute investment advice or a solicitation to trade. This information is provided by Signal Centre, a third-party unaffiliated with OANDA, and is intended for general circulation only. OANDA does not guarantee the accuracy of this information and assumes no responsibilities for the information provided by the third party. The information does not take into account the specific investment objectives, financial situation, or particular needs of any particular person. You should take into account your specific investment objectives, financial situation, and particular needs before making a commitment to trade, including seeking advice from an independent financial adviser regarding the suitability of the investment, under a separate engagement, as you deem fit.
You accept that you assume all risks in independently viewing the contents and selecting a chosen strategy.
Where the research is distributed in Singapore to a person who is not an Accredited Investor, Expert Investor or an Institutional Investor, Oanda Asia Pacific Pte Ltd (“OAP“) accepts legal responsibility for the contents of the report to such persons only to the extent required by law. Singapore customers should contact OAP at 6579 8289 for matters arising from, or in connection with, the information/research distributed.
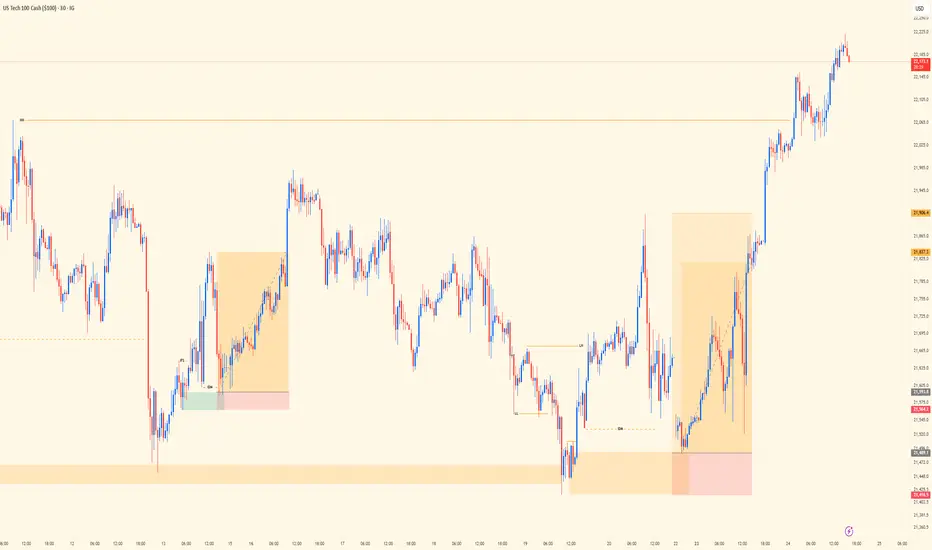
NASDAQ Midweek Review | Trend, Liquidity, PrecisionSingle-chart post today showing the execution trail behind two solid wins on NASDAQ.
Top-down bias was aligned — bulls clearly in control, so I stuck with trend direction. No need to fight momentum. As a trend trader, I don’t counter — that mindset shift alone is what keeps me consistent and clean with entries.
Chart shows the 30M view — where structure, liquidity, and timing came together. Both setups were built off elite structure reads. Liquidity played its part: manipulation, sweep, confirmation, and execution.
Bias: Bullish
HTF Alignment: Bullish trend continuation
Entry Frame: 30M precision
Key Insight: Liquidity isn’t noise — it’s narrative.
Mindset Note: Counter-trading is a shortcut to inconsistency. Stay with flow, respect structure.
Bless Trading!
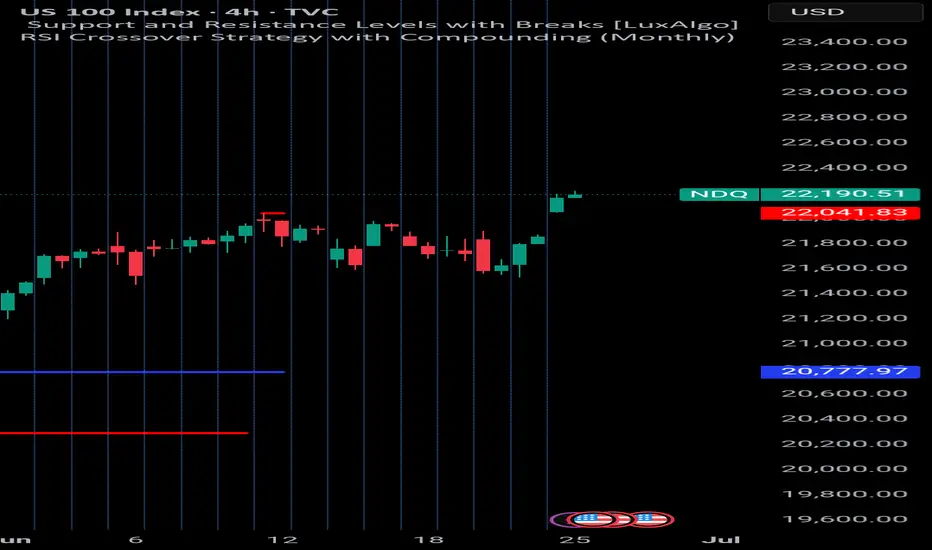
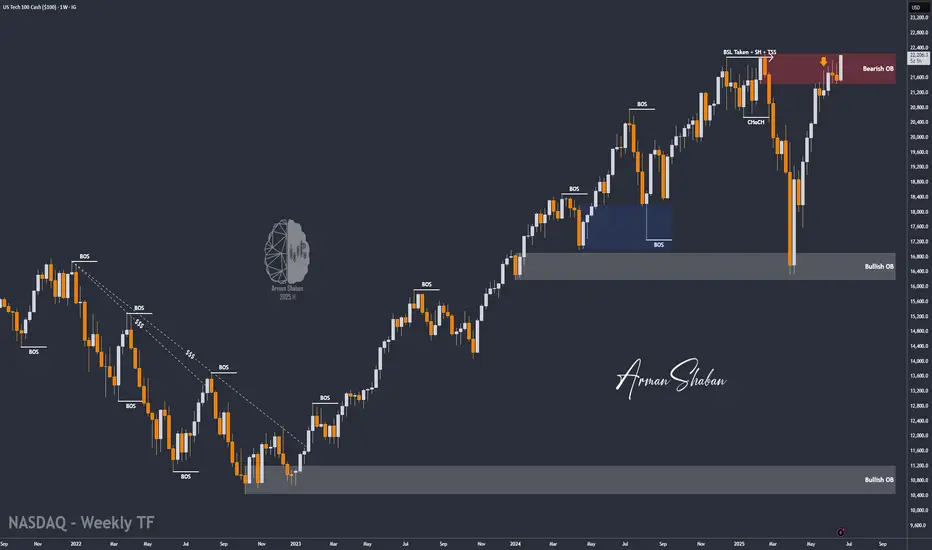
Nasdaq Surges on Ceasefire Hopes – New All-Time Highs Ahead?By analyzing the #Nasdaq chart on the weekly timeframe, we can see that the index experienced a strong rally following the ceasefire announcement between Iran and Israel, climbing as high as 22,200 so far. If the ceasefire holds and tensions continue to ease, we could see a new all-time high for the Nasdaq.
Potential bullish targets for this move are 22,400, 23,200, and 24,000.
Please support me with your likes and comments to motivate me to share more analysis with you and share your opinion about the possible trend of this chart with me !
Best Regards , Arman Shaban
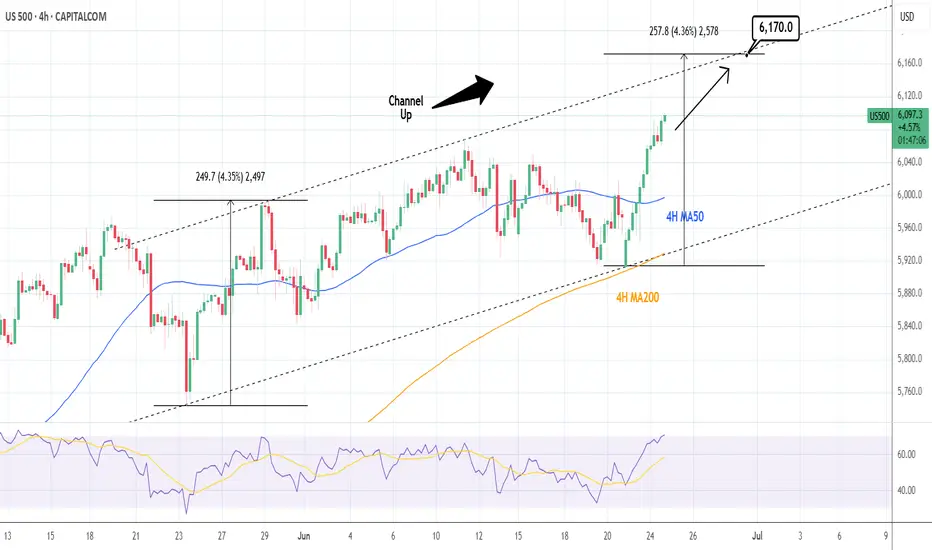
S&P500: Channel Up targeting 6,170.S&P500 is bullish on its 1D technical outlook (RSI = 65.737, MACD = 75.400, ADX = 16.727), unfolding the new bullish wave of the 1 month Channel Up, after a bottom near the 4H MA200. The first bullish wave one reached +4.35%, we expect to repeat that so for a few more candles we will remain bullish, TP = 6,170.
## If you like our free content follow our profile to get more daily ideas. ##
## Comments and likes are greatly appreciated. ##
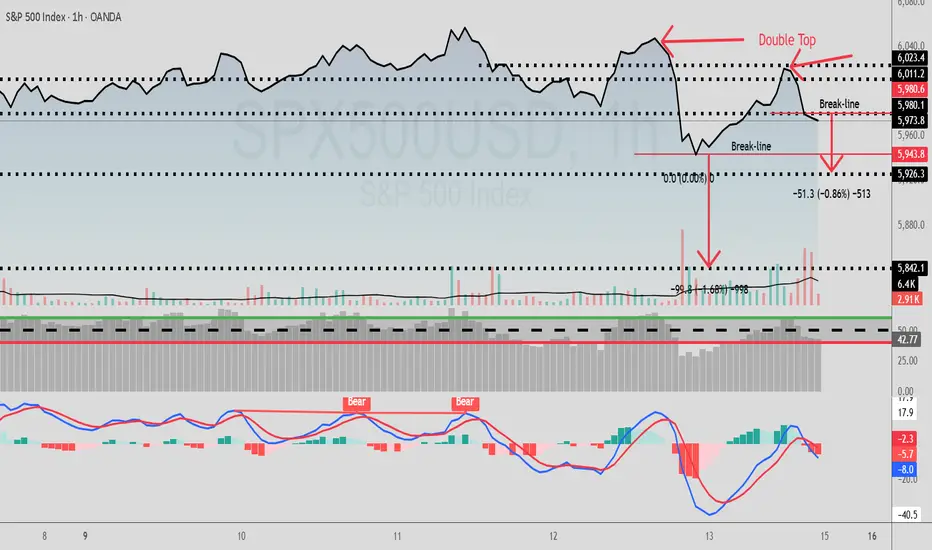
SPX/USD Has A Double Top Pattern On The 1Hr Hey Traders and following gang!
Hope all are raking in profits on all your trades.
I spotted this double top setup on the 1hr SPX/USD.
A break below 5980.6 triggers a short down to target-1 5926.3
A break below 5943.8 triggers a short down to target-2 5842.1
A little scuffle in the Mid East helps this market fall so, short the ticker .
Best of luck in all your trades my friends and stay profitable $$$
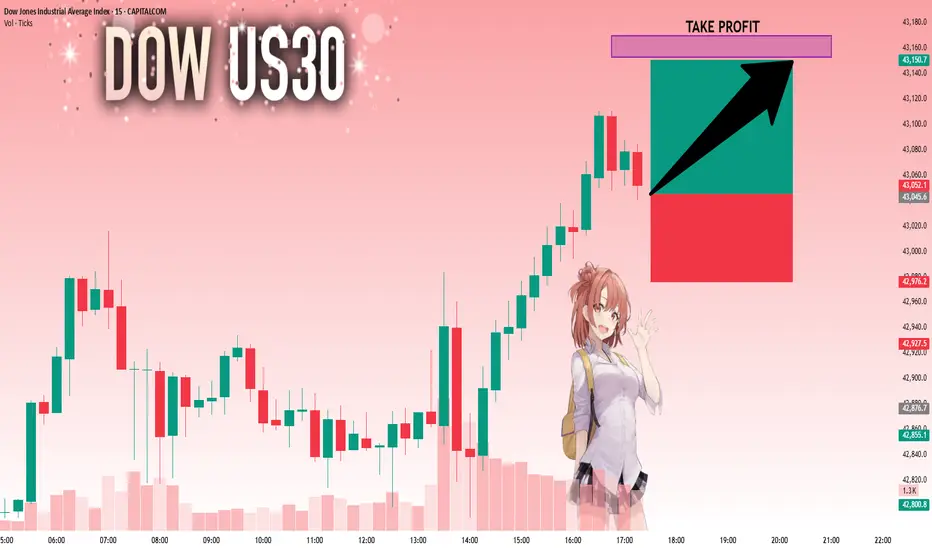
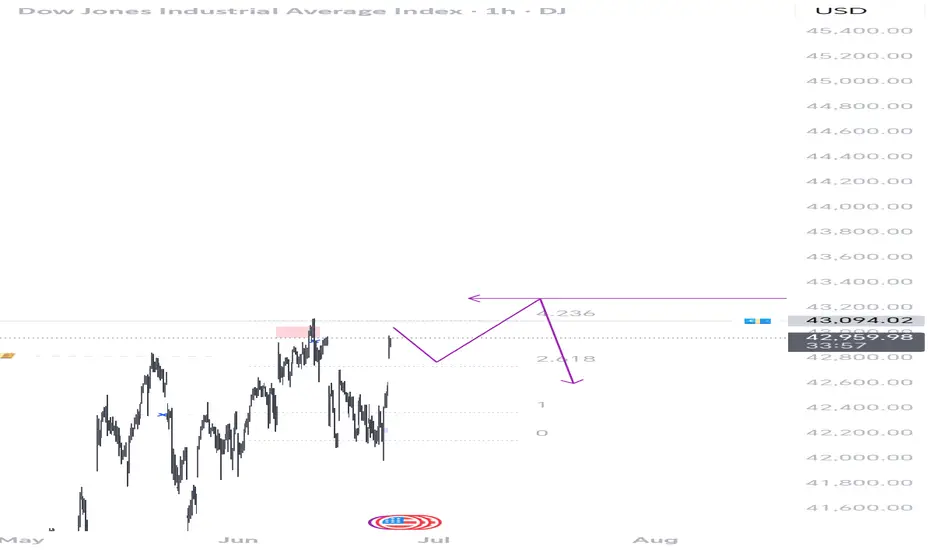
US30: The Market Is Looking Up! Long!
My dear friends,
Today we will analyse US30 together☺️
The price is near a wide key level
and the pair is approaching a significant decision level of 43,045.6 Therefore, a strong bullish reaction here could determine the next move up.We will watch for a confirmation candle, and then target the next key level of 43,152.9.Recommend Stop-loss is beyond the current level.
❤️Sending you lots of Love and Hugs❤️
Nasdaq: Bull flag breakout on daily chart, testing ATHsBeen a while since I last posted. So figured I'd share this quick chart. Market undoubtedly have been incredibly volatile this month. However luckily, the Nasdaq has been forming bull flag on the daily chart. This follows a strong prior uptrend. The breakout took place today, sending the index to test ATHs.
Notable stocks making a move are names like NASDAQ:AMZN and NASDAQ:NVDA , mainly due to the broader market strength. Other indices, such as the S&P 500 ( SP:SPX ) also are breaking out as they form a similar bull flag pattern.
At ATHs, this is a deciding factor of where the market goes next. Either it bounces off to near-term support, or the market rallies to a new all-time high until next cooldown.
Note: not financial advice

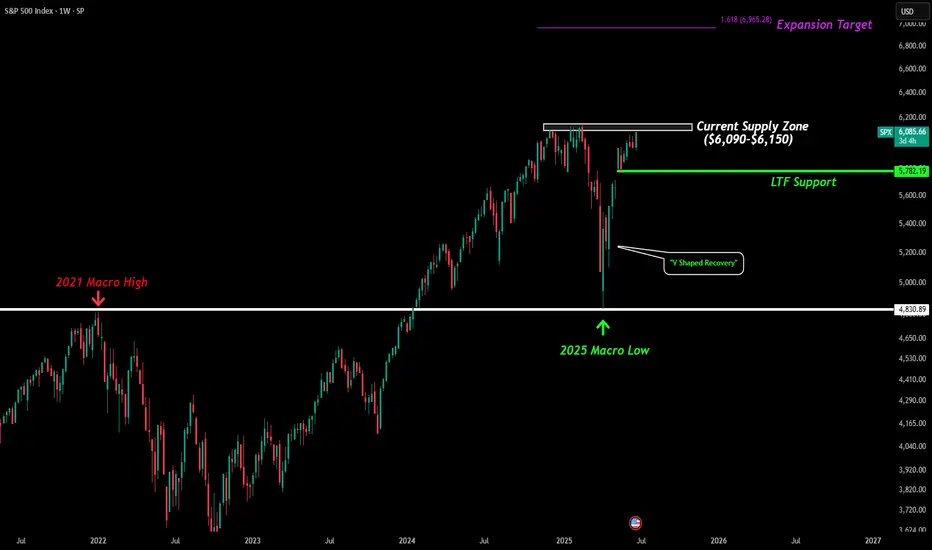
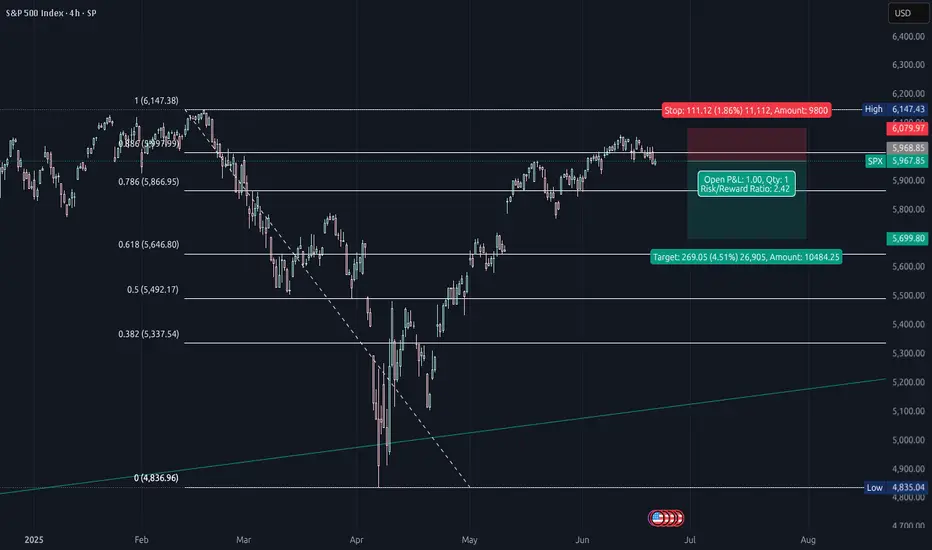
S&P 500 - Pay Attention All the world events going on right now has put the S&P in a very interesting position. Even on the brink of war we have seen the SPX pushing towards all time highs. Right now it is entering the major supply zone (where we have seen many tops form) between $6,090 and $6,150. This supply zone has been forming since Dec 2024 and is very important to keep and eye on. Either price will create a macro double top/M pattern and lead us back towards the lows, or we will break above this supply zone a start the expansion phase towards our 1.618 which is currently just slightly below $7k.
The macro looks amazing as our lower white line represents of 2021 previous ATH and during the tariff collapse perfectly got flipped into a new level of support which we represent as our 2025 Macro Low.
The short term is also looking decent. We have identified price is about to enter major resistance so if we do see a pullback we want to target that $5,800 level as the level buyers need to hold to continue momentum. If buyers can push price to new highs in the short term we expect to see that move towards $7k by the end of the year.
SPX short analysisLike I wrote in my EUR/USD analysis you never know what could happened.
USA bombed Iran!
This could have huge impact on the US market next week.
My guess is temporarily short... At least to close this gap in spot price of SPX.
Since we're still in bearish market, until we see new highs, and this could be catalyst for another sell off. So the jump could be even bigger and we could see new ATH this year.
For now, I'm seeking a position to short tomorrow after market is open.
This is my entry mark.
There will be higher volatility. However, I expect US market to open in the red, close the gap and to sell off again.
We shall see!
Trade safe this one :)
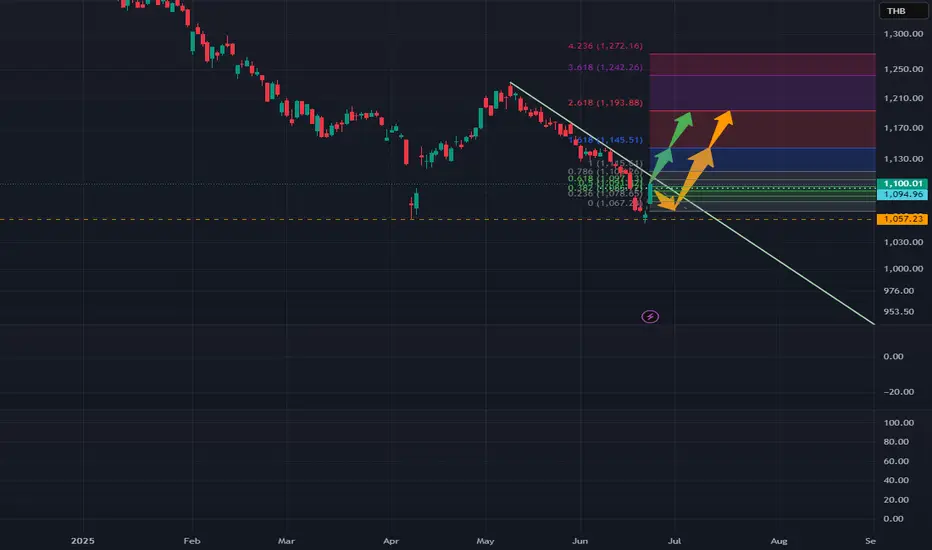
Analysis on SET INDEX: Time to BetHey yo,
Today, SET index create the very strong rejection bar.
As a result, the overall momentum become upward despite being downtrend.
As i analyzed down into the smaller timeframe,
I think how they would behave can be decided into 2 cases.
First, can stay above 1095, it would likely hit the 1140 target. if broken, next target 1193
Second, cannot stay above 1095, it would go back to create sub-second leg around 1065.
Then if can hold at the level, it would go to 1140 too.
This is personal opinion. Dont take it too serious.
Best Regards,
TraderPP,
short within and without rangesbasicly i dont know what will happen
do i predict?
yes
do i react?
maybe
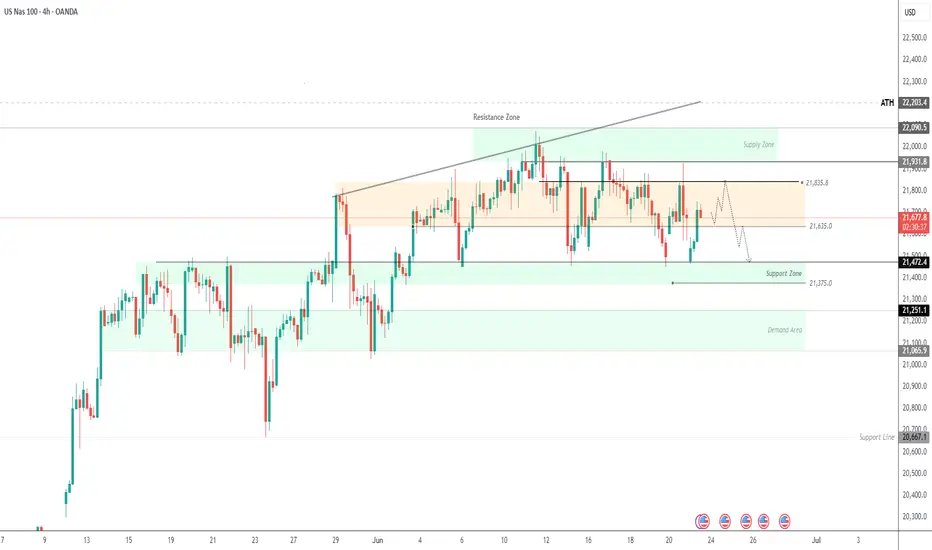
USNAS100 Technical Setup: Watching 21635 and 21835 LevelsUSNAS100 – Technical Outlook
The price has stabilized above the key pivot level at 21635, indicating potential short-term upside toward the resistance at 21835.
However, as long as the price trades below 21835, the broader bias remains bearish. A confirmed 1H close below 21635 would reintroduce downside pressure, targeting 21470 and potentially extending toward 21375 and 21250.
Pivot Level: 21635
Support: 21470, 21375, 21250
Resistance: 21835, 21930, 22090
previous idea:
Nasdaq shortAiming for asian lows.
let us see if there is at least a small pullback .
1:2 risk reward ratio.

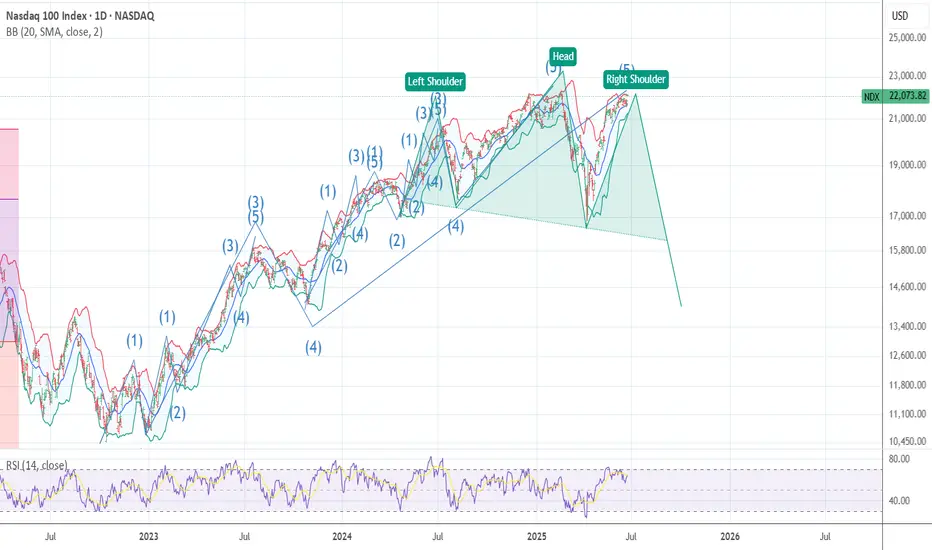
MAOR HEAD N SHOULDER TOP FORMATION I AM 100 % SHORT NOW The chart posted is that on the NDX 100 .This is my view of what has formed . best of trades WAVETIMER
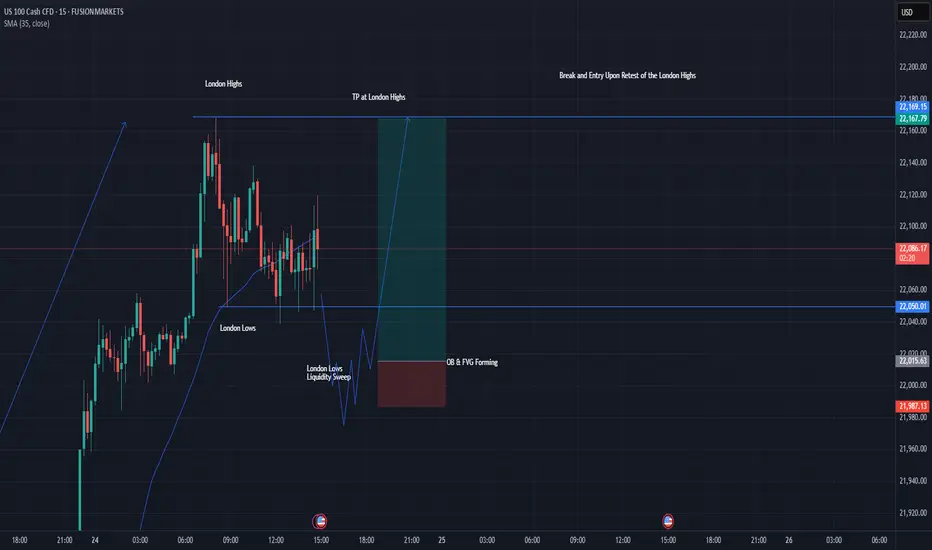
Bullish IdeaExplained on graph. I justify the bull using OB and FVG and sweeps of Liquidity from London lows, if all aligns I will take this trade.