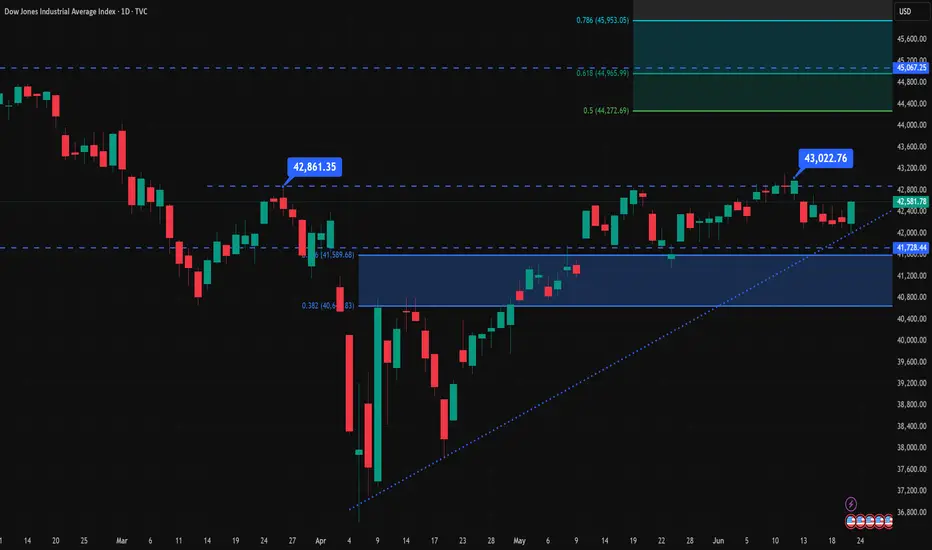
Dow Jones eyeing a breakout as war fears de-escalate!Dow Jones Industrial Average (DJIA) stands at 42,581.78 points, reflecting a 0.9% increase from the previous day. This uptick is attributed to investor optimism following a restrained retaliatory missile strike by Iran on a U.S. base in Qatar, which was perceived as non escalatory. Additionally, comments from Federal Reserve Governor Michelle Bowman suggested support for a potential interest rate cut in July, contingent on sustained low inflation .
The DJIA's performance this year shows a modest gain of 0.1%, underperforming compared to the S&P 500's 2.4% increase and the Nasdaq's 1.7% rise. Notably, the index is approximately 6.4% below its all-time high of 45,073.63 reached in December 2024 .
From a technical perspective, the DJIA is trading just above the 42,000 level, with key support around 41,500 and resistance near 43,000. The index has recently faced challenges breaking through the 42,600 mark, indicating potential short-term volatility. Market participants are closely monitoring upcoming economic data and Federal Reserve decisions, which could influence the index's trajectory in the near term.
For investors, the current environment presents opportunities to assess the DJIA's performance relative to other indices, considering factors such as geopolitical developments and monetary policy expectations.
"The forecasts provided herein are intended for informational purposes only and should not be construed as guarantees of future performance. This is an example only to enhance a consumer's understanding of the strategy being described above and is not to be taken as Blueberry Markets providing personal advice."
Market indices
Dow Jones Gains on Rate Cut Hopes and Ceasefire Relief US30 OVERVIEW
Wall Street Rises on Fed Rate Cut Hopes and Geopolitical De-escalation
The Dow Jones (US30) remains under bullish pressure, supported by rising expectations of a Federal Reserve rate cut later this year and a ceasefire agreement between Iran and Israel, which has eased market tensions.
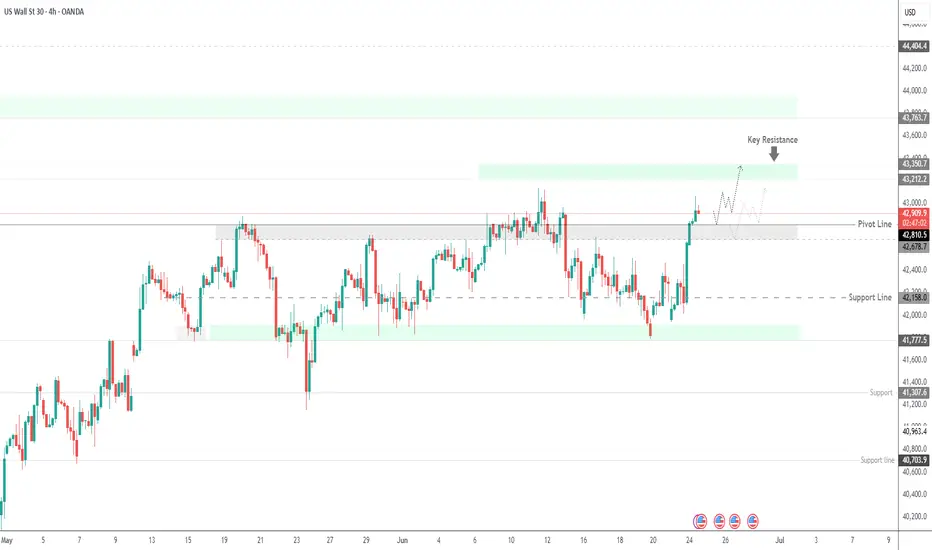
TECHNICAL OUTLOOK – US30
The price maintains a bullish bias as long as it trades above the pivot level at 42,810, with upside potential toward the key resistance at 43,210.
A short-term bearish correction is possible toward 42,810 or even 42,670, but the broader structure remains bullish above these levels.
Resistance Levels: 43,060 → 43,210 → 43,350
Support Levels: 42,670 → 42,420 → 42,160
A sustained break below 42,670 could signal deeper correction, while a clear move above 43,210 would confirm continued bullish momentum.
Risk and Probability in Trading — Why Risk Assessment MattersRisk and Probability in Trading — Why Risk Assessment Matters More Than Chasing the “Holy Grail”
In trading, most participants and analysts are focused on finding the so-called “Holy Grail” — the perfect entry point where the price moves in the desired direction and yields profit. However, few actually assess the risks involved, as if success is possible without factoring them in. Market reviews are often filled with levels, forecasts, and price directions, but rarely include probability estimates or potential losses.
In my view, the real Holy Grail isn't a guaranteed profitable entry, but a scenario where the market offers a position with minimal risk relative to historical context. To identify such setups, we need a risk scale based on historical data — how favorable the current risk-to-reward ratio is compared to the past.
It’s also crucial to understand that no one can predict price direction with certainty. The key to opening a position is not hope, but evaluating all possible scenarios — upward, downward, or sideways — and knowing the outcome in each case. Risk management is more than just placing a stop-loss; it’s a structured approach that should be central to any trading strategy.
What Are Minimal Risks?
“Minimal risk” is a relative concept — it only makes sense when measured against a defined scale. Building such a scale requires historical statistics: what were the maximum and minimum losses and profits for similar positions in the past?
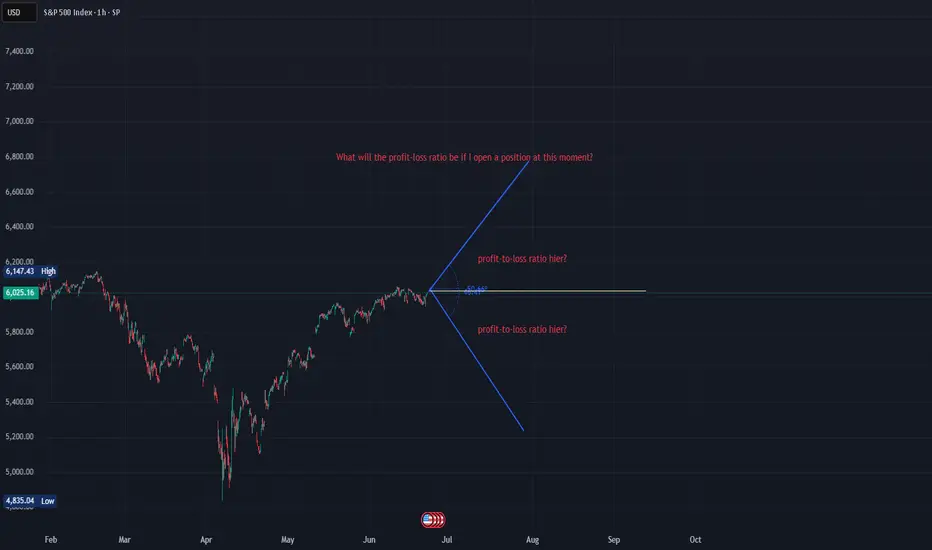
Profit-to-Loss Ratio
The idea behind the search for the “Holy Grail” is to find moments when the market offers the best possible profit-to-risk ratio. For example, if the current ratio is 10, and historically it has ranged from 0 (low risk) to 100 (high risk), then 10 may be a good entry point. If the ratio approaches 80–90, it signals that the position is extremely risky.
Why Are Probability and Risk Assessment Important?
Market reviews often talk about resistance levels, volatility, and price direction — but rarely address the risks of different scenarios. No expert can predict market movements with certainty — if they could, they’d be billionaires. Opening positions without accounting for risks and scenario probabilities is extremely dangerous.
How to Factor in Risks When Entering a Position
The key question is: what will the profit-to-loss ratio be after entering a position, depending on whether the price goes up, down, or stays flat? It’s important to understand the consequences of each case and make decisions based on risk assessment.
Risk Management Must Account for the Inability to React Instantly
Conventional tools like stop-losses and limit orders often fail to protect capital effectively during sudden price spikes. These tools are particularly vulnerable when market makers or high-frequency algorithms trigger stop levels en masse.
This highlights the need for more resilient risk management instruments — ones that can respond to volatility instantly and automatically. Options are one such tool, capable of limiting losses regardless of market dynamics.
Without robust risk management, long-term profitability becomes statistically unlikely. Sooner or later, the market will present a scenario that can wipe out your capital — unless you’re properly protected.
Important note: this is not an endorsement of options or any specific broker. It’s simply a conclusion based on the logic of building effective capital protection. If a broker only provides access to linear instruments (futures, spot, stocks) without the ability to hedge, it will inevitably lead to capital erosion — even for systematic traders.
And if this article gets more than 100 rockets, I’ll continue sharing specific examples of low-risk trading assessments.
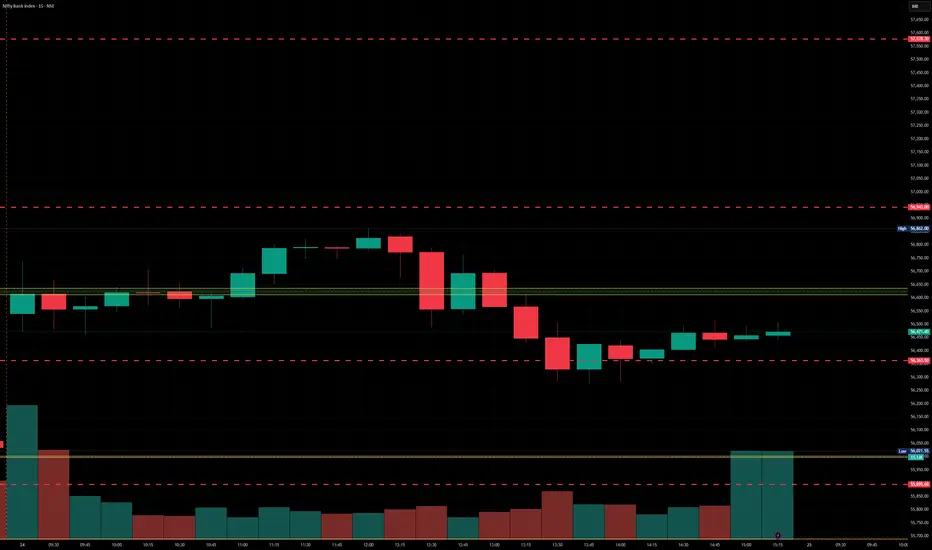
BankNifty levels - Jun 25, 2025Utilizing the support and resistance levels of BankNifty, along with the 5-minute timeframe candlesticks and VWAP, can enhance the precision of trade entries and exits on or near these levels. It is crucial to recognize that these levels are not static, and they undergo alterations as market dynamics evolve.
The dashed lines on the chart indicate the reaction levels, serving as additional points of significance. Furthermore, take note of the response at the levels of the High, Low, and Close values from the day prior.
We trust that this information proves valuable to you.
* If you found the idea appealing, kindly tap the Boost icon located below the chart. We encourage you to share your thoughts and comments regarding it.
Wishing you successful trading endeavors!
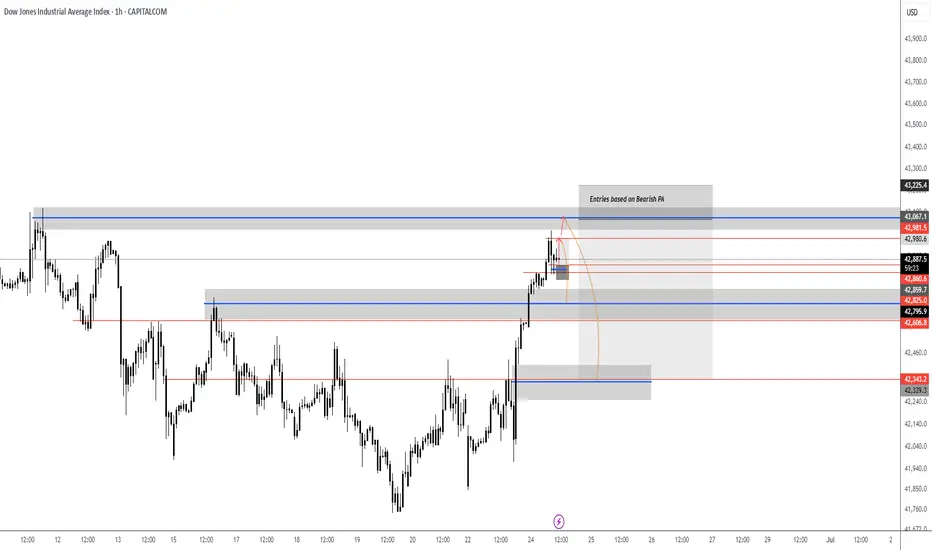
US30 - Intraday long scalp then short Looking for that intraday scalp on the long around 120 points can hold potentially further up to our higher supply level. If bearish PA is confirmed around the 43,000 level can look to take this short. All dependent on PA.
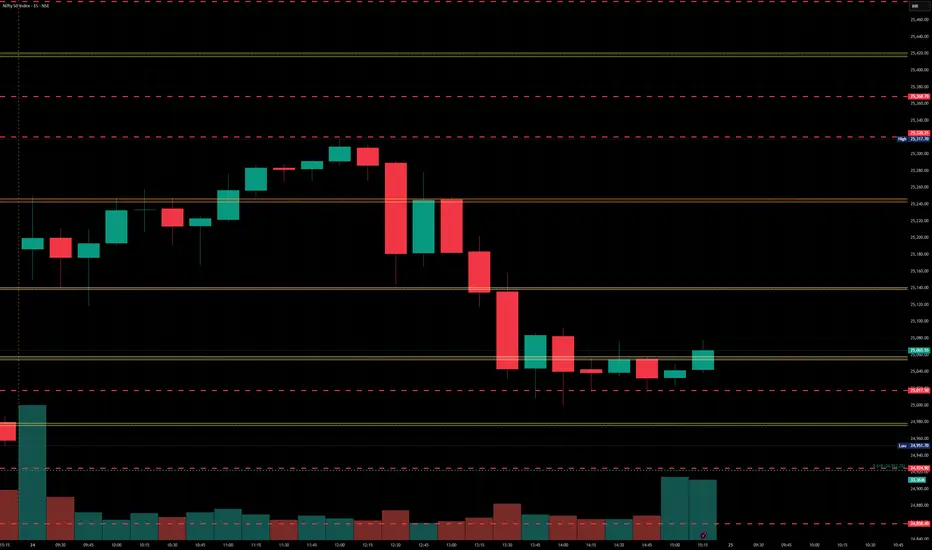
Nifty levels - Jun 25, 2025Nifty support and resistance levels are valuable tools for making informed trading decisions, specifically when combined with the analysis of 5-minute timeframe candlesticks and VWAP. By closely monitoring these levels and observing the price movements within this timeframe, traders can enhance the accuracy of their entry and exit points. It is important to bear in mind that support and resistance levels are not fixed, and they can change over time as market conditions evolve.
The dashed lines on the chart indicate the reaction levels, serving as additional points of significance to consider. Furthermore, take note of the response at the levels of the High, Low, and Close values from the day prior.
We hope you find this information beneficial in your trading endeavors.
* If you found the idea appealing, kindly tap the Boost icon located below the chart. We encourage you to share your thoughts and comments regarding it.
Wishing you success in your trading activities!
Stock Markets Rebound Following Trump’s Ceasefire AnnouncementStock Markets Rebound Following Trump’s Ceasefire Announcement
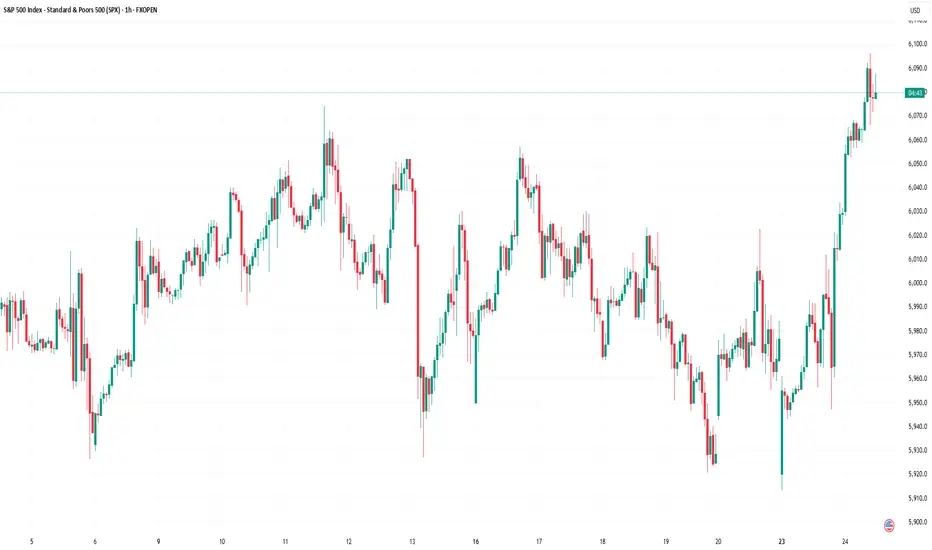
Last night, U.S. President Donald Trump made a social media post announcing a ceasefire agreement between Iran and Israel. According to his own words, the ceasefire is set to last “forever.” This announcement triggered a sharp bullish impulse (indicated by the blue arrow) on the S&P 500 index chart (US SPX 500 mini on FXOpen), pushing the price to a new high above the 6074 level.
Just yesterday, traders feared that the United States could be drawn into yet another costly war following bomber strikes on Iran’s nuclear facilities. However, today the stock markets are recovering, signalling growing optimism and a waning of fears over a major escalation of the conflict.
Technical Analysis of the S&P 500 Chart
When analysing the S&P 500 index chart (US SPX 500 mini on FXOpen) seven days ago, we identified an ascending channel. The angle of the trend remains relevant, while the width of the channel has expanded due to the downward movement caused by tensions in the Middle East.
Notably:
→ the price marked the lower boundary of the channel as well as the internal lines (shown by black dots) dividing the channel into quarters;
→ the latest bullish impulse suggests that the upward trend is resuming after breaking out of the correction phase (indicated by red lines).
It is possible that in the near future, the S&P 500 index (US SPX 500 mini on FXOpen) could reach the median line of the channel. There, the price may consolidate, reflecting a balance between buyers and sellers—particularly if the peace in the Middle East proves to be lasting.
This article represents the opinion of the Companies operating under the FXOpen brand only. It is not to be construed as an offer, solicitation, or recommendation with respect to products and services provided by the Companies operating under the FXOpen brand, nor is it to be considered financial advice.
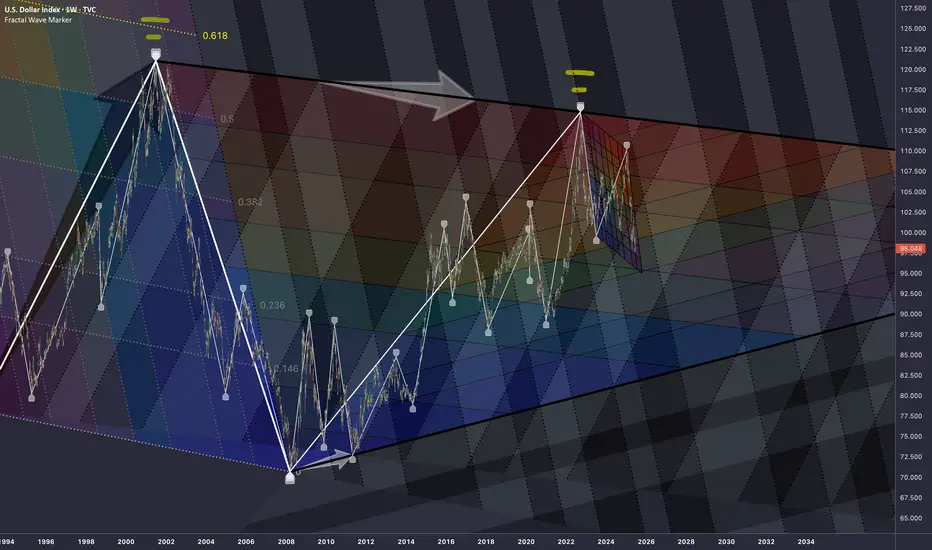
DXY: 2 Cycles InterconnectedDownward tilt defines highs of '01 and '22 at phi
Topologically looks like expanded version of previous cycle. Relating them creates confluence zones.
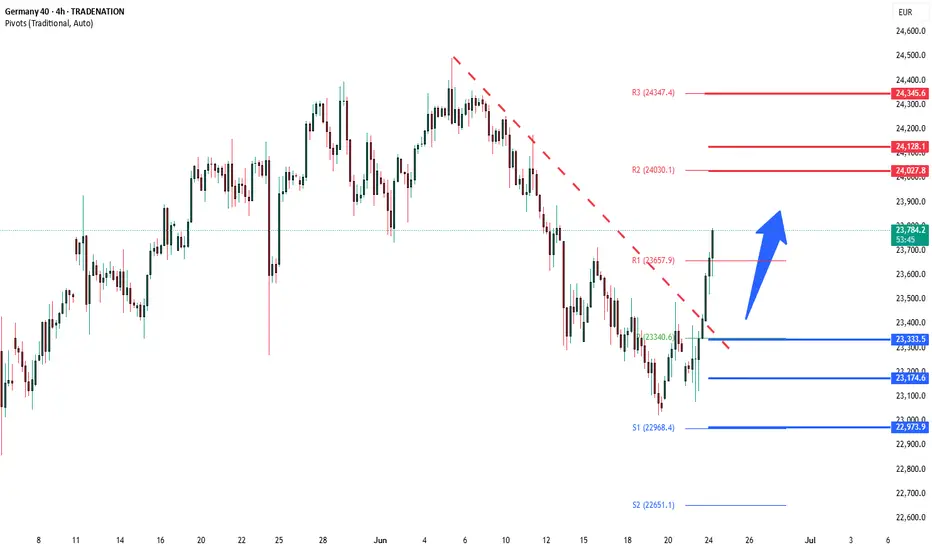
DAX40 INTRADAY Bullish breakout support at 23330Trend Overview:
The DAX index maintains a bullish overall sentiment, supported by a sustained rising trend on the higher timeframes. However, recent intraday price action suggests a corrective pullback and consolidation phase, likely part of a broader continuation pattern.
Key Support and Resistance Levels:
Support:
Initial support: 23,330 – a key previous consolidation area and pivot level
Below that: 23,170, then 22,970 as deeper retracement levels
Resistance:
Near-term upside target: 24,030
Further resistance: 24,130 and 24,345 over the longer term
Scenarios:
Bullish Continuation:
A bounce from 23,330 would confirm this level as valid support
Sustained strength could drive price toward 24,030, then 24,130 and 24,345
Bearish Breakdown:
A daily close below 23,330 would invalidate the bullish setup
Opens potential for deeper pullbacks toward 23,170 and 22,970
Conclusion:
The DAX remains bullish in structure but is currently consolidating. Watch the 23,330 support zone closely—its ability to hold will determine whether bulls regain control or if a deeper correction unfolds. A bounce here would favor upside targets; a confirmed breakdown shifts the outlook to short-term bearish.
This communication is for informational purposes only and should not be viewed as any form of recommendation as to a particular course of action or as investment advice. It is not intended as an offer or solicitation for the purchase or sale of any financial instrument or as an official confirmation of any transaction. Opinions, estimates and assumptions expressed herein are made as of the date of this communication and are subject to change without notice. This communication has been prepared based upon information, including market prices, data and other information, believed to be reliable; however, Trade Nation does not warrant its completeness or accuracy. All market prices and market data contained in or attached to this communication are indicative and subject to change without notice.
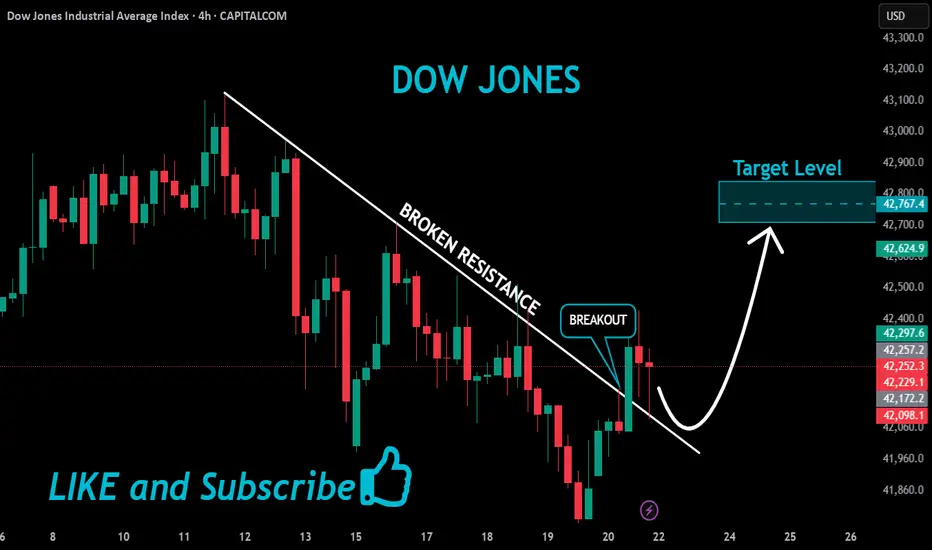
US30 Will Grow!
HI,Traders !
#US30 is trading in an
Uptrend and the Indice
Made a bullish breakout
And a pullback so affter
The retest of the broken
Falling resistance which
Is now a support we will
Be expecting a further
Bullish move up !
Comment and subscribe to help us grow !
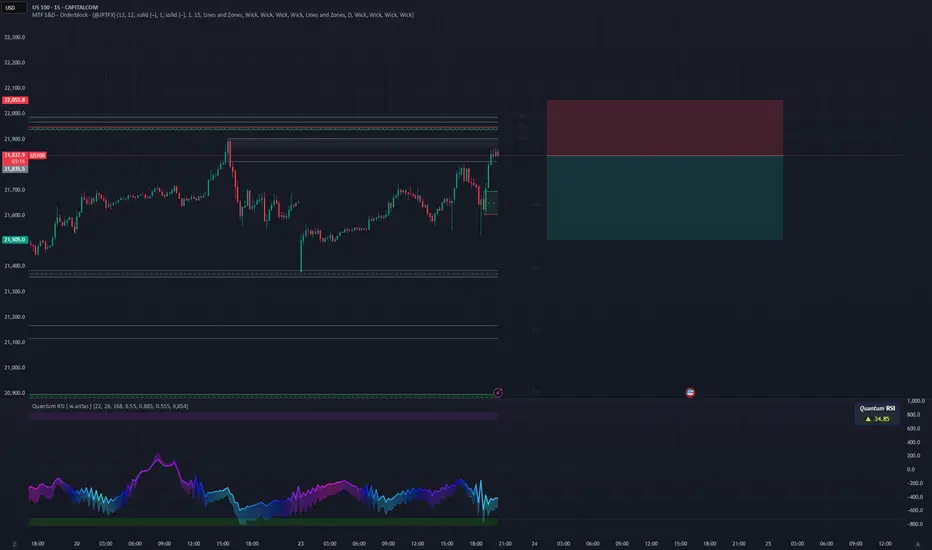
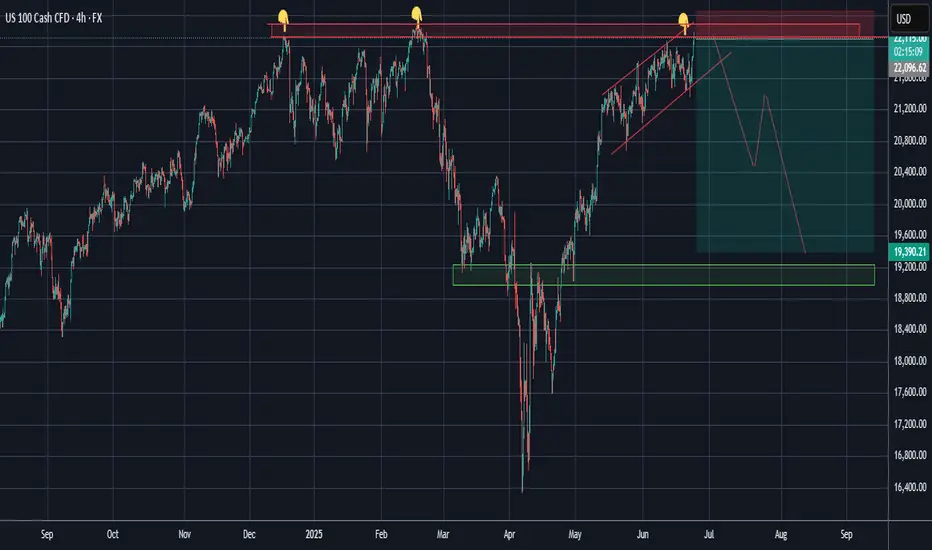
NAS Might Drop Due to Middle East TensionsWild times, eh?
In the midst of a new war in the Middle East, the NASDAQ (like most other indices) is bursting with symbolic strength.
Will it do well? One may doubt it.
Here is a short idea with a conservative target, supported by clearly bearish RSI divergences.
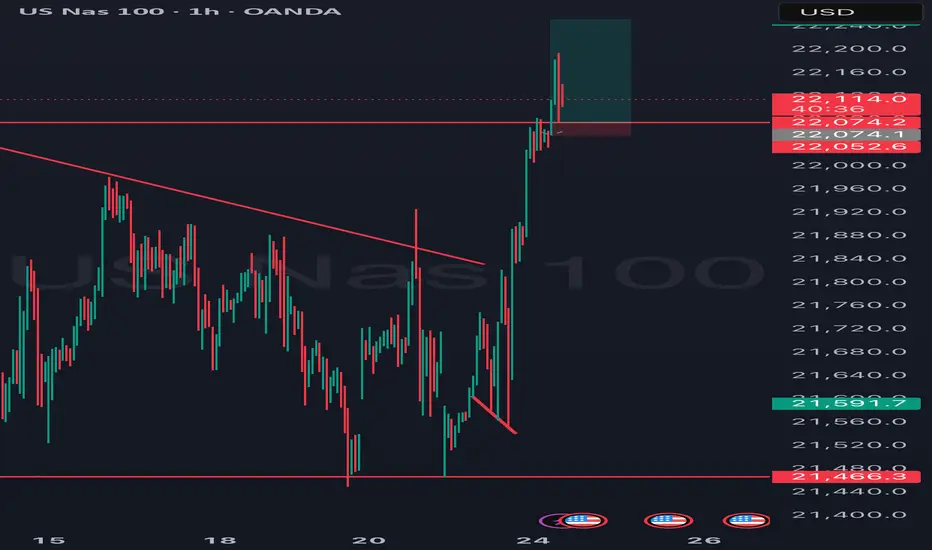
Buy NasAfter breaking the recent H4 resistance we hoping that Nas is reaching for the Daily higher high and probably breaking it.
SPX500As on NASDAQ100 Analysis, seeing a shorting position herein as well, for a fair drop to the recent demand zone and QML levels, sort of skewed Head and Shoulder pattern unfolding due to give the second bearing shoulder.

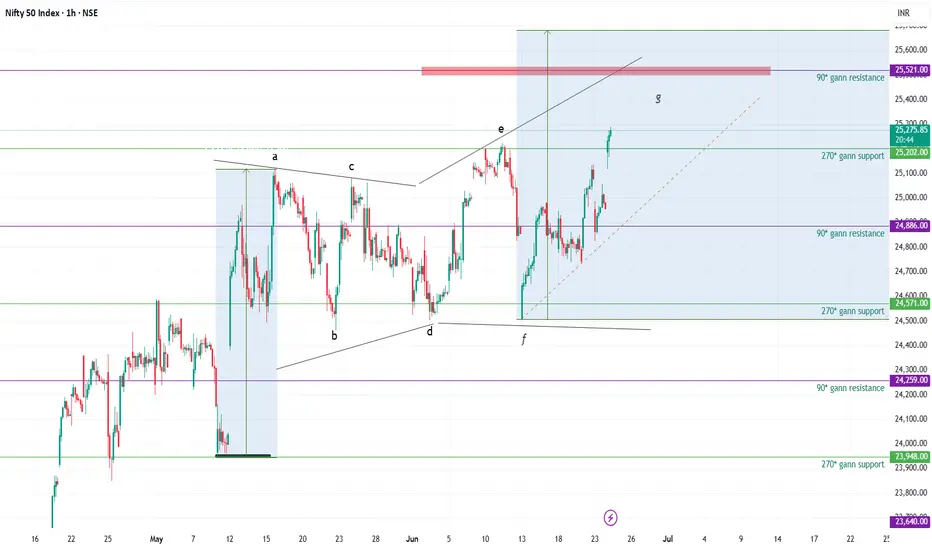
Diametric Pattern - Riding the current G-wave- Riding the G-wave - hoping it to tend to be nearly equal to A-wave
- 90* Gann acting as resistance
- 270* Gann as supports
NAS100I am looking for selling opportunities for NAS100. The market is very volatile, so trade with caution. Currently, it is trading in a seller-friendly zone, which suggests that we may see an influx of sellers. This should represent a 5/6 Fibonacci retracement, with the potential for a further decline over a longer time frame. However, please note that my sell analysis for NAS has not been very accurate in the past. While I’ve been able to collect a few pips, the broader movements have aligned better.
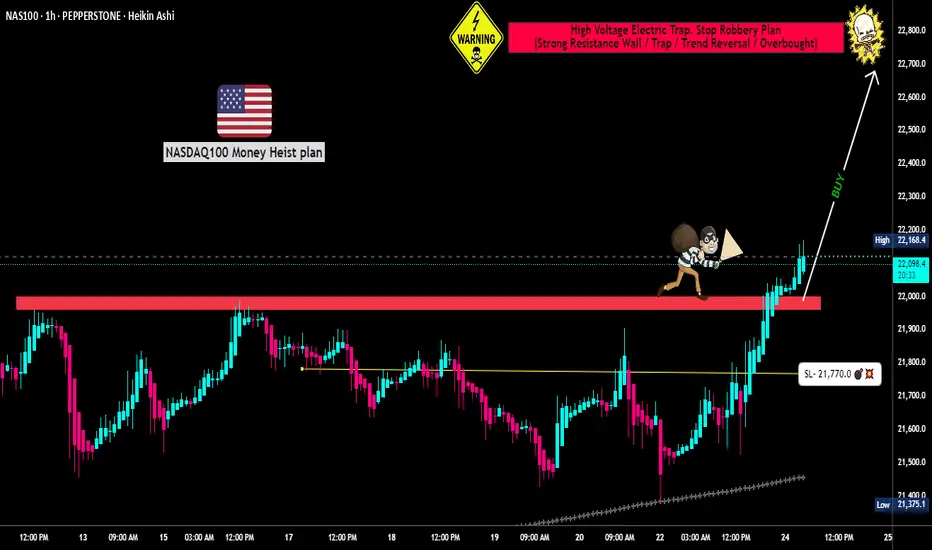
"NASDAQ 100: THE TECH ROBBERY! – Quick Profits Before Reversal?"🔥 "The NDX NASDAQ 100 INDEX Heist: Bullish Loot & Escape Before the Trap!" 🔥
🌟 Hi! Hola! Ola! Bonjour! Hallo! Marhaba! 🌟
Dear Money Makers & Market Robbers, 🤑💰💸✈️
Based on the 🔥Thief Trading Style🔥 (technical + fundamental analysis), here’s our master plan to heist the NDX - NASDAQ 100 INDEX. Follow the strategy on the chart—long entry is the play! Aim to escape near the high-risk RED Zone (overbought, consolidation, potential reversal). The bears are lurking, so take profits and treat yourself—you’ve earned it! 💪🏆🎉
🚀Entry (The Vault is Open!)
"Swipe the bullish loot at any price!"
For precision, place buy limit orders within 15-30min timeframe (recent swing lows/highs).
Set alerts! Don’t miss the heist.
🛑 Stop Loss (Safety Net)
Thief-style SL at nearest swing low (4H timeframe) → 21,770.00 (adjust based on risk/lot size).
🏴☠️ Target 🎯: 22,800.00
Bullish momentum is fueling this heist—ride the wave but exit before the trap!
📰 Fundamental Backing (Why This Heist Works)
Macroeconomic trends, COT data, geopolitics, and sentiment align for bullish moves.
Full analysis? Check 👉🔗🌎
⚠️ Trading Alerts (News & Risk Mgmt)
Avoid new trades during high-impact news (volatility = danger).
Use trailing stops to lock profits and dodge sudden reversals.
💥 Boost This Heist!
Hit 👍 (Boost Button) to strengthen our robbery squad!
More heists = More profits—stay tuned for the next steal! 🚀🤑
See you soon, fellow thieves! 🤝🎉