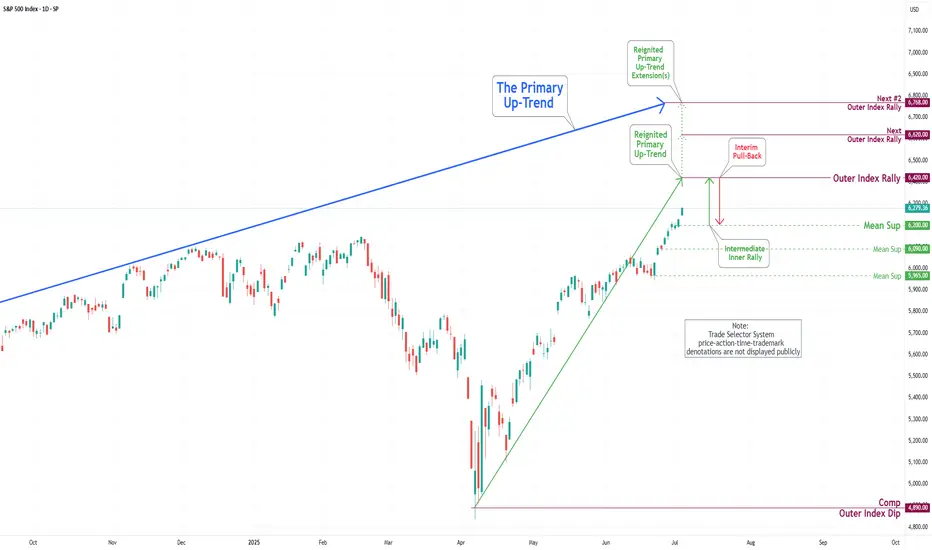
S&P 500 Daily Chart Analysis For Week of July 3, 2025Technical Analysis and Outlook:
During this abbreviated trading week, the S&P 500 Index has primarily shown an upward course, hitting and surpassing our target for the Outer Index Rally of 6235. Currently, the index demonstrates a consistent bullish trend, with the following objective for the Outer Index Rally set at 6420, followed by forthcoming targets of 6620 and 6768. Nevertheless, it is crucial to acknowledge the current price action may cause prices to retrace from their current fluctuation to test the Mean Support at 6200 before resuming their upward movement.
Market indices
$NSE:NIFTY is Going to Burst Up Side ! SkyRocketing TIme is NearNSE:NIFTY is Going to Burst Up Side ! SkyRocketing TIme is Near
NIFTY 50 BULLISH REVIEW (My View) 💥
📈 Current Bias: BULLISH
✅ Nifty 50 showing strong resilience above key support levels.
✅ The index is holding well above recent consolidation zones and looks ready for further upside.
✅ Momentum indicators (like RSI) are staying in positive territory, showing sustained strength.
✅ Higher highs & higher lows structure intact on daily chart — bulls in control!
🔑 Key Levels:
👉 Immediate support: 23,333 - (watch for buying interest here)
👉 Resistance ahead: 23,850 - 23,900 (break above = fresh rally potential)
🌟 What I’m Watching:
🚀 Breakout above 23,900 could open doors towards 24,200+ levels in the coming sessions.
🚀 Strong sector participation from banks, IT, and autos — a broad-based rally is a positive sign.
🚀 Keep an eye on global cues + FII activity — may add fuel to the trend.
NSE:NIFTY is Going to Burst Up Side ! SkyRocketing TIme is Near
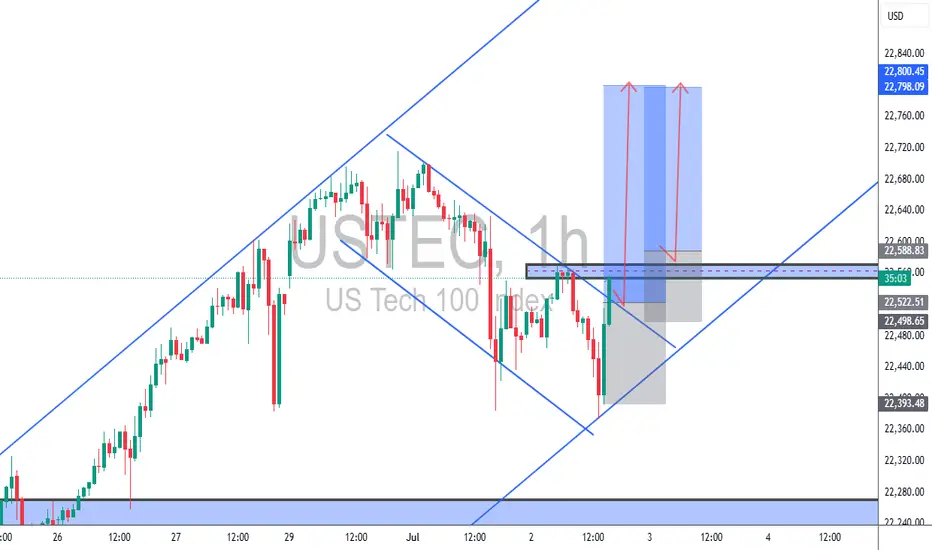
USTEC 15M Trade Setup Analysis (TCB Strategy)📊 USTEC 15M Trade Setup Analysis (TCB Strategy)
Trade Type: Countertrend Breakout -> Continuation
Symbol: USTEC (NASDAQ 100 Index)
Timeframe: 15-Minute
Entry Zone: Around 22,500
Resistance Zone: 22,587.90
Target: 22,865.84
Stop Loss: 22,458.87
Risk–Reward: 1:3 (approx)
Structure: Falling wedge breakout into bullish channel
Setup Confidence Score: 95%
📝 Analyst Notes
Price is breaking out from a well-defined falling wedge within a rising channel. Entry around 22,500 is based on breakout momentum, with SL tucked under structure. A retest entry would offer added confluence. Resistance at 22,587.90 is critical—a break and hold above confirms bullish strength toward the 22,865 target.
🎯 Execution Plan
Option 1: Aggressive entry near 22,500–22,540 (early breakout)
Option 2: Wait for clean retest of wedge breakout or 22,500 zone
Target: 22,865 (upper channel boundary)
SL: 22,458 or below the recent structure low
R:R: ~1:3 — very favorable
🟢 Verdict
This is a high-quality TCB setup, especially if we get a retest confirmation. The bounce off channel support + wedge breakout = excellent confluence.
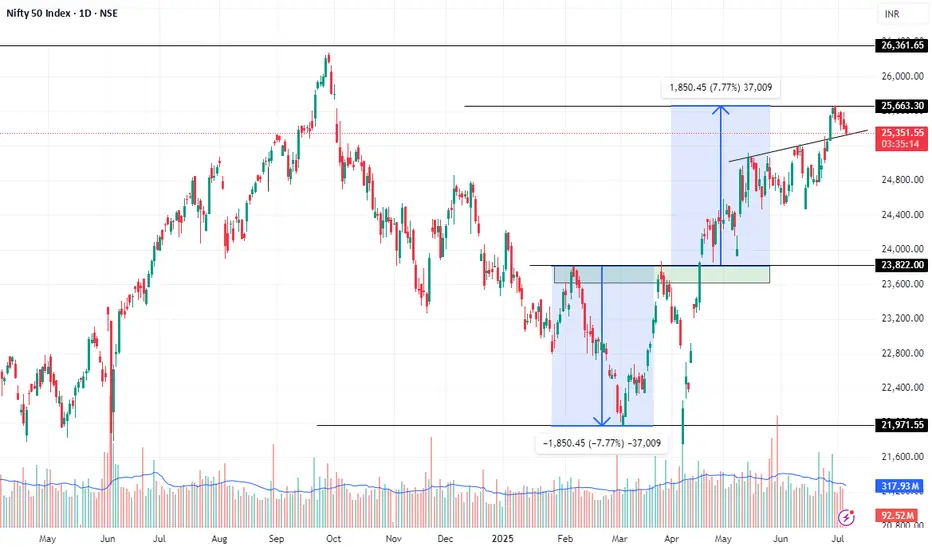
NIFTY 1st TGT is doneNifty initial v - pattern TGT is achieved as shown in chart
base 21971
breakout @ 23822
tgt @ 25663
Whats next ? will be posting shortly with time cycle and price cycle.
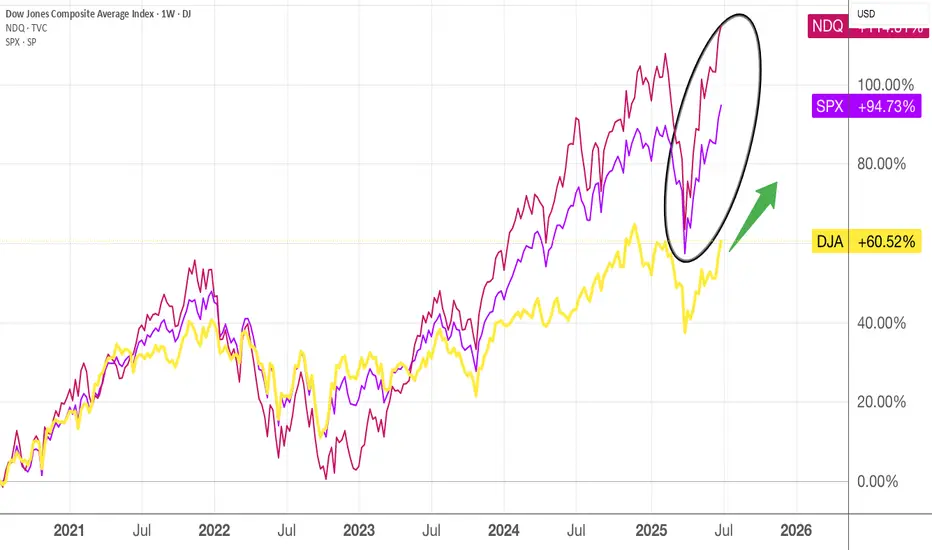
Diversification - spread your eggs into different basketsSo we have seen the DJA basket of stocks rallying of late and I believe this trend will continue , considering they are laggards compared to SPX and NDQ.
When the tech stocks retrace (look at the parabolic rally ), the DJA stocks should be climbing its due rally.
This is how I diversify my risk portfolio, though 80% of the profits are still made in the tech stocks. The healthcare, consumer durables types of stocks are more slow and steady growth, giving some decent dividends as well.
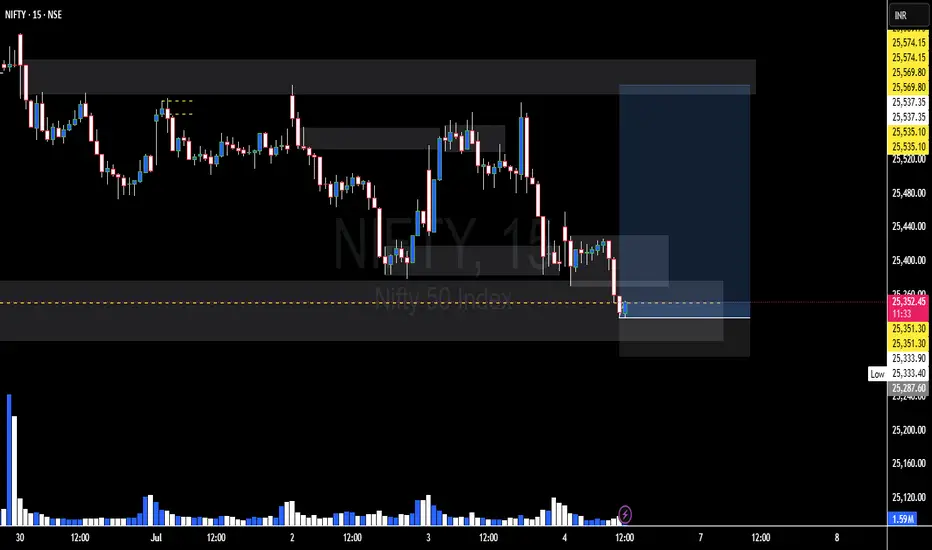
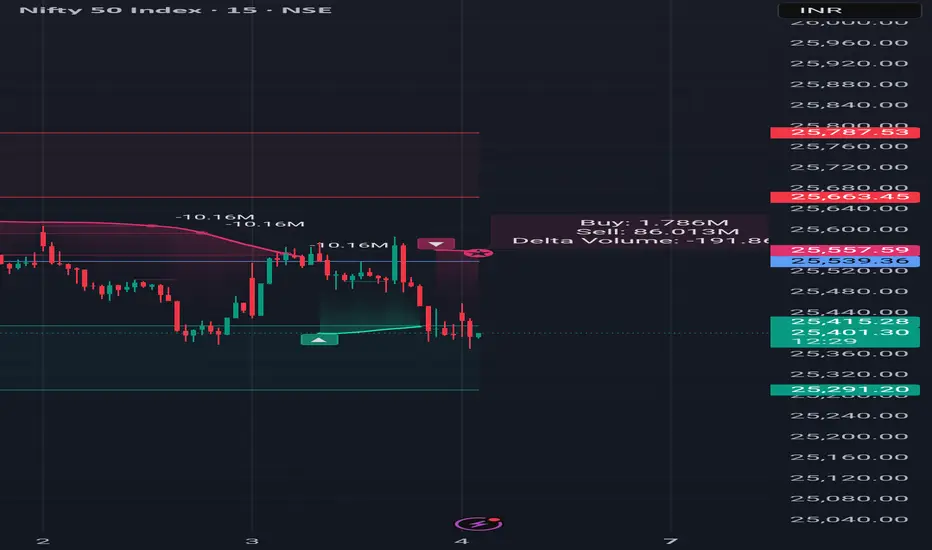
Nifty in Volatile Range#NIFTY FUT– 25,508.0
S1 – 25,395.0
S2 – 25,348.0
R1 – 25,658.0
R2 – 25,718.0
Doji formation has seen post Red
candle with inline volume,
indicates consolidation on daily
chart. Nifty has closed above 7, 14
and 21 DMA that seen at 25487,
25337 and 25222 levels. Nifty
future has resistance at 25658
levels while support seen at 25395
level..
More support and Resistance Show in chart...
All information Education Purpose only
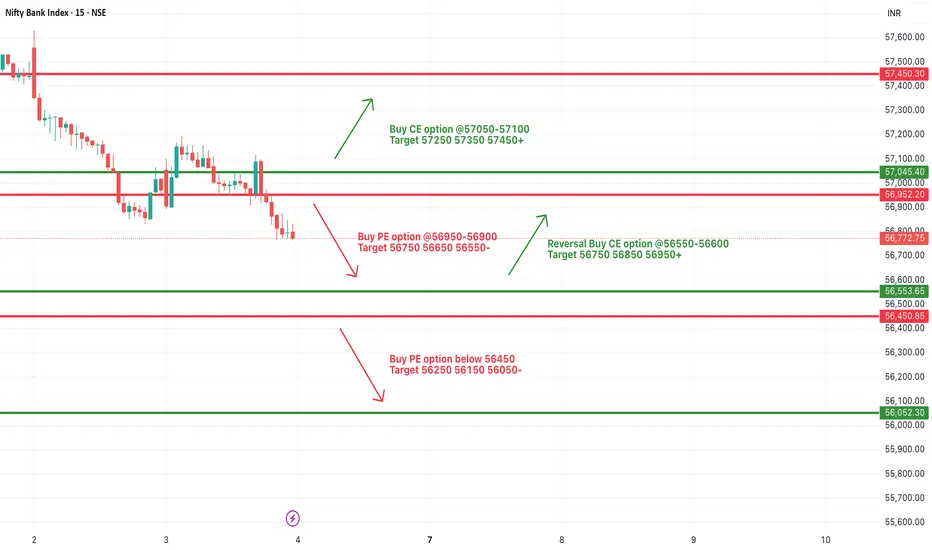
[INTRADAY] #BANKNIFTY PE & CE Levels(04/07/2025)Bank Nifty will open with a gap-up near the 56950 zone, placing it close to an immediate resistance area. If the index sustains above the 57050–57100 level, it indicates bullish strength and could trigger a further upward move toward 57250, 57350, and potentially 57450+. This level acts as a breakout zone for upside momentum. On the other hand, if the price faces resistance around 56950–57000 and starts reversing, a short opportunity opens below 56950–56900, with targets placed at 56750, 56650, and 56550.
In case Bank Nifty falls further and breaches the 56450 mark, it may signal a strong breakdown and continuation of the downtrend, leading to lower targets around 56250, 56150, and 56050. However, if the index takes support at the 56650–56600 zone and shows signs of reversal, it can provide a buying opportunity for a bounce back toward 56750, 56850, and 56950.
Overall, the day’s strategy should be reactive to these key levels, with trades initiated only upon proper price action confirmation. Use trailing stop-loss to protect profits and exit partially at key target levels.
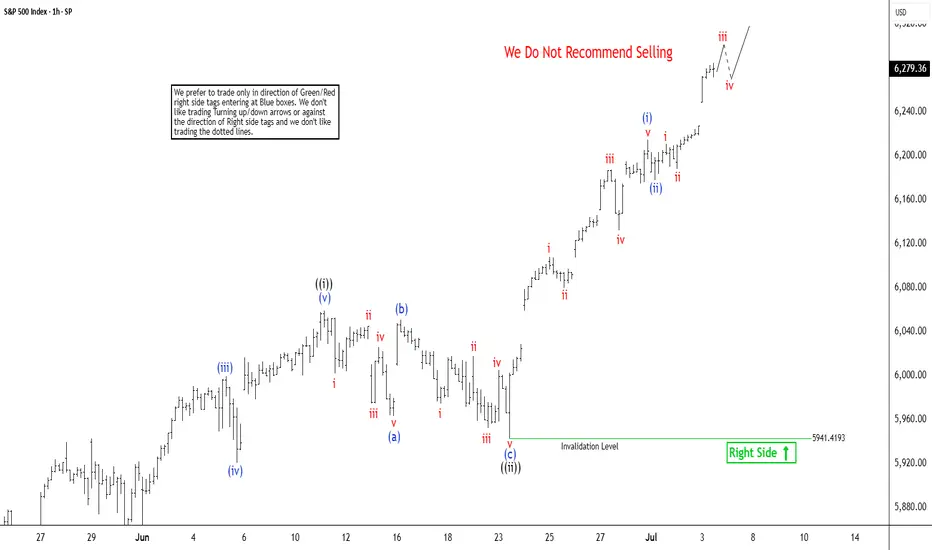
S&P 500 ($SPX) Nests Upward in Strong RallySince bottoming out on April 7, 2025, following the tariff war selloff, the S&P 500 (SPX) has sustained a robust rally. The Index is reaching new all-time highs in a clear Elliott Wave impulsive structure. Technical analysis, particularly momentum indicators like the Relative Strength Index (RSI), shows no divergence at the latest peak. This indicates sustained bullish momentum and suggests the rally remains within the third wave of the Elliott Wave sequence. From the April 7 low, wave 1 concluded at 5968.6. A corrective wave 2 followed which ended at 5767.41. The index has since nested higher within wave 3, demonstrating strong upward momentum.
Breaking down the substructure of wave 3, the hourly chart below reveals that wave ((i)) peaked at 6059.4. The subsequent pullback in wave ((ii)) unfolded as a zigzag pattern. Wave (a) declined to 5963.21, and wave (b) rebounded to 6050.83. Wave (c) concluded at 5941.4, completing wave ((ii)) in the higher degree. The index has since resumed its ascent in wave ((iii)). Up from wave ((ii)), wave (i) reached 215.08 and a minor pullback in wave (ii) ended at 6177.97.
The SPX is expected to continue its upward trajectory, with potential pullbacks finding support in a 3, 7, or 11 swing against the 5941.4 level, setting the stage for further gains. This analysis underscores the index’s bullish outlook, supported by technical indicators and Elliott Wave structure, as it navigates higher within this impulsive cycle.
Dow Jones (DJI) Logarithmic Macro Outlook Log target: 48k
The dotted red line is adjusted for inflation. The stock market cycles are lengthening. Continued downside till EOM followed by a final melt-up rally that will bring the end of grand wave 5.
ETA: Q1 '23.

Nonfarm Payroll and some other news 03.07.2025Nonfarm Payrolls surprisingly turned out to be moderate. These are excellent arguments for the Fed not to touch the rate, since labor market is their main mandate along with inflation.
At the same time, stock market is showing steady growth and overheating in some places.
What should the US economy be saved from by lowering the Fed rate?
From Trump's future decisions, or create an influx of liquidity for a good picture so that Trump can further report on GDP growth?
These questions should be asked by engaged Fed chairman.
At 5:00 PM, an interesting ISM services report was released: the growth of new orders against background of falling employment immediately makes us wonder why then such a level of applications to Nonfarm.
The answer is simple, Elon Musk fired a lot of employees during his short career in the White House.
Dow Jones - Volatility is HighLevels mentioned here are based on the market volatility and it is purely for the study purpose only.

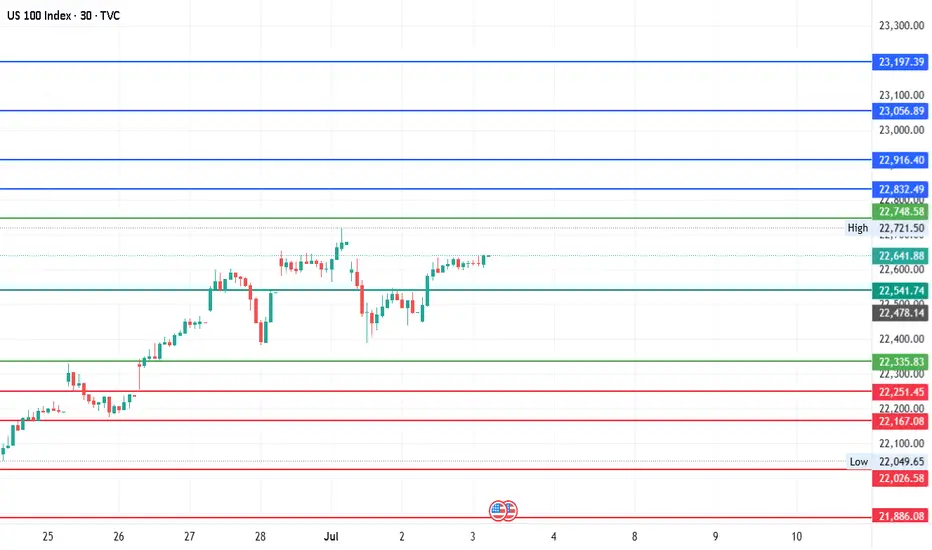
#NDQ - Weekly Targets 23197.39 or 21886.08 ?Date: 03-07-2025
#NDQ - Current Price: 22641.89
Pivot Point: 22541.74 Support: 22335.83 Resistance: 22748.58
#NDQ Upside Targets:
Target 1: 22832.49
Target 2: 22916.40
Target 3: 23056.89
Target 4: 23197.39
#NDQ Downside Targets:
Target 1: 22251.45
Target 2: 22167.08
Target 3: 22026.58
Target 4: 21886.08
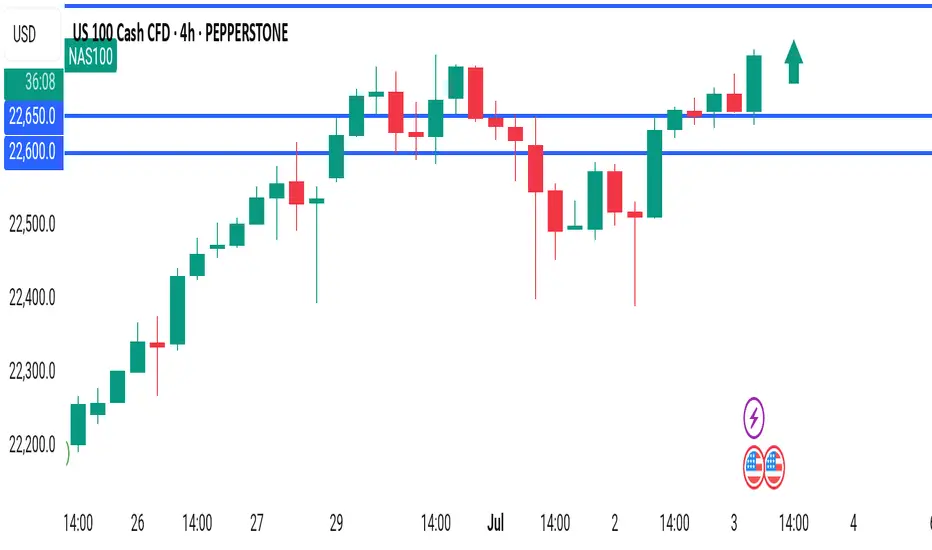
NAS100 4H – Bullish Breakout Continuation BUY SetupUS100 (NAS100) is showing clear bullish strength after reclaiming 22,500.0, now trading around 22,718.0. The structure remains bullish, with higher highs and higher lows forming cleanly.
Buyers are still in control — looking for continuation to the upside.
---
BUY Trade Plan:
🔵 Buy Limit: 22,650.0 – 22,680.0
🛑 Stop Loss: 22,600.0
🎯 Take Profit 1: 22,800.0
🎯 Take Profit 2: 22,950.0
---
Why Buy?
✅ Strong bullish market structure.
✅ Recent pullback held above previous support levels.
✅ Momentum favoring upside continuation after minor retracement.
Smart Money likely to drive price higher after liquidity grab around 22,650 zone.
---
Summary:
Bias: BUY ONLY 🔥
Setup: Wait for price to pull back into 22,650 – 22,680, enter long on confirmation.
Risk Management: Respect SL and TP levels — no emotions.
---
💬 Are you buying NAS100 too? Drop your thoughts below!
#NAS100 #US100 #Indices #TradingView #SmartMoney #BuySetup #FrankFx14
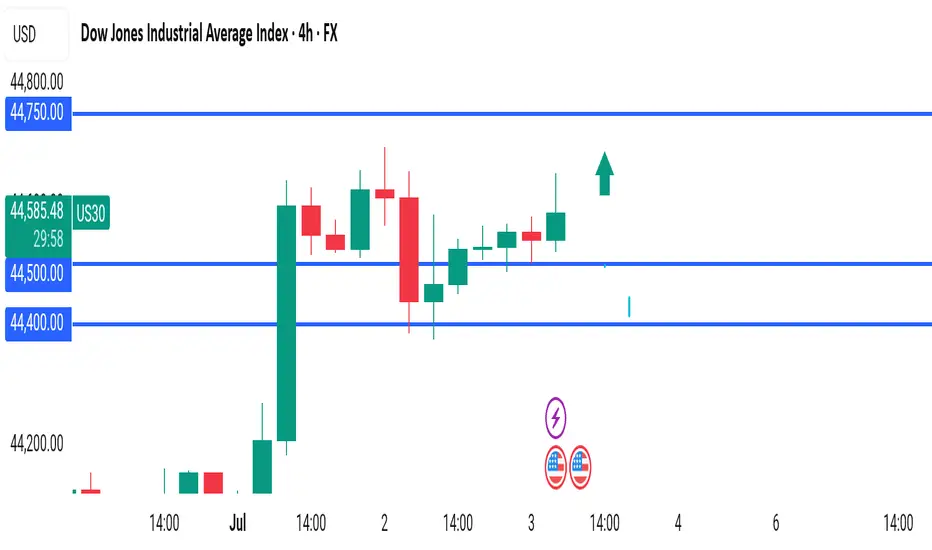
US30 (DOW JONES) 4H – Bullish Breakout BUY Setup
US30 (Dow Jones Industrial Average) is pushing higher, breaking through previous resistance levels. Price is now trading at 44,586.48, confirming strong bullish momentum after reclaiming the 44,000 psychological zone.
We remain bullish — looking for continuation of this breakout.
---
BUY Trade Setup:
🔵 Buy Limit: 44,500.00 – 44,520.00
🛑 Stop Loss: 44,400.00
🎯 Take Profit 1: 44,750.00
🎯 Take Profit 2: 45,000.00
---
Why Buy?
✅ Clear bullish market structure.
✅ Price consolidating after breakout — healthy sign for continuation.
✅ Smart Money likely accumulating for next leg up.
We ride with momentum — no reason to fight the trend.
---
Summary:
Bias: BUY ONLY 🔥
Setup: Wait for price to retest 44,500 – 44,520 zone, look for rejection, then enter.
Risk Management: Respect SL — trade with discipline.
---
💬 Are you buying US30 too? Let me know your setup below!
#US30 #DowJones #Indices #TradingView #BuySetup #SmartMoney #FrankFx14
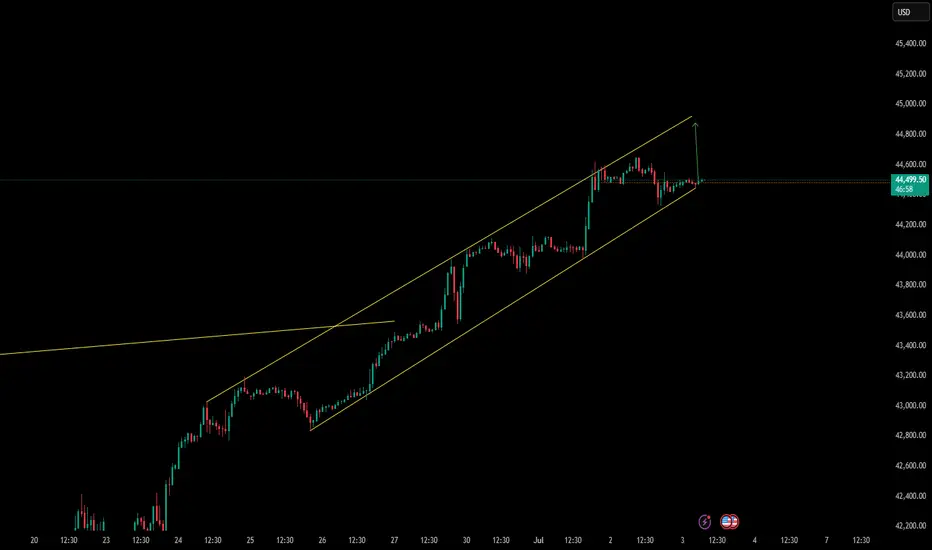
Dow’s fighting hard for that breakoutDow Jones is moving within a bullish channel
with low selling pressure —
strong legs pushing toward the top.
I’m expecting another solid bullish leg.
BLACKBULL:US30
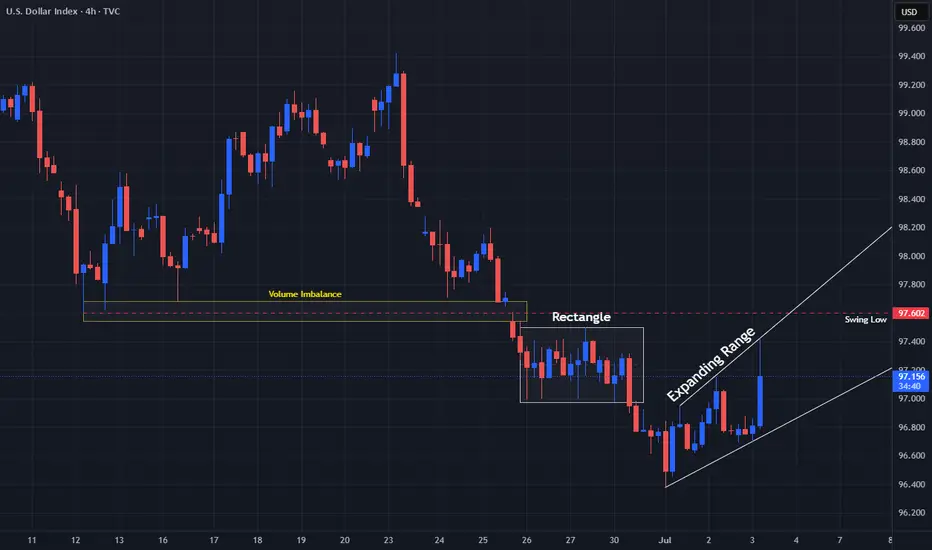
DXY Quite IndecisivePrice on TVC:DXY after having broken below the Swing Low on June 12th @ 97.602 has created a lot of Indecision!
Starting with a 5 Day Long Consolidation period as a Rectangle Pattern
Then after the Bearish Breakout on June 30th due to the Federal Reserve mentioning possibly leaning towards Interest Rate Cuts, we see the TVC:DXY form a Expanding Range
Now at the Swing Low and above all the Consolidation or Indecision, we see a Volume Imbalance in the 97.5 - 97.6 area.
Fundamentally, USD has been mostly beating expectations with:
- Manufacturing and Services PMI's showing Expansion
- Job Openings higher then expected
- Unemployment Claims Low
- Unemployment Rate dropping ( 4.1% )
- Factory Orders Rising
Non-Farm Employment however hurt USD with -33K instead of the 99K forecasted
With all the Tariff uncertainties and how they will affect Inflation continues to worry markets with only a few deals having been ironed out, like the 20% Tariff on Vietnam ( down from 46% ) before the July 9th Deadline.
tradingview.sweetlogin.com
Now with good Employment News out with numbers showing Strong Job Reports, this eases labor fears and could help remove some of the expectations of the amount of Interest Rate cuts this year.
tradingview.sweetlogin.com
tradingview.sweetlogin.com
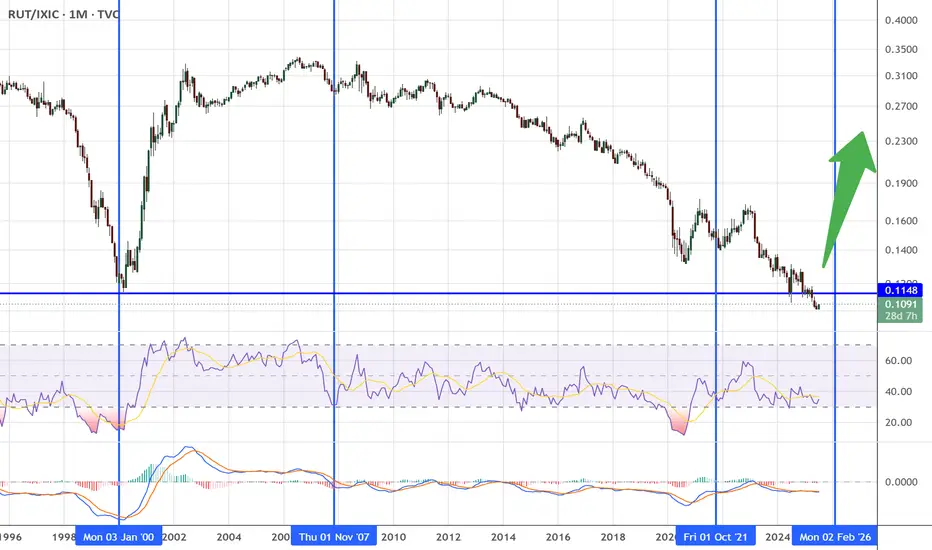
Russell 2000 will start outperforming NasdaqIMO the reversal is here for technology companies. Smaller companies will start outperforming Mega Caps. This will be because investors are looking for higher returns by taking more risk.
Smaller companies have a higher potential stock price appreciation but are more risky.
In 2000, this RUT/NASDAQ ratio reversal marked the top in the Nasdaq. I think we are close but might still have room to grow.
Oct-Nov 2025 Top?
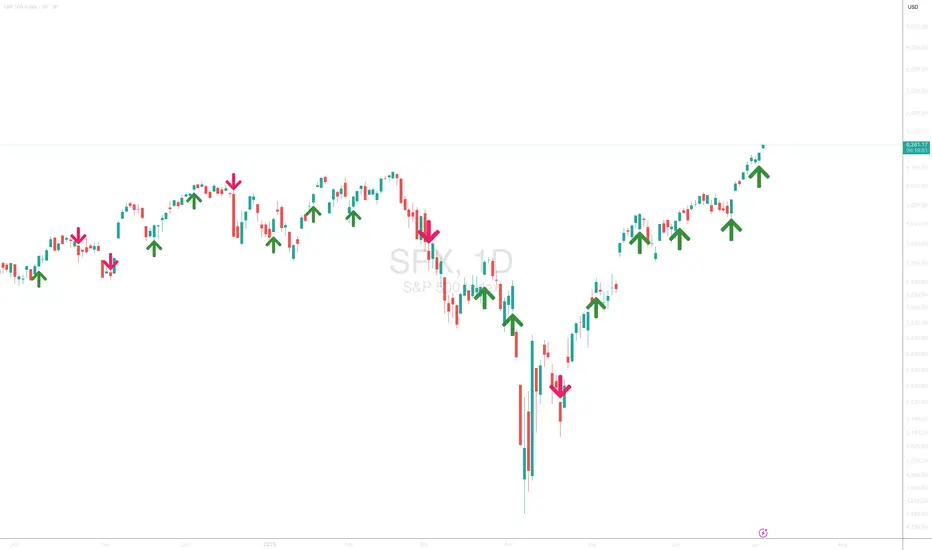
Acorn's Smart Money S&P SignalJuly 2, 2025 - S&P broke to the upside confirming a bullish S&P signal. If correct, the bullish S&P indicator suggests the S&P will close above 6177.97 on July 17. Let’s see if the market can continue to the upside!
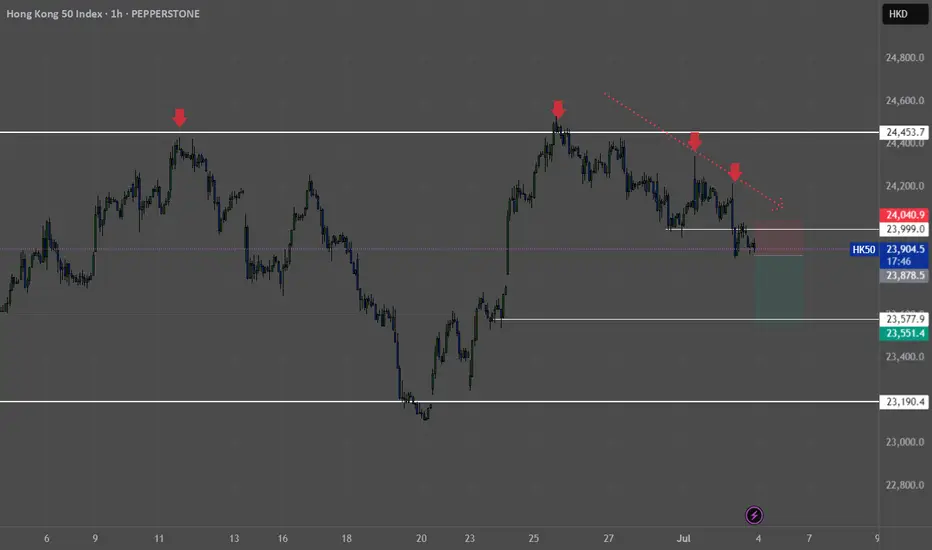
HK50 - H1 - ShortDirection - downwards rejection off 25000 level on the daily, and price moving back into the range.
Level - Price broken support and retested the 24000 level.
Price action - Multiple pin bar rejections off the daily level and hour levels.
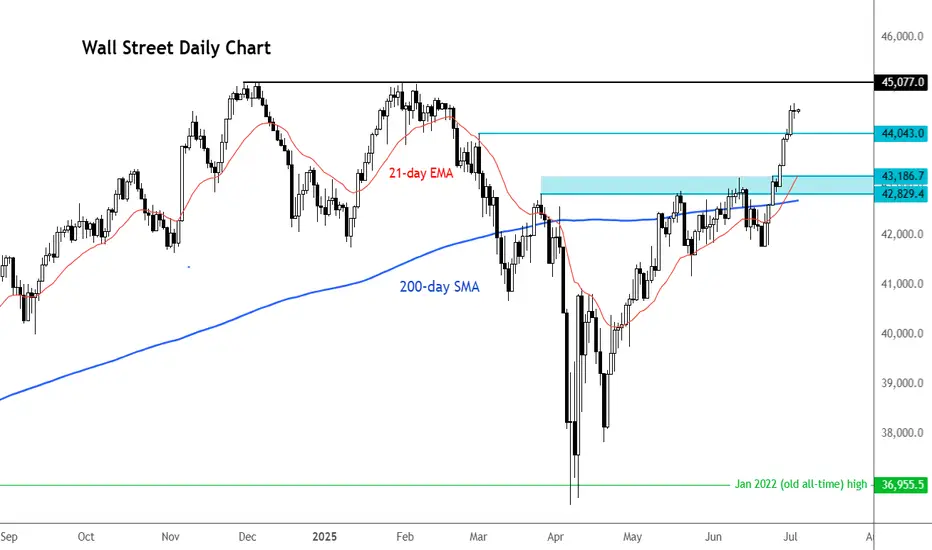
Can Dow hit new highs?While the likes of the S&P 500 and Nasdaq 100 are already record highs, the Dow has not achieved that target yet. It continues to make higher highs and higher lows, and the momentum seems to be getting stronger. Soon, it may even flirt with fresh all-time highs, as investors ride the tailwinds of a robust rally that kicked off in early April. There have been a few catalysts behind this rally. First, it was Trump hitting pause on reciprocal tariffs; then, a wave of optimism washed over markets following a sudden de-escalation in the Middle East. The bulls took charge, and markets haven’t looked back since. But with 4 July celebrations on the doorstep and Wall Street due to close at 1pm NY time, today’s shortened session has a singular focus: the all-important US non-farm payrolls report. Will we have enough time to see the Dow march to new highs? The key levels are marked on the chart.
By Fawad Razaqzada, market analyst with FOREX.com
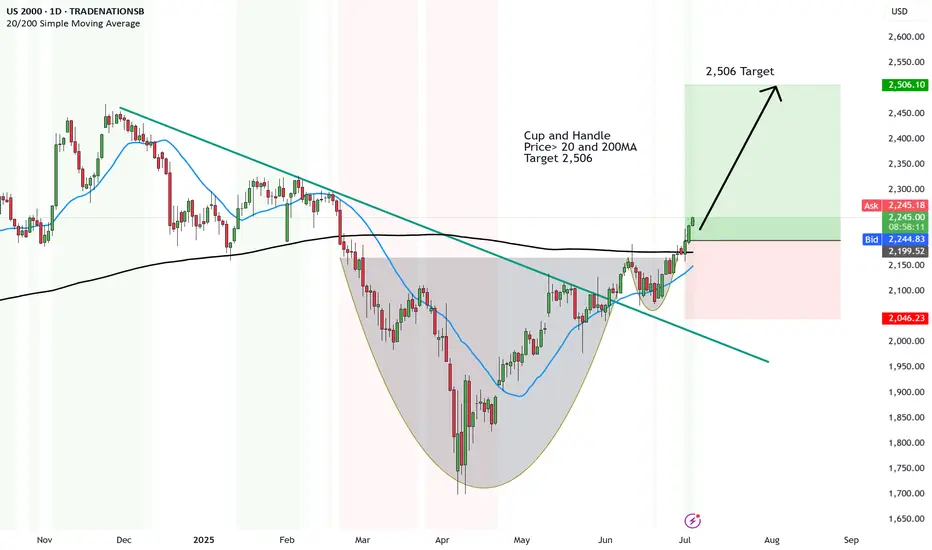
Go Russel - Strong upside for the small fry to 2,506First analysis ever done on the Russell 2000.
And the reason is because there is MAJOR upside to come for the first time in a LONG time.
So why now?
🧨 1. Rate Cuts = Small-Cap Lifeline
Small-cap stocks love lower interest rates — and the Fed's softening tone is a green light for upside.
💥 2. Breakout Setup After Long Chop
The US2000 has been stuck in a sideways range — now it's building energy for a potential breakout.
🏦 3. Regional Banks Bouncing
Regional financials (big weight in US2000) are showing signs of life — that’s a major boost to the index.
🧠 4. Under the Radar = Big Move Potential
While everyone’s chasing Nasdaq and S&P, smart money is quietly positioning in small caps before the crowd catches on.
📊 5. Economic Resilience Helps the Little Guys
US economy staying stronger than expected = tailwind for smaller domestic-focused businesses in the Russell 2000.
Cup and Handle
Price> 20 and 200MA
Target 2,506
Disclosure: I am part of Trade Nation's Influencer program and receive a monthly fee for using their TradingView charts in my analysis.