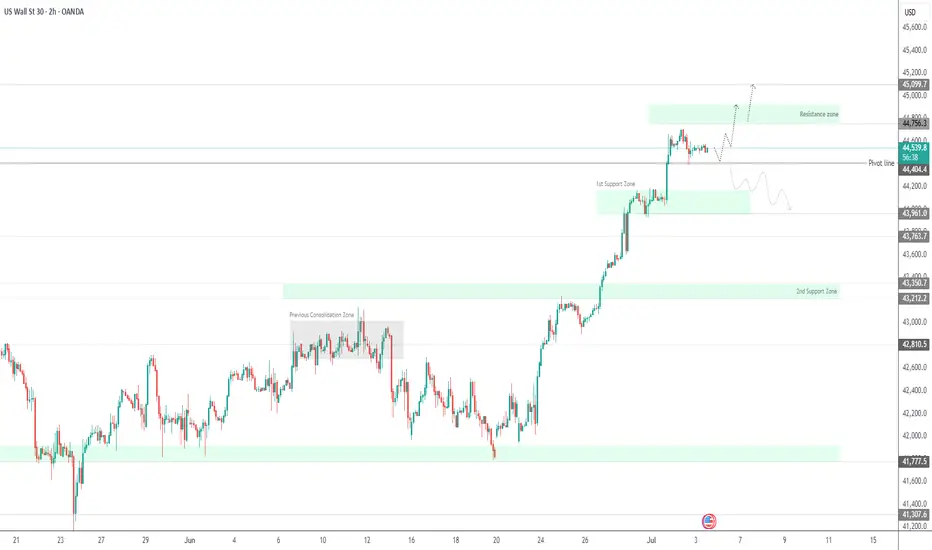
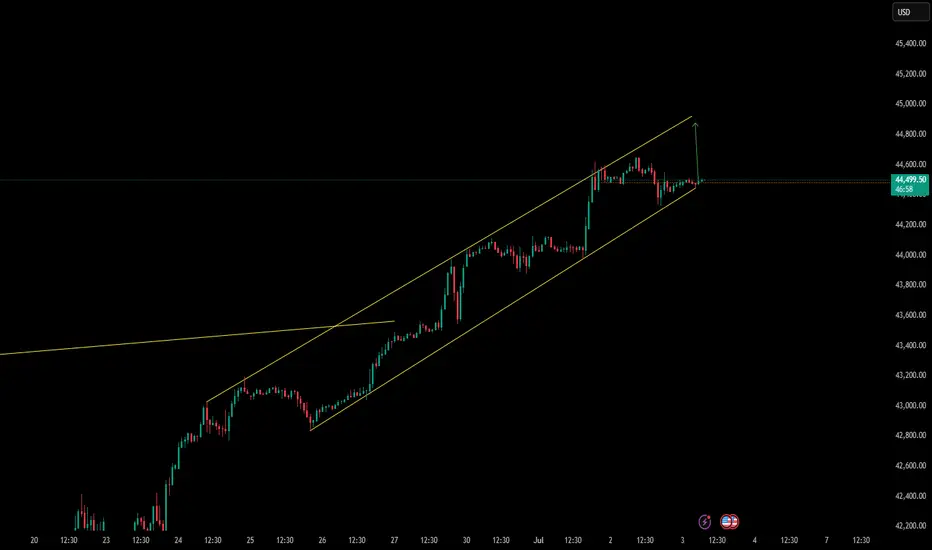
US30 (DOW JONES) 4H – Bullish Breakout BUY Setup
US30 (Dow Jones Industrial Average) is pushing higher, breaking through previous resistance levels. Price is now trading at 44,586.48, confirming strong bullish momentum after reclaiming the 44,000 psychological zone.
We remain bullish — looking for continuation of this breakout.
---
BUY Trade Setup:
🔵 Buy Limit: 44,500.00 – 44,520.00
🛑 Stop Loss: 44,400.00
🎯 Take Profit 1: 44,750.00
🎯 Take Profit 2: 45,000.00
---
Why Buy?
✅ Clear bullish market structure.
✅ Price consolidating after breakout — healthy sign for continuation.
✅ Smart Money likely accumulating for next leg up.
We ride with momentum — no reason to fight the trend.
---
Summary:
Bias: BUY ONLY 🔥
Setup: Wait for price to retest 44,500 – 44,520 zone, look for rejection, then enter.
Risk Management: Respect SL — trade with discipline.
---
💬 Are you buying US30 too? Let me know your setup below!
#US30 #DowJones #Indices #TradingView #BuySetup #SmartMoney #FrankFx14
Market indices
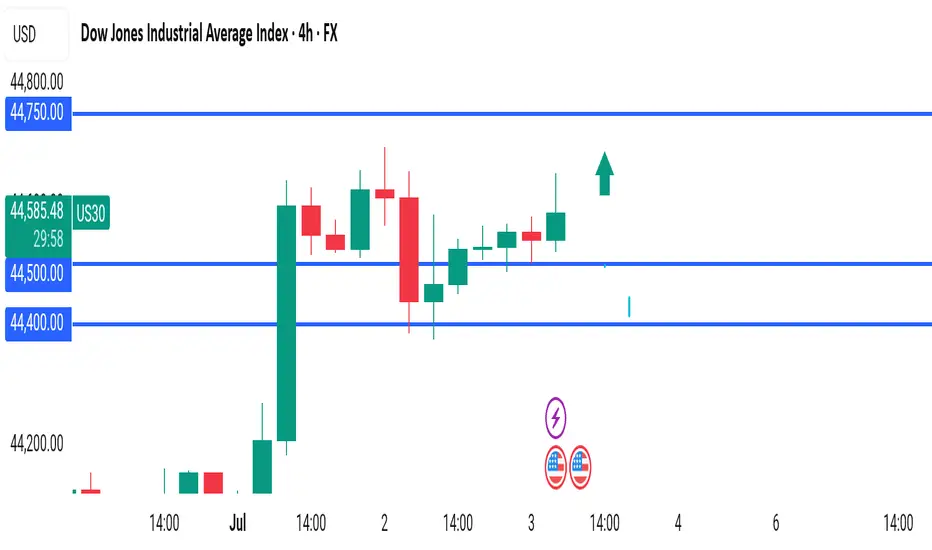
US30 Awaits NFP – Bullish Above 44,410, Volatility Expected US30 (Dow Jones) – NFP Volatility in Focus
Today’s session is expected to be volatile due to the upcoming NFP report. Based on current forecasts, the outlook remains broadly positive for U.S. indices, though intraday swings are likely.
Technical Outlook:
As long as the price holds above 44,410, the bullish momentum remains intact, with potential upside targets at 44,750 and 44,910
A pullback toward 44,410 remains possible before any continuation higher.
However, a confirmed 4H close below 44,400 would shift the short-term structure to bearish, opening the door toward the 1st support zone around 44,180.
Key Levels:
• Resistance: 44,750 / 44,910 / 45,090
• Support: 44,410 / 44,180 / 43,970
Stay cautious — volatility is expected to spike around the release of the jobs data.
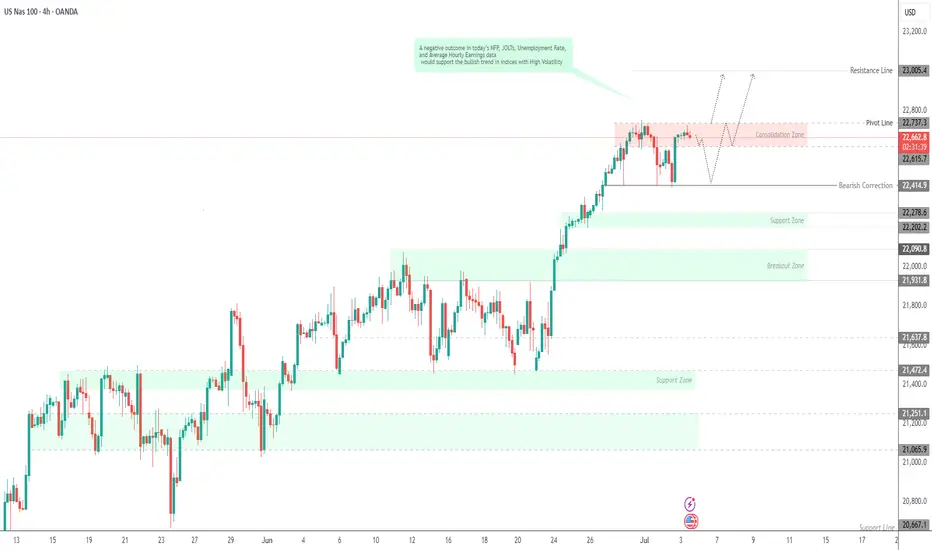
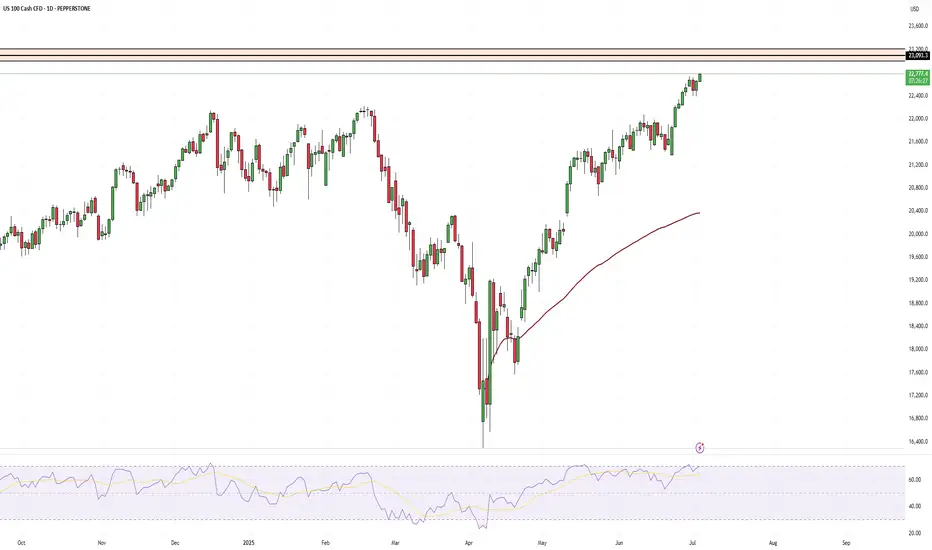
USNAS10 Faces Key Test at 22,615 Ahead of NFP VolatilityUSNAS100 – Key Levels Ahead of Major News
Today’s economic data releases (NFP, Unemployment Rate, etc.) are expected to drive volatility in the market. Traders should watch key levels closely.
Technical Outlook (USNAS10):
• Price is attempting to test 22,615.
• If it holds above 22,615, the bullish momentum is likely to continue.
• However, if price stabilizes below 22,615 on the 1H chart, further downside toward 22,420 is expected before a potential bullish reversal begins.
A breakout above 22,740 could trigger further upside toward 23,000
Key Levels:
• Resistance: 23,000 / 23,100
• Support: 22,420 / 22,280
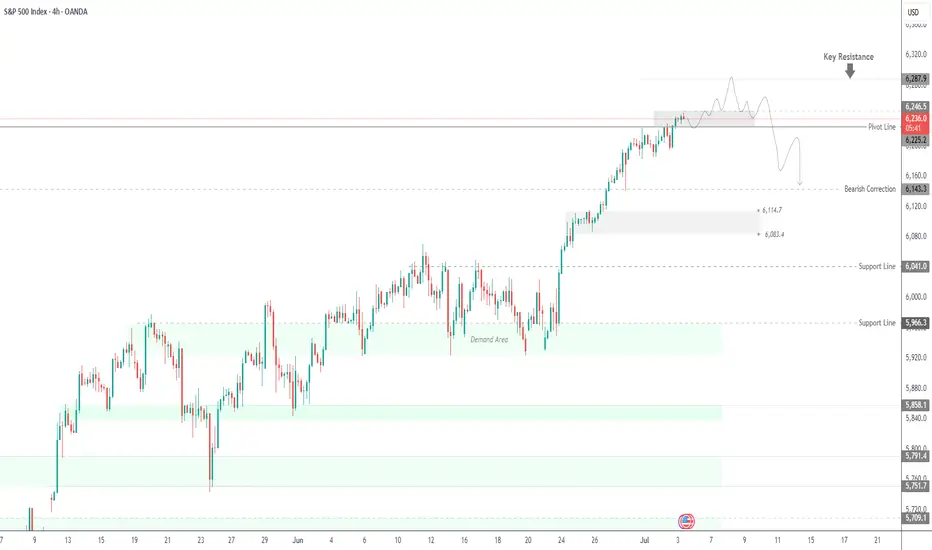
SPX500 at New ATH – Will NFP Fuel the Next Leg Up? SPX500 Outlook: Trade Optimism Fades as Focus Shifts to U.S. Jobs Data
Caution prevails ahead of today’s high-impact U.S. Nonfarm Payrolls report, which could be pivotal for the July rate cut narrative. A weaker print may support risk assets and push SPX500 higher, while a strong report could dampen momentum.
Technical Analysis (SPX500):
SPX500 has printed a new all-time high and is now targeting 6287, especially if the index closes above 6246 on the 1H chart.
As long as price holds above 6225 (pivot), the bias remains bullish, with potential upside targets: 6287 & 6325
However, a 4H close below 6213 would suggest a correction toward: 6190 & 6143
Key Levels:
• Resistance: 6287 / 6325
• Support: 6190 / 6143
Stay alert — today's NFP report could trigger major moves across indices and FX.
Dow’s fighting hard for that breakoutDow Jones is moving within a bullish channel
with low selling pressure —
strong legs pushing toward the top.
I’m expecting another solid bullish leg.
BLACKBULL:US30
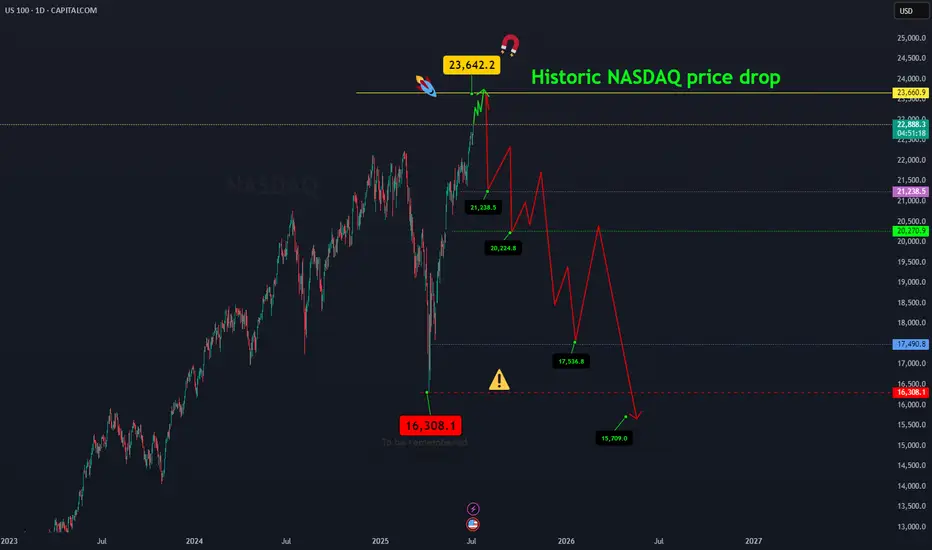
NASDAQ price dropAfter the Nasdaq price reaches around 23642.2, a historic drop will occur and the target is to drop to 16308.
Whatever happens at the highest price, the final destination is towards 16308.
I have identified the price levels in the middle of this expected drop that can cause the price to correct.
IG:NASDAQ
July Doesn't Disappoint - S&P Nasdaq Dow Russell All RunningS&P All Time Highs
Nasdaq All Time Highs
Dow Jones closing in on All-Time Highs (and outperforming both S&P and Nasdaq recently)
Russell 2000 playing catch up and moving higher
This is melt-up at its finest
Since US/China Trade Agreement and Middle East Ceasefire Agreement, markets have used
these two events as further catalysts to continue the upside runs
Stochastic Cycle with 9 candles suggesting a brief pause or pullback in the near-term, but
a 3-5-10% pullback is still an opportunity to position bullish for these markets
I'm only bearish if the markets show that they care with price action. The US Consumer isn't breaking. Corporate Profits aren't breaking. Guidance remains upbeat. Trump is Pro Growth and trolling Powell on the regular to run this economy and market HOT demanding cuts (history says that's a BUBBLE in the making if it's the case)
Like many, I wish I was more aggressive into this June/July run thus far, but I'm doing just fine with steady gains and income trades to move the needle and still having plenty of dry powder
on the sidelines for pullbacks
Markets close @ 1pm ET Thursday / Closed Friday for 4th of July
Enjoy the nice long weekend - back at it next week - thanks for watching!!!

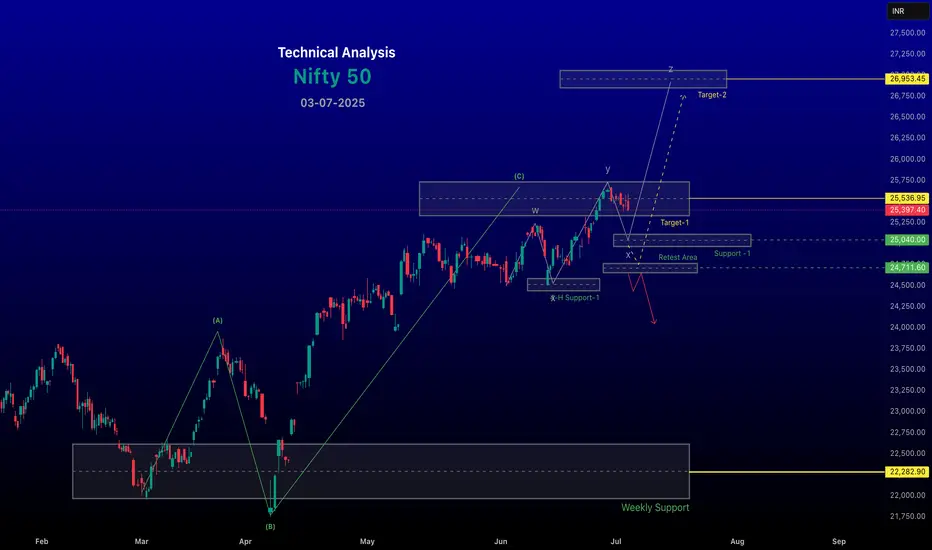
The Nifty 50 index closed at 25,405.30 on July 3, 2025The Nifty 50 index closed at 25,405.30 on July 3, 2025, down 0.19% from the previous day, reflecting a cautious market sentiment amid mixed global cues and domestic profit-booking. Here's a detailed Chart analysis based on available data
Disclaimer --
This analysis is based on recent technical data and market sentiment from web sources. It is for informational purposes only and not financial advice. Trading involves high risks, and past performance does not guarantee future results. Always conduct your own research or consult a SEBI-registered advisor before trading.
#Boost and comment will be highly appreciated
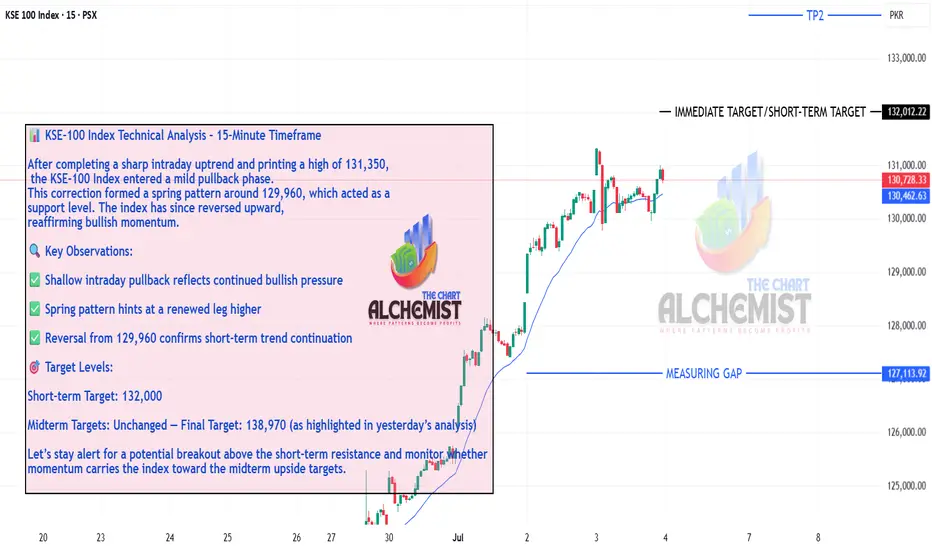
KSE-100 ANALYSIS 03-07-2025KSE 100 Index Technical Analysis (15-minute timeframe)
After completing a short-term uptrend and achieving a high of 131,350, the KSE 100 index went into an intraday pullback, forming a spring pattern (marked on the chart). The pullback ended at 129,960, and the index reversed upwards.
Key Observations:
- Shallow intraday pullback, indicating strong underlying momentum
- Spring pattern formation, suggesting potential for upward continuation
- Reversal from the pullback level, confirming the short-term uptrend
Targets:
- Short-term Target: 132,000
- Midterm Targets: Remain unchanged, with the final target at 138,970 (as highlighted in yesterday's update)
Let's monitor the KSE 100 index's performance and see if it achieves the targets.
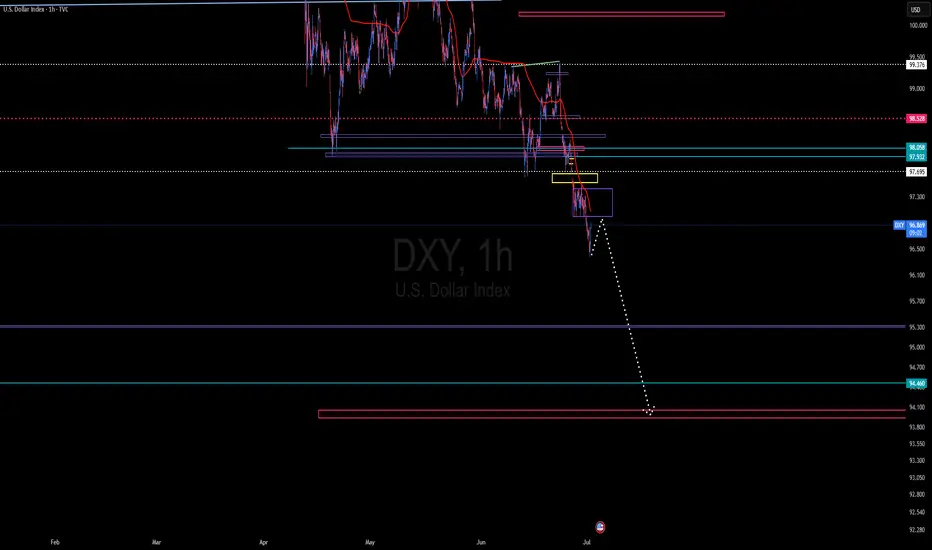
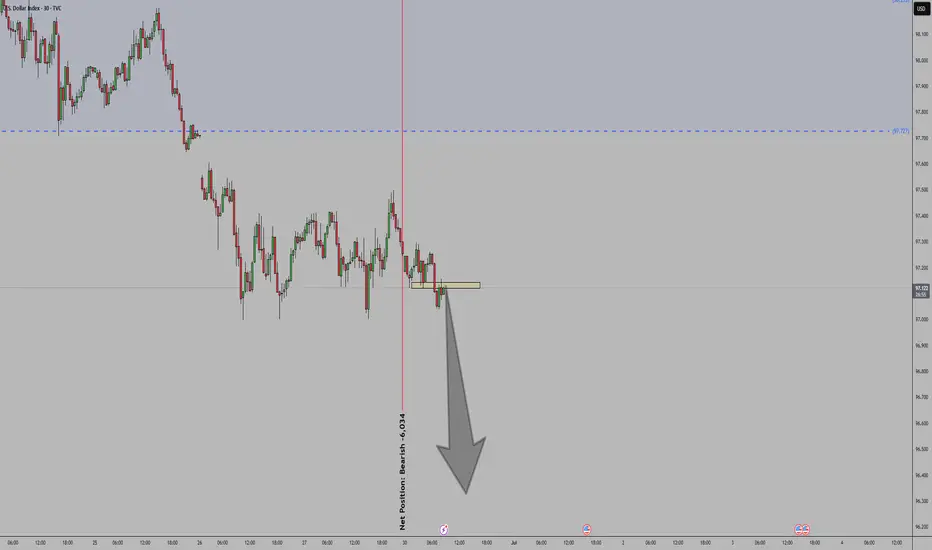
The bearish momentum is evident on the 1-hour, 4-hour, and dailyThe DXY is likely to continue its bearish trend until it reaches the 94.46 level—and it may even break below that
🇺🇸 Today's U.S. Data: Tariffs Starting to Bite?U.S. Data Journal – July 3, 2025
Today's U.S. economic releases showed a stronger-than-expected labor market, with Non-Farm Payrolls (NFP) surprising to the upside, alongside increases in factory orders and a solid ISM Services PMI print.
The combination of these indicators points to persistent demand strength across both goods and services. Moreover, the upward trend in factory orders and service sector activity suggests that tariffs are beginning to feed into cost structures, adding inflationary pressure from the supply side.
While the labor market remains resilient, the risk is that sticky input costs—partly tariff-driven—may complicate the disinflation narrative and potentially delay any dovish policy shift from the Fed.
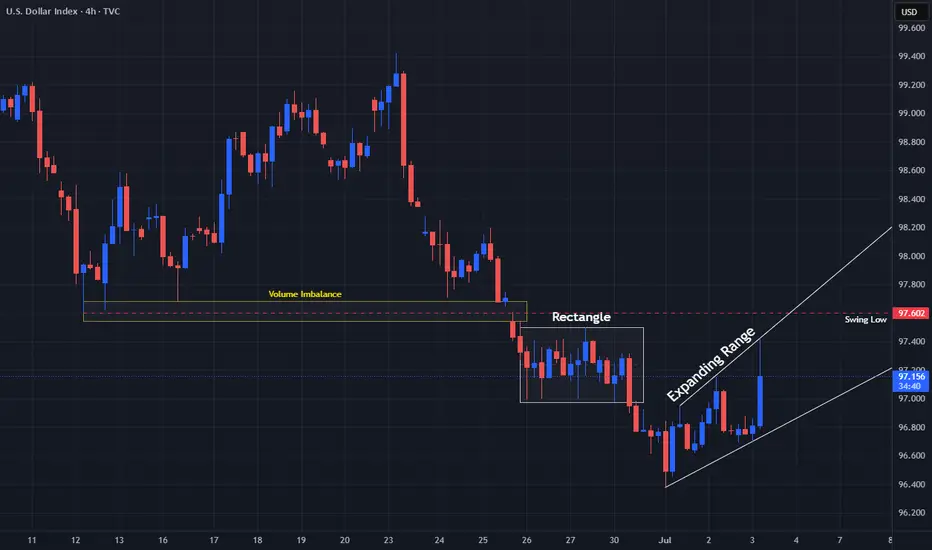
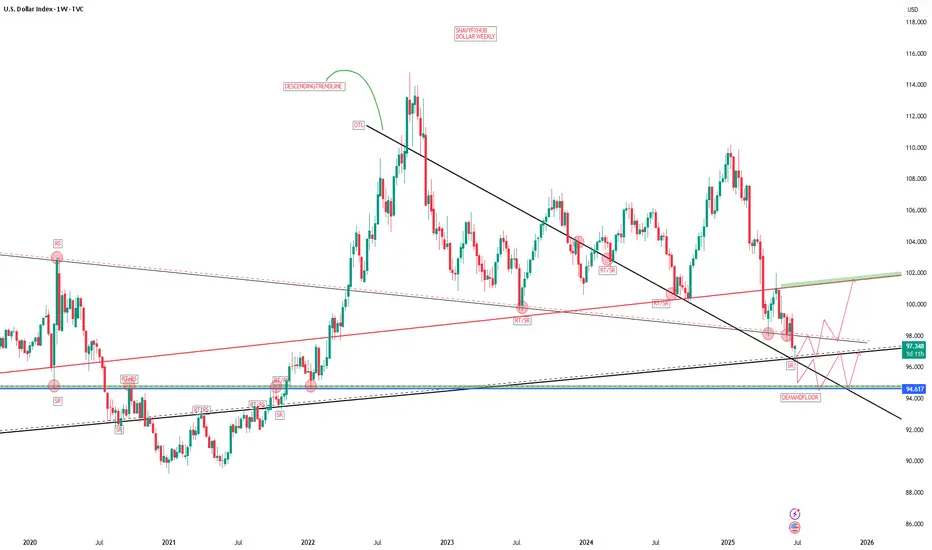
DXY Quite IndecisivePrice on TVC:DXY after having broken below the Swing Low on June 12th @ 97.602 has created a lot of Indecision!
Starting with a 5 Day Long Consolidation period as a Rectangle Pattern
Then after the Bearish Breakout on June 30th due to the Federal Reserve mentioning possibly leaning towards Interest Rate Cuts, we see the TVC:DXY form a Expanding Range
Now at the Swing Low and above all the Consolidation or Indecision, we see a Volume Imbalance in the 97.5 - 97.6 area.
Fundamentally, USD has been mostly beating expectations with:
- Manufacturing and Services PMI's showing Expansion
- Job Openings higher then expected
- Unemployment Claims Low
- Unemployment Rate dropping ( 4.1% )
- Factory Orders Rising
Non-Farm Employment however hurt USD with -33K instead of the 99K forecasted
With all the Tariff uncertainties and how they will affect Inflation continues to worry markets with only a few deals having been ironed out, like the 20% Tariff on Vietnam ( down from 46% ) before the July 9th Deadline.
tradingview.sweetlogin.com
Now with good Employment News out with numbers showing Strong Job Reports, this eases labor fears and could help remove some of the expectations of the amount of Interest Rate cuts this year.
tradingview.sweetlogin.com
tradingview.sweetlogin.com
DXY This is a strong increase in short positions (more than double).
DXY Sentiment: Bearish
Momentum: Increasing bearish pressure
(Speculators are more confident the dollar will weaken)
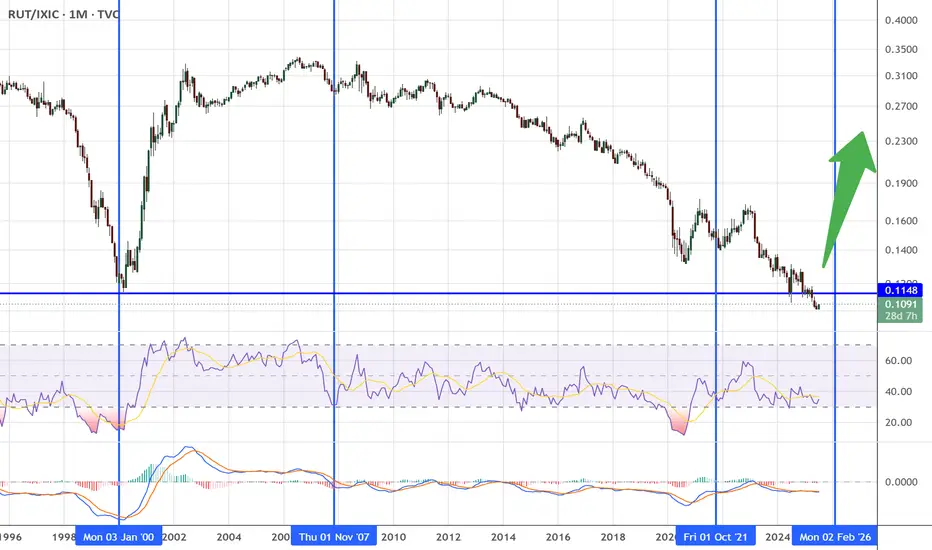
Russell 2000 will start outperforming NasdaqIMO the reversal is here for technology companies. Smaller companies will start outperforming Mega Caps. This will be because investors are looking for higher returns by taking more risk.
Smaller companies have a higher potential stock price appreciation but are more risky.
In 2000, this RUT/NASDAQ ratio reversal marked the top in the Nasdaq. I think we are close but might still have room to grow.
Oct-Nov 2025 Top?
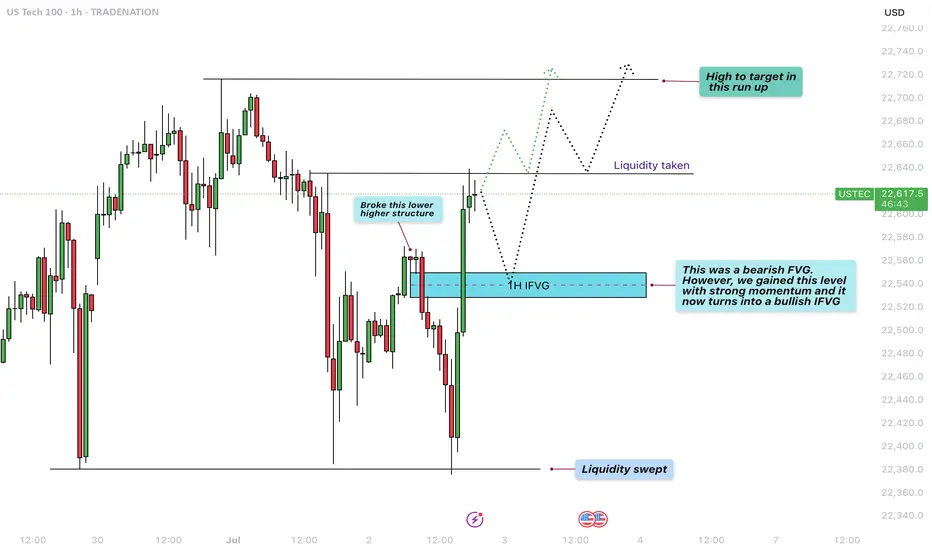
US100 - Reversal after liquidity sweep to target new highs?The chart presented shows a 1-hour analysis of the US100 (Nasdaq 100), illustrating a clean and structured price action narrative. Initially, we observe that the market swept liquidity at the lows, indicated by a sharp wick that pierced beneath the previous support levels. This type of liquidity sweep is common when smart money looks to grab stop-loss orders before reversing the trend.
Liquidity sweep to the downside
Following this liquidity sweep, price action aggressively moved upwards, breaking a lower high structure that had previously marked the bearish control of the market. This break of structure is a key bullish signal, suggesting a shift in momentum from bearish to bullish, and often signifies the beginning of a new upward leg.
1H FVG
An important element on this chart is the 1-hour Fair Value Gap (FVG), initially acting as a bearish imbalance. However, due to the strong bullish momentum, price not only reclaimed this level but did so decisively. As a result, this bearish FVG is now considered a bullish FVG, indicating that it may serve as a support zone on any short-term pullback.
Liquidity taken from the upside
After reclaiming the FVG and breaking structure, price surged further, taking out upside liquidity just above recent highs. This action typically leads to a short-term pullback, as profit-taking and new supply enter the market. The chart suggests that any retracement may find support at the 1H FVG, providing a potential entry point for bullish continuation.
Conclusion
In conclusion, the US100 demonstrated a textbook liquidity grab at the lows, followed by a break in bearish structure, a shift in momentum, and an inversion of a key FVG zone from bearish to bullish. The short-term upside liquidity has been cleared, and the next logical target is the high marked on the chart. Should the price respect the newly formed bullish FVG on any pullback, we can expect continuation toward that upper high, completing the bullish run.
Disclosure: I am part of Trade Nation's Influencer program and receive a monthly fee for using their TradingView charts in my analysis.
Thanks for your support.
- Make sure to follow me so you don't miss out on the next analysis!
- Drop a like and leave a comment!
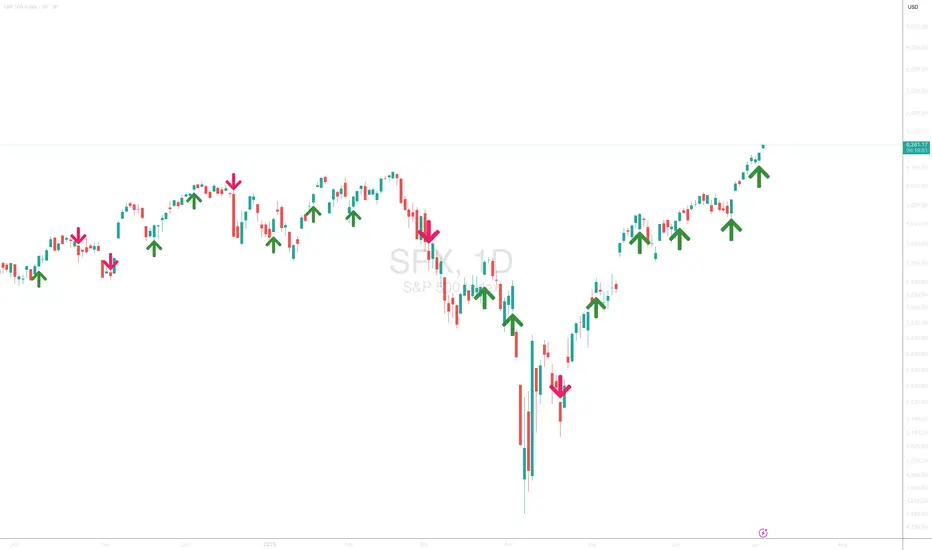
Acorn's Smart Money S&P SignalJuly 2, 2025 - S&P broke to the upside confirming a bullish S&P signal. If correct, the bullish S&P indicator suggests the S&P will close above 6177.97 on July 17. Let’s see if the market can continue to the upside!
Nasdaq ready for pullback??Hi Guys,
The US indices have been ripping back to all time highs without any meaningful pullbacks from the lows.
The Nasdaq is approaching a price level where we may see a pullback and some selling pressure.
The shaded box above the chart is that area and it contains two important fib levels. The bottom of the box is the 1.13 retracement of the recent high to the low after the tarrif news. The black line drawn through the box is the 2.0 retracement of the bear market high to low. This level is always important but it is more significant in this case because the SP 500 and Dow Jones both had the big drops from pretty much exactly this level. The Nasdaq failed to reach this level so if the other two indices are anything to go by we may see some selling here.
Daily RSI is showing divergence. Sell setups using break of structure chart pattern and candlestick patterns on lower time frame could result in nice risk to reward trades.
The red line coming from the bottom is the AVWAP and its no coincidence that it is in line with a n obvious support area should we get a deep enough pullback.
Safe Trading all
DOLLAREXACTLY AS FORECASTED FROM MY WEEKLY DOLLAR CHART,ON STRONG NON-FARM DATA DOLLAR RISE TO KEEP GOING HIGER,GOLD SELL,AUDUSD SELL ,EURUSD SELL GBPUSD SELL.
Average Hourly Earnings m/m
0.3% 0.4% —
Non-Farm Employment Change
147K 111K 139K
Unemployment Rate
4.1% 4.3% 4.2%
Unemployment Claims
233K 240K 236K
Interpretation and Implications
Average Hourly Earnings m/m:
Rose by 0.3%, slightly below the forecast of 0.4%. This suggests wage growth is steady but not accelerating, which may ease some inflation concerns.
Non-Farm Employment Change:
The US economy added 147,000 jobs, beating both the forecast (111K) and the previous month (139K). This indicates continued, though moderate, labor market expansion.
Unemployment Rate:
Fell to 4.1%, better than the expected 4.3% and down from 4.2% previously. This points to a modest improvement in labor market conditions.
Unemployment Claims:
Dropped to 233,000, lower than both the forecast (240K) and last month (236K). This signals fewer new layoffs and continued resilience in the job market.
Market Impact
Dollar (USD):
The combination of stronger-than-expected job growth and a lower unemployment rate is generally supportive for the US dollar, as it suggests the labor market remains robust. However, slightly softer wage growth may temper expectations for aggressive Fed tightening going forward.
Federal Reserve Outlook:
These figures reinforce the Fed’s “data-dependent” stance. Solid job creation and falling unemployment reduce urgency for immediate rate cuts, but the lack of wage acceleration may allow the Fed to maintain a cautious approach.
In summary:
The US labor market in July 2025 shows moderate strength, with job gains and a falling unemployment rate, while wage growth remains steady but not excessive. This mix supports a stable outlook for the dollar and gives the Fed flexibility in its upcoming policy decisions.
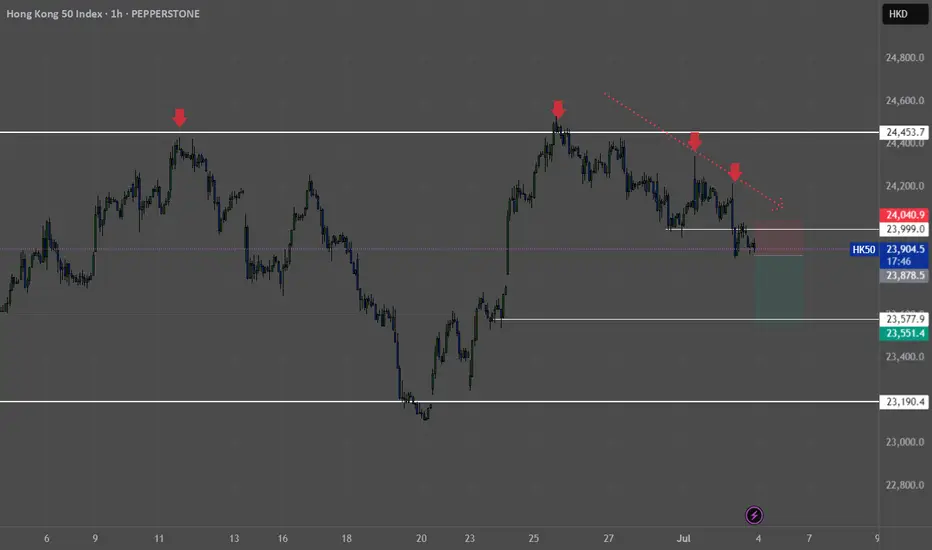
HK50 - H1 - ShortDirection - downwards rejection off 25000 level on the daily, and price moving back into the range.
Level - Price broken support and retested the 24000 level.
Price action - Multiple pin bar rejections off the daily level and hour levels.
DXY - trade - market structure DXY - trade - market structure , easy setup, clean setup , good probability, if this happen is a big win, use risk and trade managment
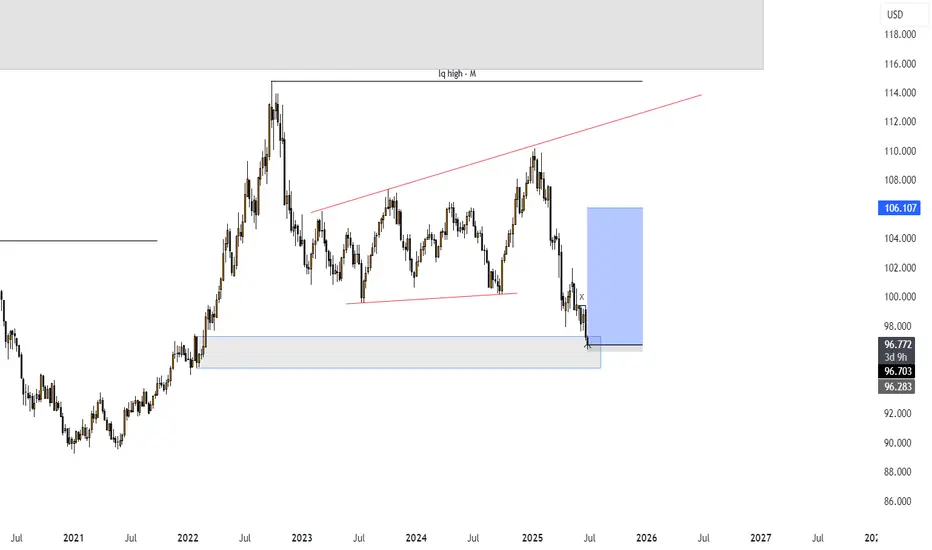
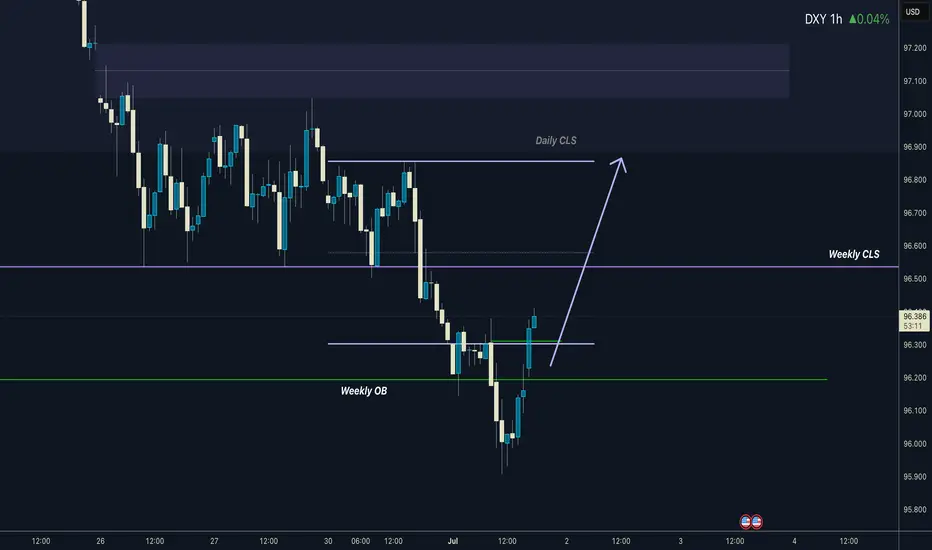
Dollar I Daily CLS I Model 1 I Time for pullbackHey, Market Warriors, here is another outlook on this instrument
If you’ve been following me, you already know every setup you see is built around a CLS Footprint, a Key Level, Liquidity and a specific execution model.
If you haven't followed me yet, start now.
My trading system is completely mechanical — designed to remove emotions, opinions, and impulsive decisions. No messy diagonal lines. No random drawings. Just clarity, structure, and execution.
🧩 What is CLS?
CLS is real smart money — the combined power of major investment banks and central banks moving over 6.5 trillion dollars a day. Understanding their operations is key to markets.
✅ Understanding the behavior of CLS allows you to position yourself with the giants during the market manipulations — leading to buying lows and selling highs - cleaner entries, clearer exits, and consistent profits.
📍 Model 1
is right after the manipulation of the CLS candle when CIOD occurs, and we are targeting 50% of the CLS range. H4 CLS ranges supported by HTF go straight to the opposing range.
"Adapt what is useful, reject what is useless, and add what is specifically your own."
— David Perk aka Dave FX Hunter ⚔️
👍 Hit like if you find this analysis helpful, and don't hesitate to comment with your opinions, charts or any questions.
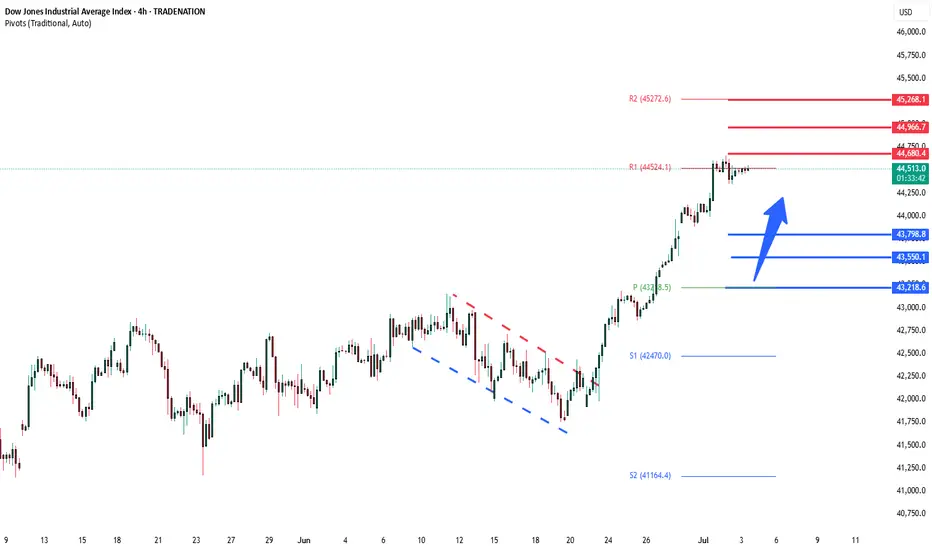
DowJones awaits us employment - NFP data Key Support and Resistance Levels
Resistance Level 1: 44680
Resistance Level 2: 44670
Resistance Level 3: 45270
Support Level 1: 43800
Support Level 2: 43550
Support Level 3: 43220
This communication is for informational purposes only and should not be viewed as any form of recommendation as to a particular course of action or as investment advice. It is not intended as an offer or solicitation for the purchase or sale of any financial instrument or as an official confirmation of any transaction. Opinions, estimates and assumptions expressed herein are made as of the date of this communication and are subject to change without notice. This communication has been prepared based upon information, including market prices, data and other information, believed to be reliable; however, Trade Nation does not warrant its completeness or accuracy. All market prices and market data contained in or attached to this communication are indicative and subject to change without notice.
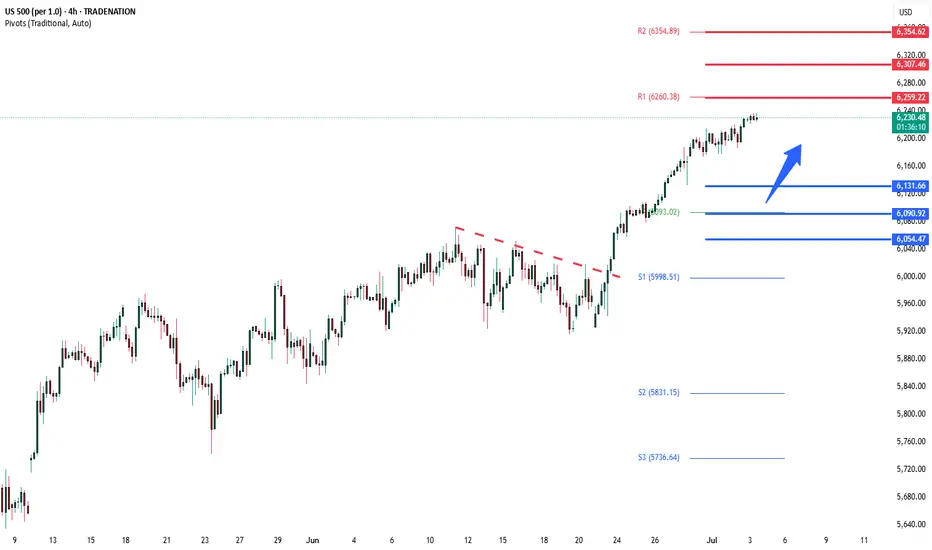
S&P500 bullish ahead of US employment- NFP numbersHouse Republicans moved Trump’s major tax and spending bill closer to a final vote, which could happen before his July 4 deadline. The package includes tax cuts, immigration funding, and the rollback of green energy incentives. Gamblers are raising concerns about a tax increase in the bill that could affect them.
In trade news, the US eased export rules on chip design software to China as part of an ongoing deal. China’s tone has shifted more positively, with a top official saying he’s hopeful about US-China relations and that conflict between the two is “unimaginable.”
At the Fed, Chair Jerome Powell hasn’t said if he’ll step down when his term ends in May, adding uncertainty. Trump, who wants a loyal replacement, has called for his resignation after a federal agency accused Powell of giving misleading testimony about expensive Fed building renovations.
On Wall Street, value investing made a comeback last quarter. Over 60% of active value fund managers beat their benchmarks by buying cheap industrial stocks and avoiding underperforming sectors like utilities and consumer staples.
Conclusion:
US equities are steady but cautious. Uncertainty around Fed leadership and Trump’s economic plans is keeping markets in check, while improving US-China trade relations and a shift toward value stocks are offering support.
Key Support and Resistance Levels
Resistance Level 1: 6260
Resistance Level 2: 6307
Resistance Level 3: 6355
Support Level 1: 6130
Support Level 2: 6090
Support Level 3: 6055
This communication is for informational purposes only and should not be viewed as any form of recommendation as to a particular course of action or as investment advice. It is not intended as an offer or solicitation for the purchase or sale of any financial instrument or as an official confirmation of any transaction. Opinions, estimates and assumptions expressed herein are made as of the date of this communication and are subject to change without notice. This communication has been prepared based upon information, including market prices, data and other information, believed to be reliable; however, Trade Nation does not warrant its completeness or accuracy. All market prices and market data contained in or attached to this communication are indicative and subject to change without notice.