ICTTrading foreign currencies can be a challenging and potentially profitable opportunity for investors. However, before deciding to participate in the Forex market, you should carefully consider your investment objectives, level of experience, and risk appetite. Most importantly, do not invest money you cannot afford to lose.
There is considerable exposure to risk in any foreign exchange transaction. Any transaction involving currencies involves risks including, but not limited to, the potential for changing political and/or economic conditions that may substantially affect the price or liquidity of a currency. Investments in foreign exchange speculation may also be susceptible to sharp rises and falls as the relevant market values fluctuate. The leveraged nature of Forex trading means that any market movement will have an equally proportional effect on your deposited funds. This may work against you as well as for you. Not only may investors get back less than they invested, but in the case of higher risk strategies, investors may lose the entirety of their investment. It is for this reason that when speculating in such markets it is advisa
Market indices

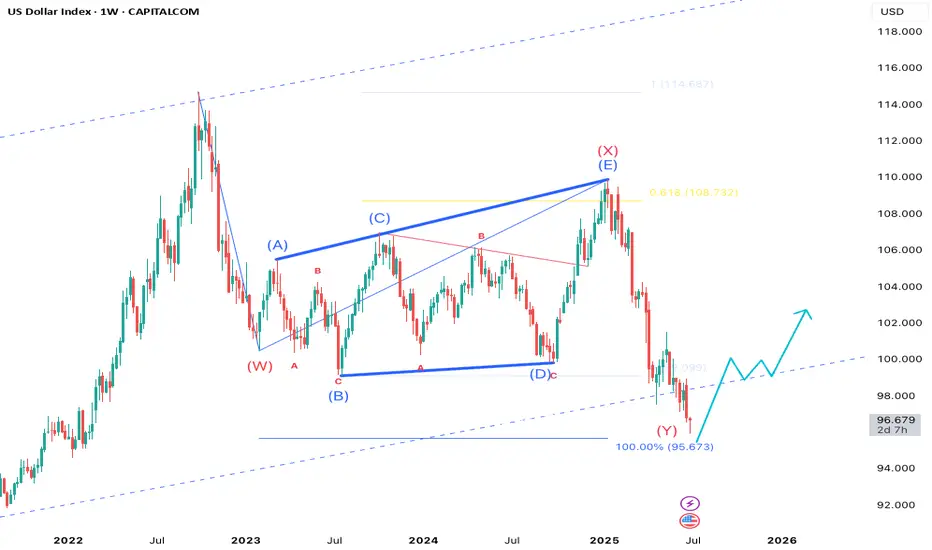
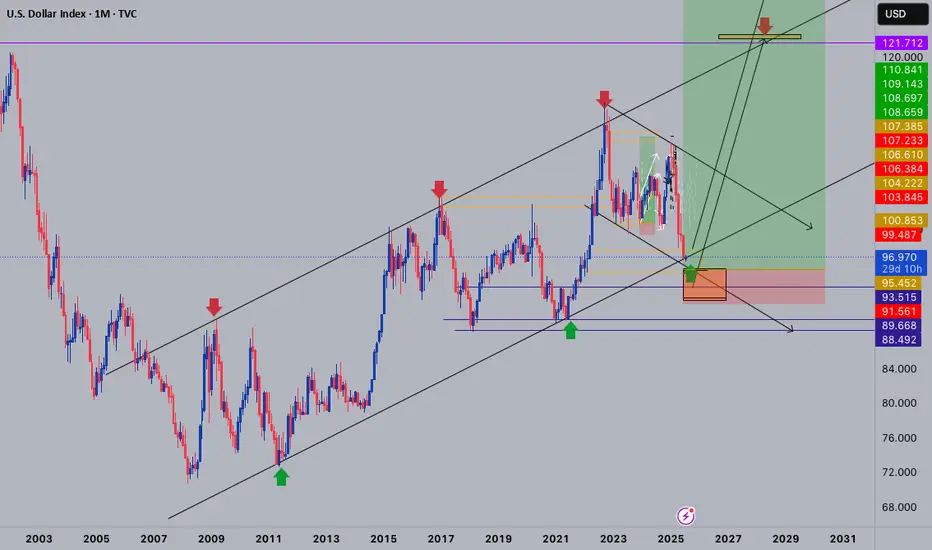
dollar elliott wave countingdxy is falling since it peaked in Q4 2022
since their last 75bps hike dollar is constantly falling and stocks, gold, bitcoin constantly rising and making new all time high
wave W = wave Y
(equal in length, 100% projection for wave Y)
since starting of the year due to trump tariff dollar is falling
this is year in first half dollar saw biggest collapse since end of gold standard
now 100% projection target for wave Y at 95 area is big static support level
if dxy recover back to 100 area then this will be first sign of reversal
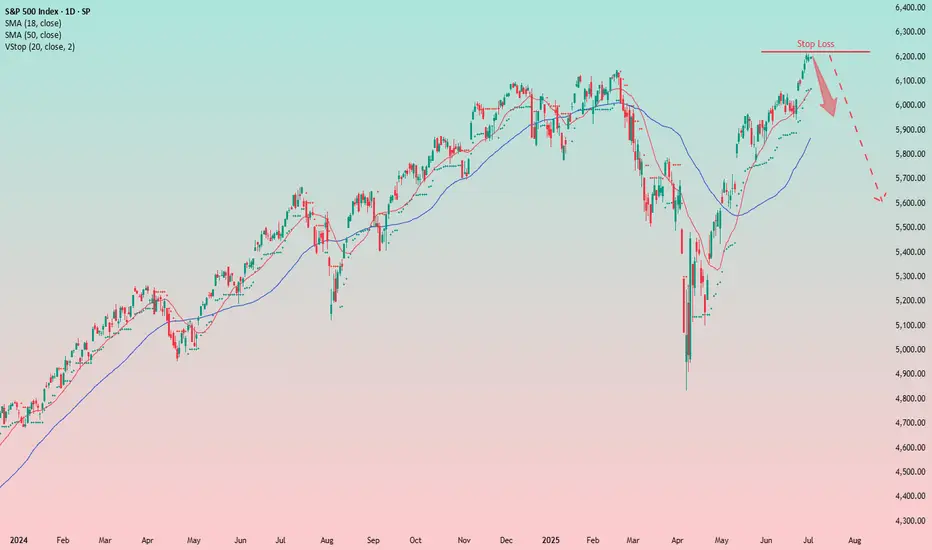
Bearish Outlook on the S&P 500: Time to Get ReadyFrom a long-term perspective, I see a short setup building on the S&P 500 index. The anticipated rate cuts in the U.S. — which I believe are coming soon — have historically led to market declines, despite the common perception that lower rates are bullish for equities.
Additionally, the market appears overheated: P/E ratios are at extreme highs, more than 50% above historical averages.
Given this, I expect we’ll see a downside move soon.
Since markets tend to rise slowly but fall quickly, I’m beginning to build a short position in advance. Stops may get hit, and re-entries might be necessary, but overall I see more reasons supporting this thesis than contradicting it.
The end of the downward trend for the dollar index on the stockAccording to market structure, a new bullish trend is approaching. The stock market clearly reflects the overvaluation of its main exchanges. Everything seems to indicate that there will be news about the Fed's strengthening of interest rates. Something will happen. Long-term entries for USDXYZ assets, and short XYZUSD. MY POINT OF VIEW ON THE STOCK MARKET.
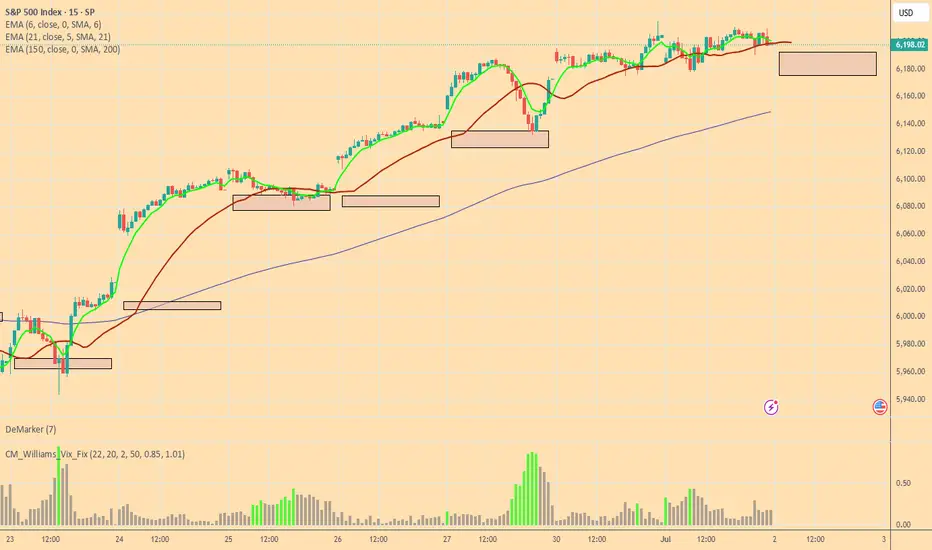
Bulls and Bears Zone for 07-02-2025S&P keeps going higher after new ATH high earlier this week. Markets could go higher for a while if we see any pullback.
Level to watch: 6232 ---6234
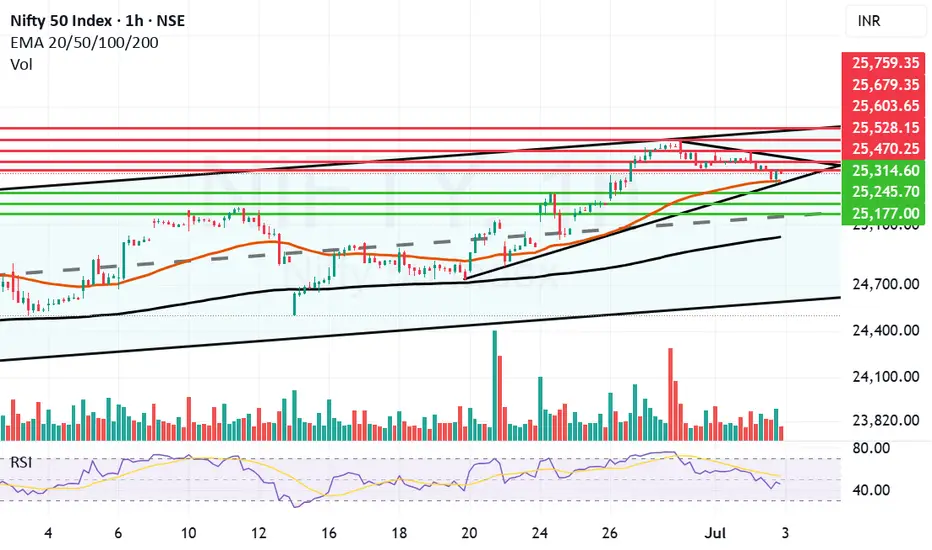
Nifty took support at the Mother line and trying to recoverNifty has taken support at the Mother line today and tried to post a recovery. Again proving our Mother, Father and small Child theory correct. To know more about the Mother father and small Child theory of stock market. Read my book THE HAPPY CANDLES WAY TO WEALTH CREATION. Nifty during the day made a low of 25378 and closed the day at 25453. It is not a strong recovery nevertheless the recover of 75 points recovery which makes shadow of the candle neutral to positive. Let us see if Nifty can recovery fully tomorrow or Friday to close the week in positive.
Nifty Supports remain at: 25396 (Mother Line Support which is also near the trend line support at 25378), there there is a support at 25245 and finally mid channel support near 25177. Closing below 25177 will make the Bears more powerful and they can drag the index further down towards Father line support near 25108.
Nifty Resistances remain at: 25470, 25528 (Trend line resistance), 25603 and finally 25679. 25759 seems to be the channel top currently in the hourly parallel channel.
Disclaimer: The above information is provided for educational purpose, analysis and paper trading only. Please don't treat this as a buy or sell recommendation for the stock or index. The Techno-Funda analysis is based on data that is more than 3 months old. Supports and Resistances are determined by historic past peaks and Valley in the chart. Many other indicators and patterns like EMA, RSI, MACD, Volumes, Fibonacci, parallel channel etc. use historic data which is 3 months or older cyclical points. There is no guarantee they will work in future as markets are highly volatile and swings in prices are also due to macro and micro factors based on actions taken by the company as well as region and global events. Equity investment is subject to risks. I or my clients or family members might have positions in the stocks that we mention in our educational posts. We will not be responsible for any Profit or loss that may occur due to any financial decision taken based on any data provided in this message. Do consult your investment advisor before taking any financial decisions. Stop losses should be an important part of any investment in equity.
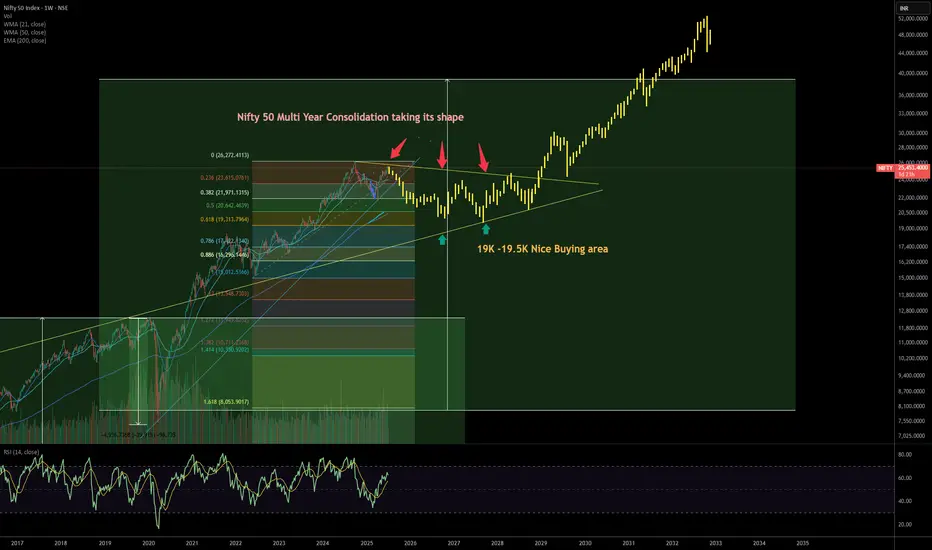
Nifty 50’s Long-Term-Unpacking the Multi-Year ConsolidationChart showcases the Nifty 50 Index on a weekly timeframe, highlighted with multi-year consolidation patterns, key Fibonacci retracement levels, and a suggested buy zone—here’s a compelling publishing idea tailored for both traders and long-term investors:
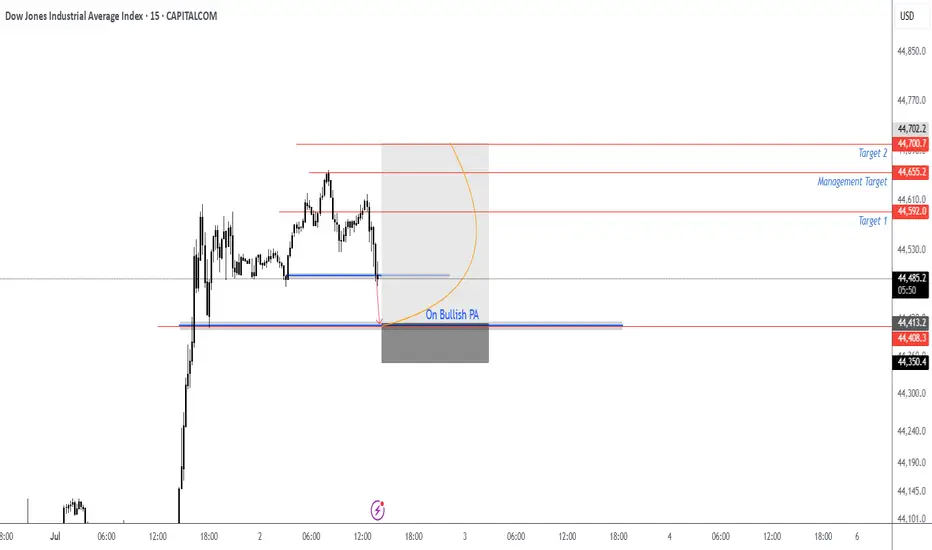
US30 Pullback then LongLooking for the pullback then on on bullish PA look for the entry. Wait for breach below then push back up and bullish PA close then plan entries.
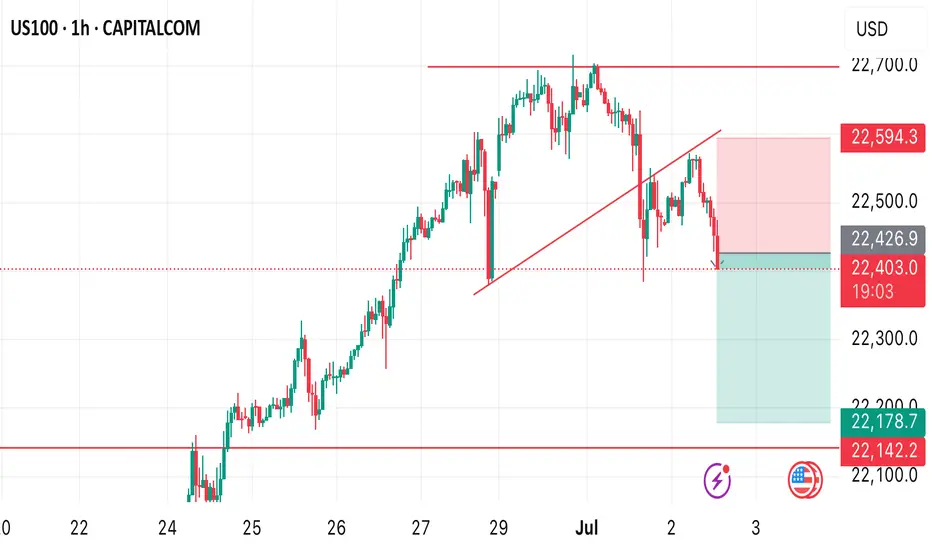
US100 POSSIBLE SELL OPPORTUNITY!!We’re going to see a possible sell opportunity on US100 from the current market price. SL 22594 take profit at 22178
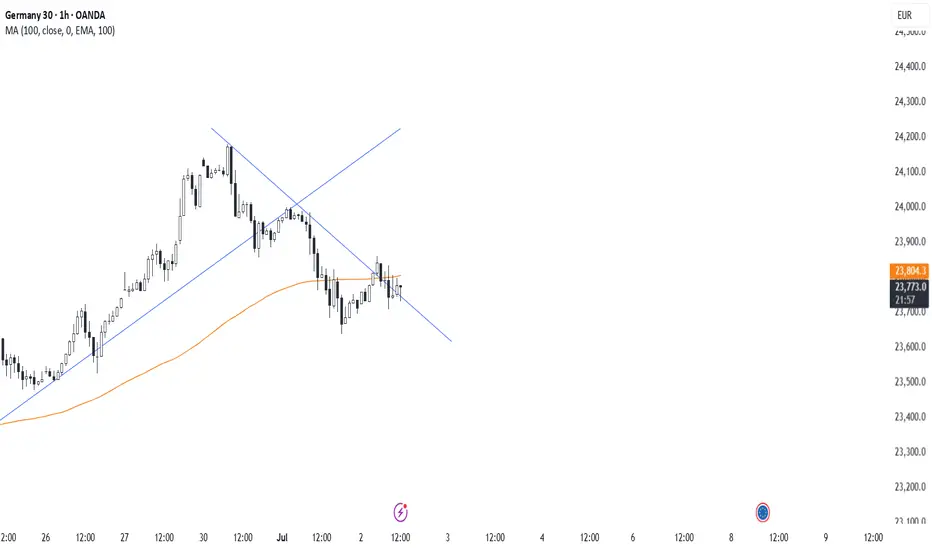
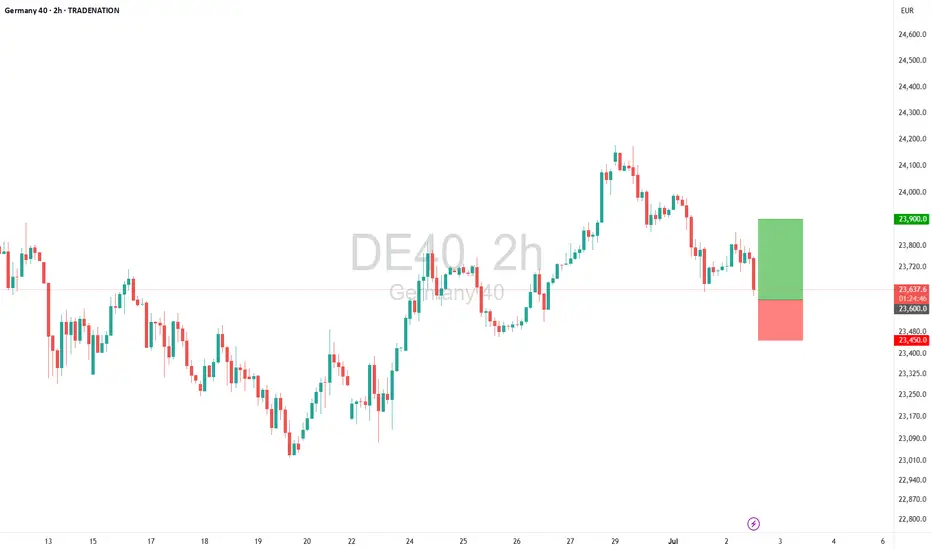
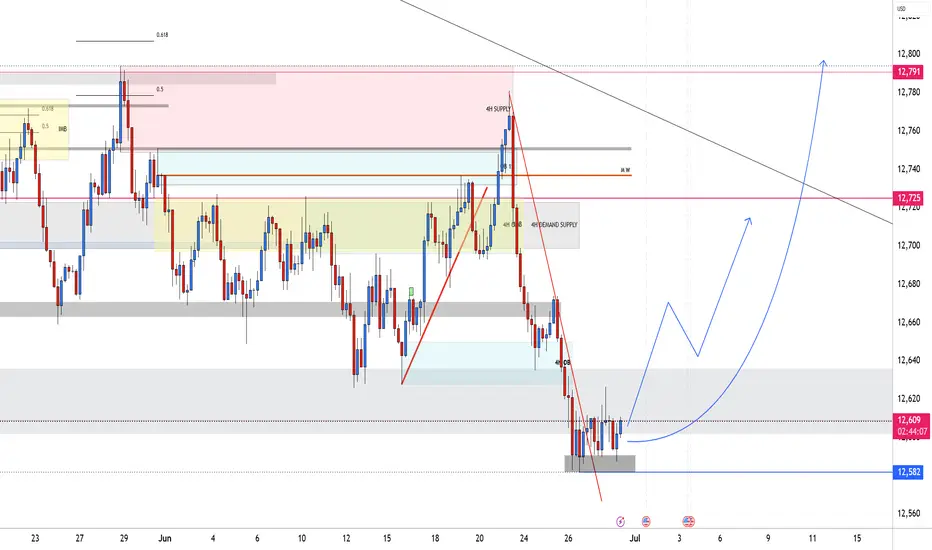
DE40 – Buy the Dip as Bottom Formation EmergesTrade Idea
Type: Buy Limit
Entry: 23,600
Target: 23,900
Stop Loss: 23,450
Duration: Intraday
Expires: 03/07/2025 06:00
Technical Overview
Recent price action suggests a bottom is forming, setting the stage for a potential upward move.
Further upside is expected, but current levels offer a poor risk/reward for immediate buying — instead, waiting for a dip to 23,600 is preferred.
A confirmed move above 23,750 would signal renewed bullish momentum, aligning with a measured move target around 24,000.
Traders should be mindful of ECB President Lagarde’s speech at 15:15 UTC, which may influence overall risk sentiment and European indices.
Key Technical Levels
Support: 23,700 / 23,600 / 23,500
Resistance: 23,800 / 23,900 / 24,000
Disclosure: I am part of Trade Nation's Influencer program and receive a monthly fee for using their TradingView charts in my analysis.
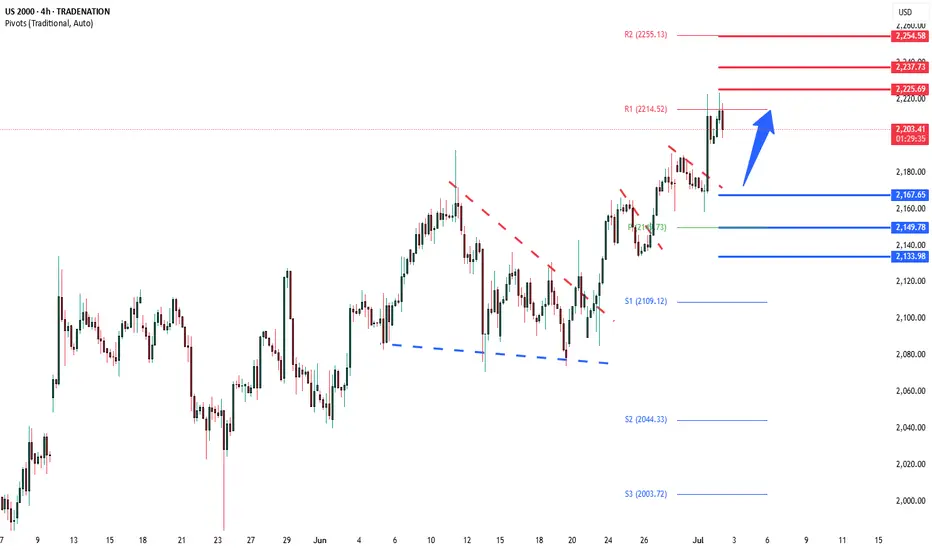
Russell2000 bullish breakout supported at 2167Key Support and Resistance Levels
Resistance Level 1: 2225
Resistance Level 2: 2240
Resistance Level 3: 2255
Support Level 1: 2167
Support Level 2: 2150
Support Level 3: 2134
This communication is for informational purposes only and should not be viewed as any form of recommendation as to a particular course of action or as investment advice. It is not intended as an offer or solicitation for the purchase or sale of any financial instrument or as an official confirmation of any transaction. Opinions, estimates and assumptions expressed herein are made as of the date of this communication and are subject to change without notice. This communication has been prepared based upon information, including market prices, data and other information, believed to be reliable; however, Trade Nation does not warrant its completeness or accuracy. All market prices and market data contained in or attached to this communication are indicative and subject to change without notice.
NSDQ100 lower after ADP Employment shrank to 33K in JuneTrump Trade Tensions:
Donald Trump reaffirmed his July 9 deadline for higher tariffs, intensifying criticism of Japan, particularly over auto sector issues. While Japan insists talks are in good faith, market fears of a breakdown are rising.
US Tax Policy in Focus:
Trump’s “Big Beautiful” tax and spending bill faces potential resistance in the House despite narrowly passing the Senate. The proposal’s scale and political friction are drawing investor attention.
Apple Supply Chain Worry:
Foxconn has pulled hundreds of Chinese staff from its Indian iPhone factories, sparking fresh concerns about Apple’s supply chain and Wall Street’s potentially overheated tech optimism.
Paramount Settlement:
Paramount resolved a lawsuit with Trump over alleged election interference via CBS’s coverage. Meanwhile, the company awaits FCC approval for its Skydance merger.
Auto Sector Weakness:
Stellantis reported a 10% drop in U.S. Q2 deliveries despite some brand gains. Tesla is expected to post a 12% annual decline in vehicle deliveries, reinforcing signs of cooling demand in the sector.
Conclusion:
Markets remain cautious but resilient amid political tensions, supply chain disruptions, and weaker auto sales. Attention is now turning to upcoming trade deadlines, policy decisions, and Q2 corporate results.
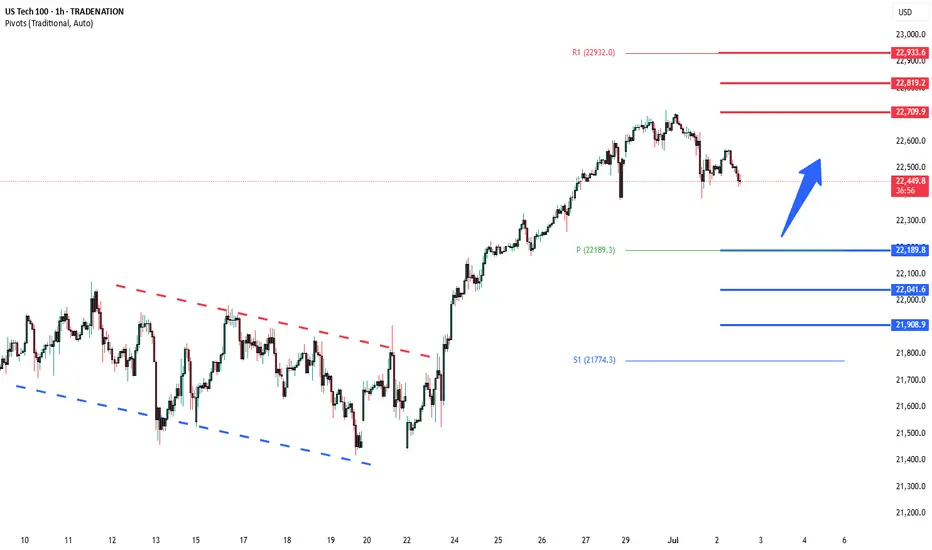
Key Support and Resistance Levels
Resistance Level 1: 22710
Resistance Level 2: 22820
Resistance Level 3: 22930
Support Level 1: 22190
Support Level 2: 22040
Support Level 3: 21900
This communication is for informational purposes only and should not be viewed as any form of recommendation as to a particular course of action or as investment advice. It is not intended as an offer or solicitation for the purchase or sale of any financial instrument or as an official confirmation of any transaction. Opinions, estimates and assumptions expressed herein are made as of the date of this communication and are subject to change without notice. This communication has been prepared based upon information, including market prices, data and other information, believed to be reliable; however, Trade Nation does not warrant its completeness or accuracy. All market prices and market data contained in or attached to this communication are indicative and subject to change without notice.
just slightly kidding, yes or no DXY MONTHLYjust slightly kidding, yes or no DXY MONTHLY\
bullish. so very bullish
let us know!
free transparent no edit no delete
🐉We value full transparency. All wins and fails fully publicized, zero edit, zero delete, zero fakes.🐉
🐉Check out our socials for some nice insights.🐉
information created and published doesn't constitute investment advice!
NOT financial advice
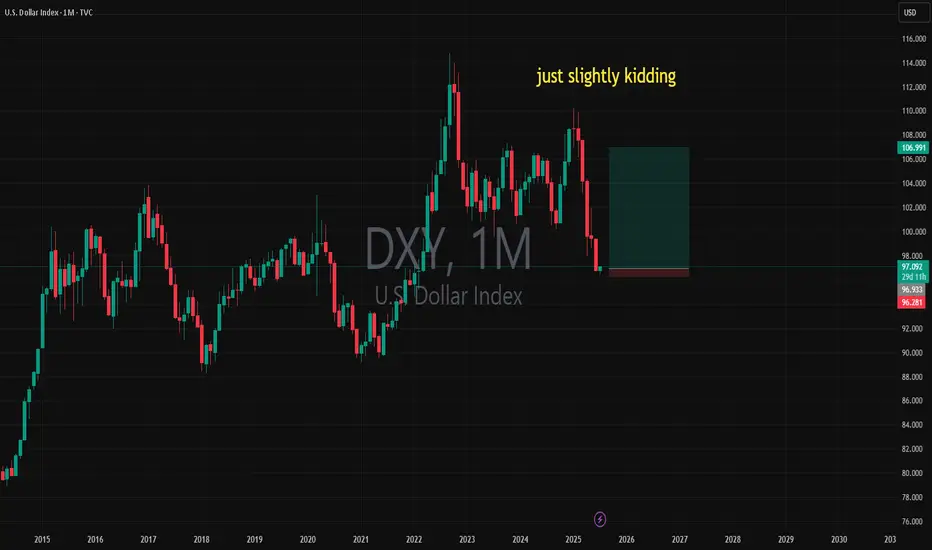
DXY DOLLAONLY looking for bullish price action..
we already have a plan paitence wins the race as per 😃
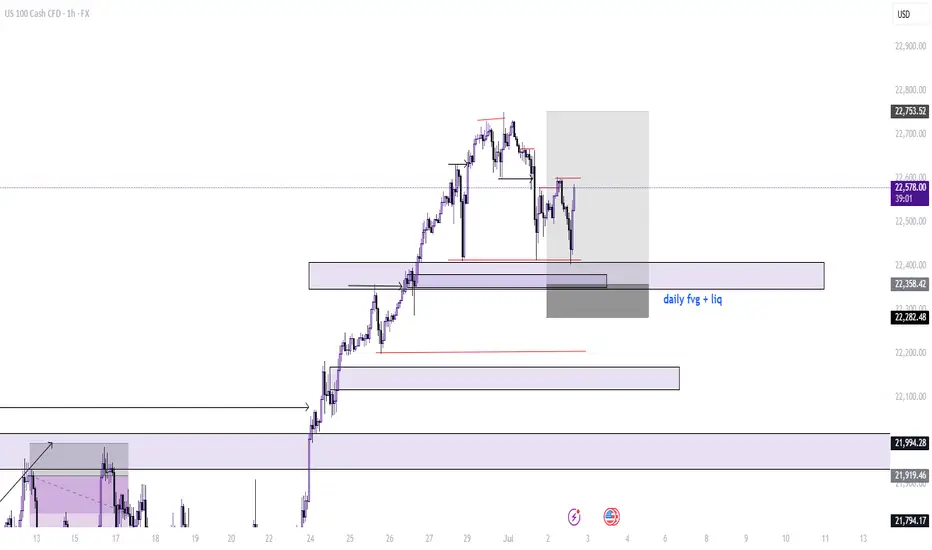
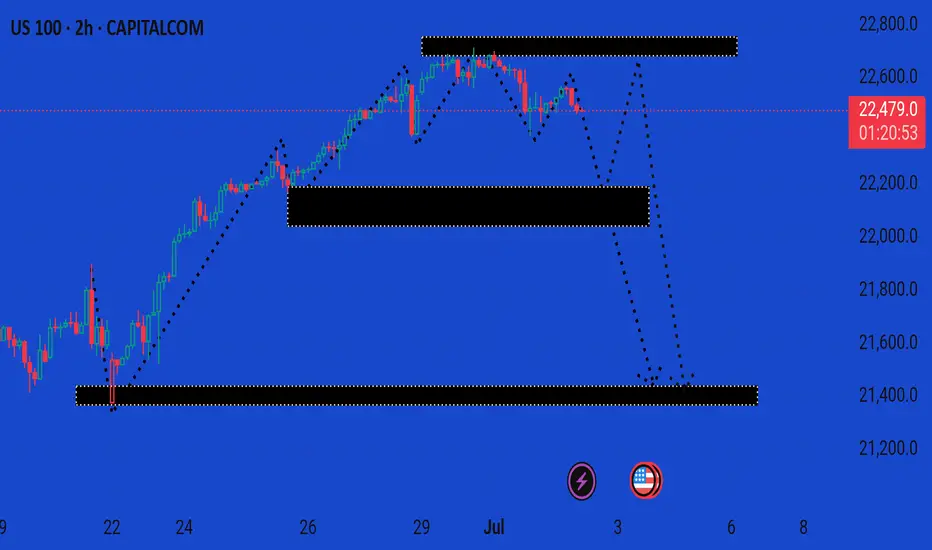
US100 update market The chart you've shared is a 2-hour timeframe for the US 100 index (NASDAQ 100) with a clear bearish outlook marked by projected price levels and potential demand zones.
Key Observations:
1. Current Price:
22,478.5 (near-term consolidation with recent bearish pressure)
2. Highlighted Zones:
Resistance Zone: Around 22,750–22,800 — where price previously reversed.
First Demand Zone: Around 22,100–22,200 — potential support.
Second Demand Zone: Around 21,500–21,600 — deeper support level.
Third Major Demand Zone: Near 21,200 — long-term support.
3. Bearish Structure:
Price has broken below recent support levels.
Black dotted line shows a projected move toward lower demand zones.
Momentum appears to be weakening after a strong bullish rally from June 21–28.
4. Technical Bias:
This is a bearish correction or possible trend reversal setup.
The presence of strong demand zones suggests potential bounce zones if price reaches those levels.
---
Summary:
This chart implies a bearish move is underway on the US 100 with expected targets near 22,100, then 21,600, and potentially 21,200. Watch for bullish reaction or reversal signals at those zones. If price reclaims 22,800+, bearish outlook would be invalidated.
Let me know if you want a trade setup or confirmation strategy based on this analysis.
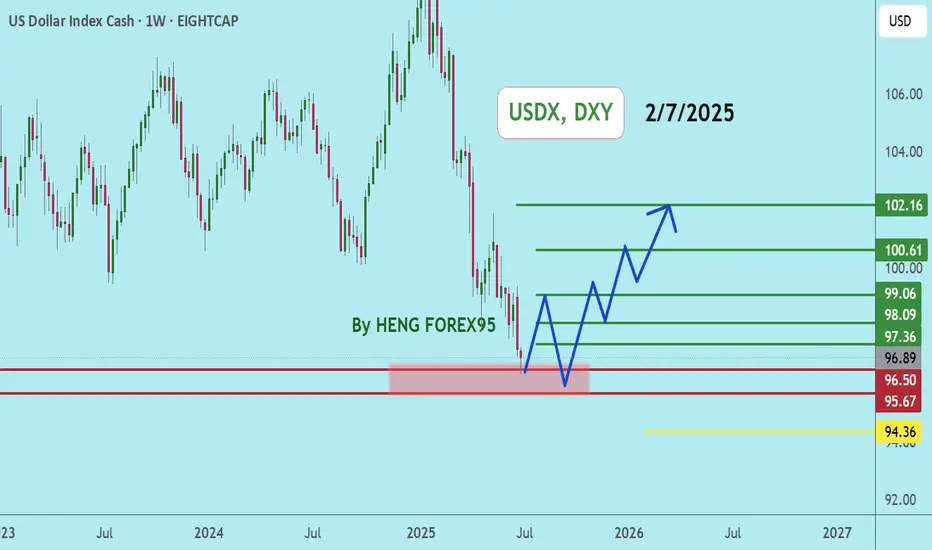
DXYDXY price has come down to test the important support zone 96-95. If the price cannot break through the 95 level, it is expected that the price will rebound. Consider buying the red zone.
🔥Trading futures, forex, CFDs and stocks carries a risk of loss.
Please consider carefully whether such trading is suitable for you.
>>GooD Luck 😊
❤️ Like and subscribe to never miss a new idea!
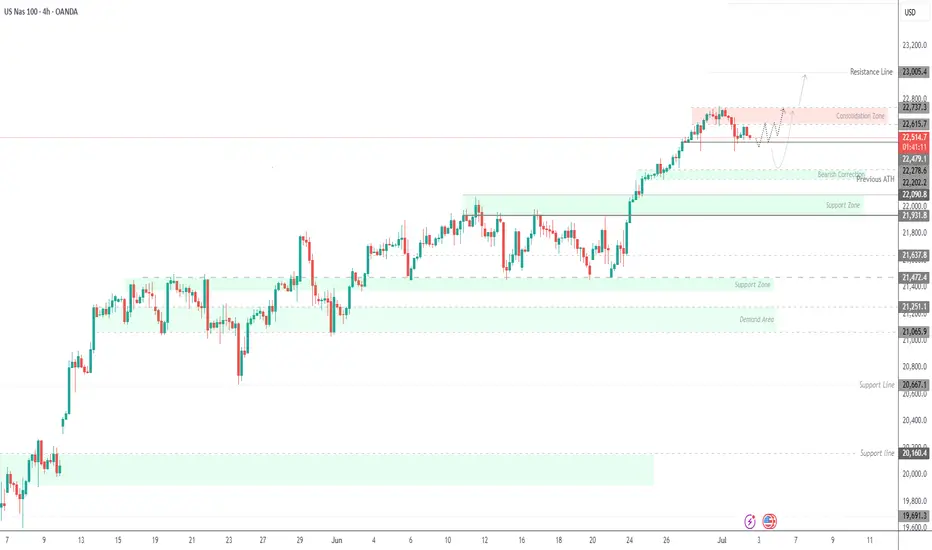
Tesla Drop Pressures Nasdaq – 22,470 Key to Hold RecoveryUSNAS100 | Overview
Tesla dropped approximately 5%, weighing heavily on the Nasdaq, amid public tensions between Elon Musk and Donald Trump.
Yesterday, the price declined below 22,610 due to the impact of Tesla’s fall but remained above 22,470. As long as it trades above this level, a recovery attempt is likely, with the price expected to break through the consolidation zone between 22,615 and 22,740.
However, if the 1h candle closes below 22,470, the bearish trend is expected to continue toward 22,280 and potentially lower.
Pivot: 22,470
Resistance: 22,615 – 22,740 –23,000
Support: 22,280 – 22,200
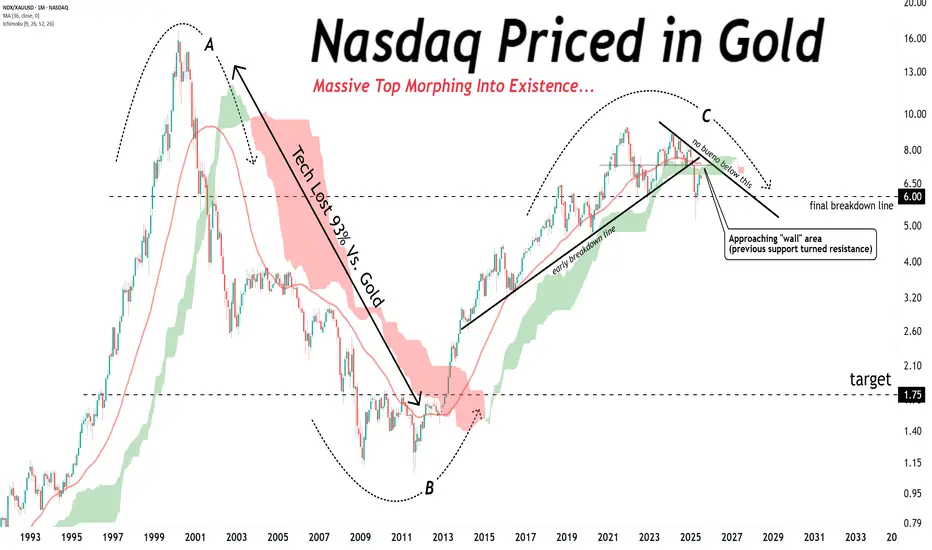
The Nasdaq rally might be reaching its limits… The Nasdaq rally might be reaching its limits…
When priced in gold, a massive topping structure is morphing into existence.
Final breakdown coming?
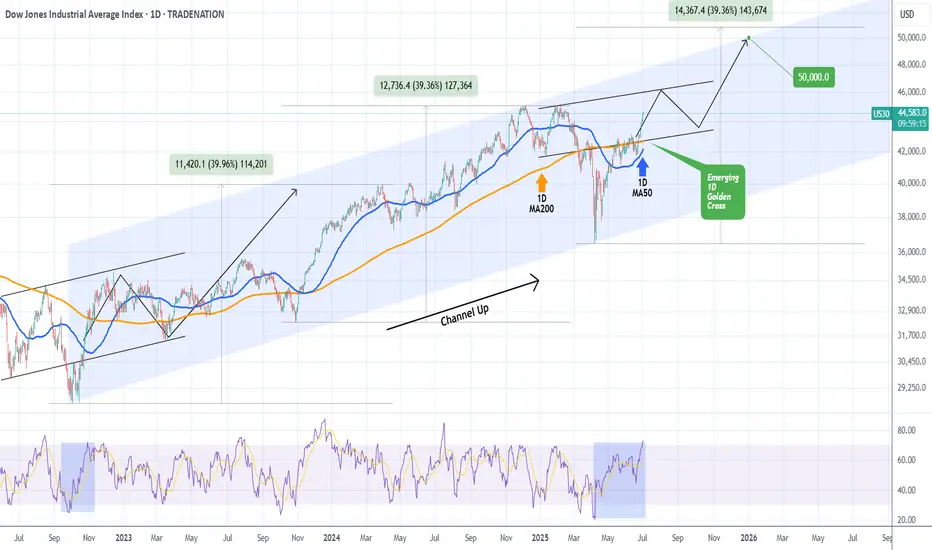
DOW JONES This is how it hits 50000 by the end of the year.Dow Jones (DJI) has been trading within a Channel Up pattern since the October 03 2022 market bottom and since the April 07 2025 Low, it's been unfolding the pattern's new Bullish Leg.
Ahead of an emerging 1D Golden Cross, the first since December 13 2022, the price action looks more bullish than ever strongly supported by the 1D MA50 (blue trend-line).
In fact, it is not that different from the fractal of that last 1D Golden Cross, which traded inside a neckline before the Bullish Leg broke upwards and completed eventually a +39.96% rise.
We expect a 50000 test towards the end of the year at the top of the Channel Up, which is still marginally below the tolerance levels of a +39.36% rise.
-------------------------------------------------------------------------------
** Please LIKE 👍, FOLLOW ✅, SHARE 🙌 and COMMENT ✍ if you enjoy this idea! Also share your ideas and charts in the comments section below! This is best way to keep it relevant, support us, keep the content here free and allow the idea to reach as many people as possible. **
-------------------------------------------------------------------------------
Disclosure: I am part of Trade Nation's Influencer program and receive a monthly fee for using their TradingView charts in my analysis.
💸💸💸💸💸💸
👇 👇 👇 👇 👇 👇
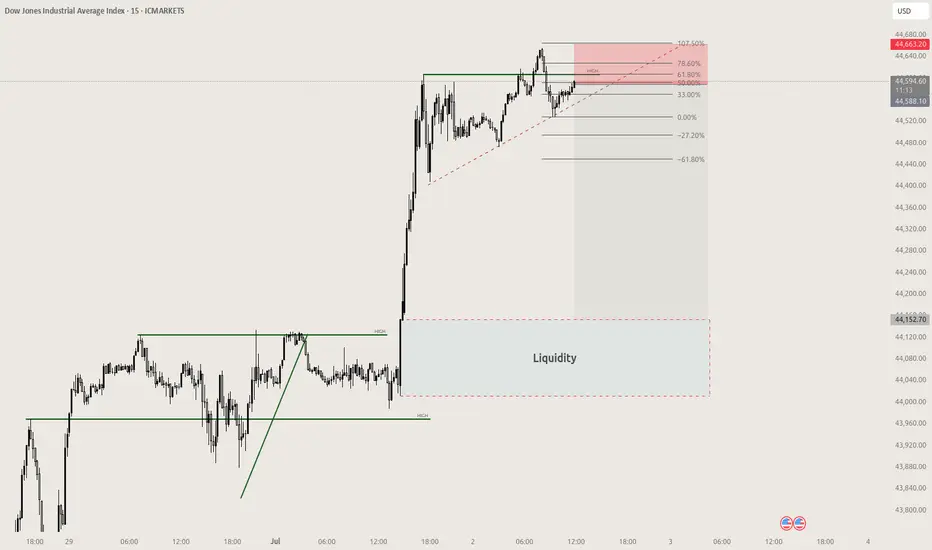
US30 Scalp short Swing failure patternSwing failure pattern with bearish FVG, wait for bearish candle confirmation, liquidity below
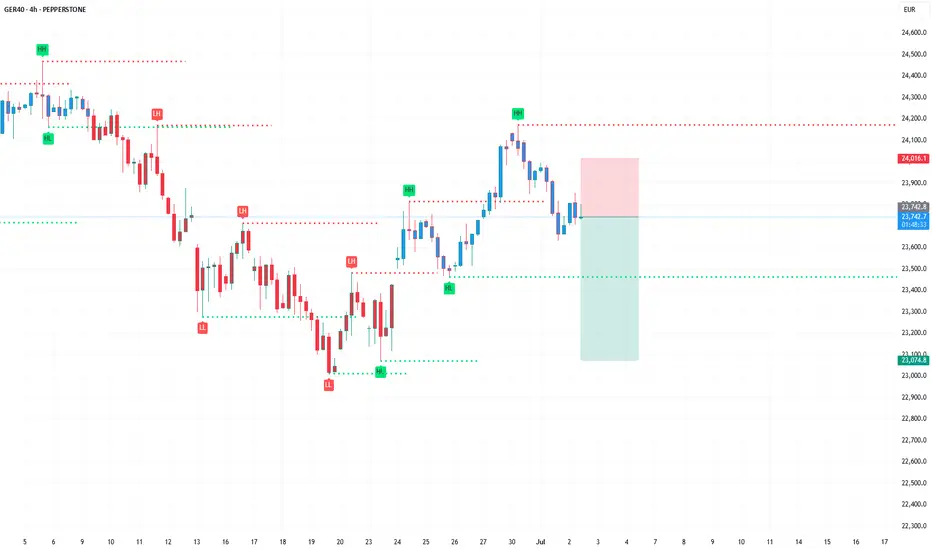
Potential long trade DAXRisk appetite seems to have returned to the market with most global indices reaching new all time highs. The DAX should be no exception to joining the long rally with tariff jitters become the least of investor worries. The overall trend on a daily chart and 4H are bullish. A clear break of the short-term retracement trendline should spark another bullish sequence the could create new highs.