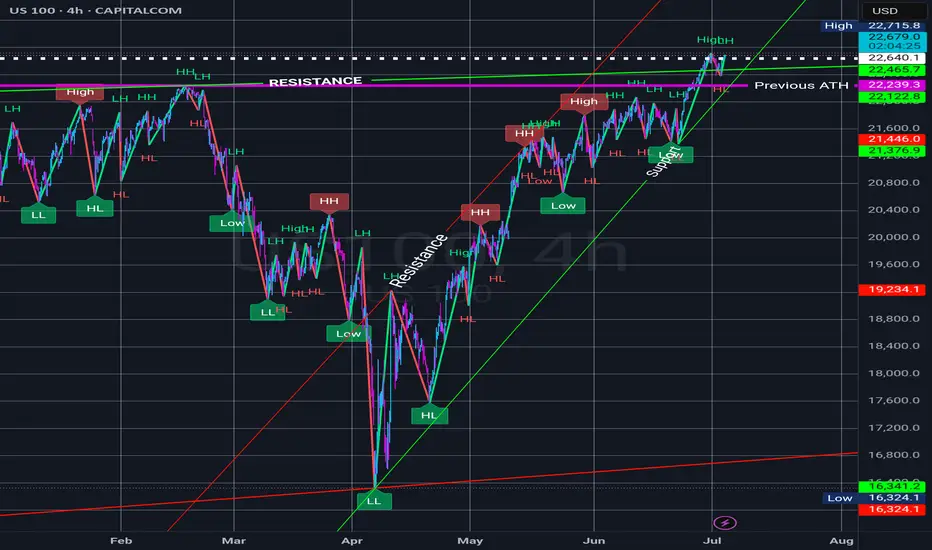
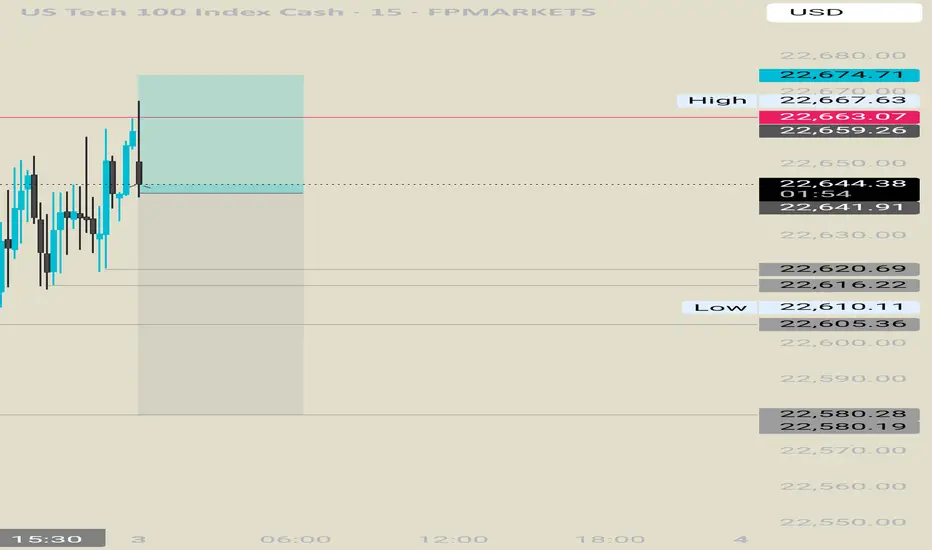
Clear uptrend continuation to 23000+As you can see. We are ascending. All details on chart.
Beware of over leveraged trades. Shorts especially.
NASDAQ:TQQQ NASDAQ:QQQ SKILLING:US100
Market indices
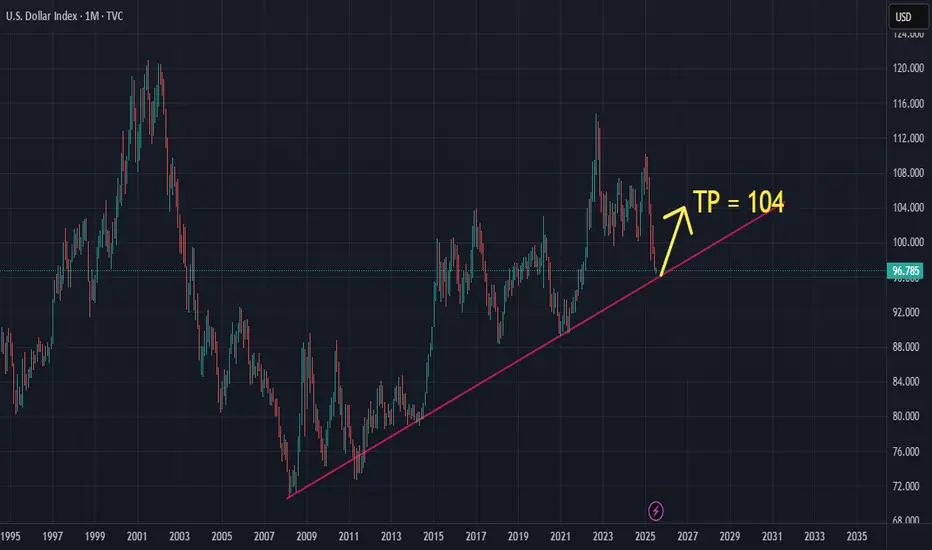
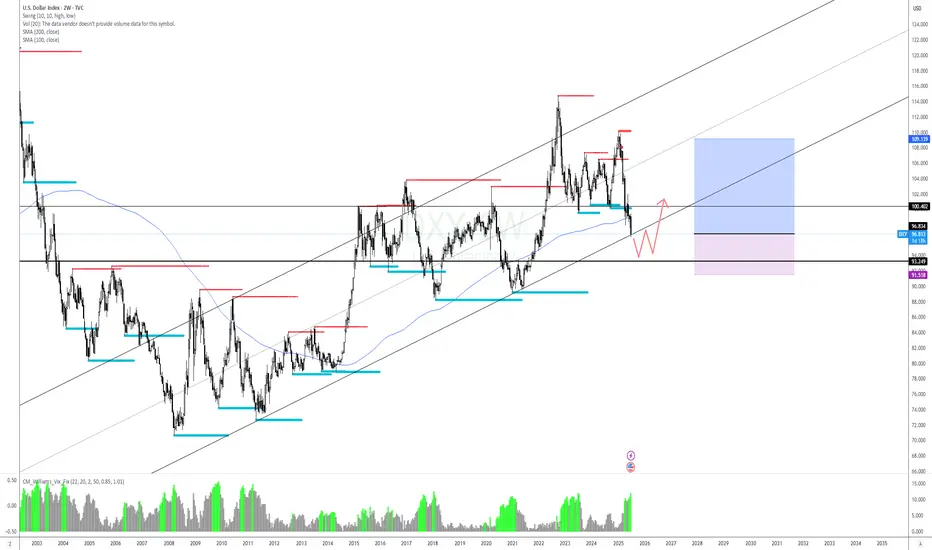
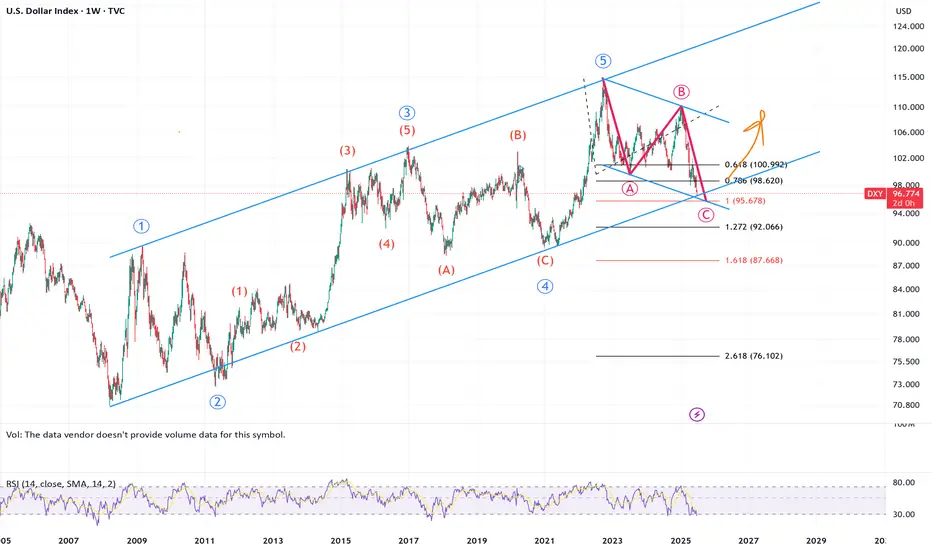
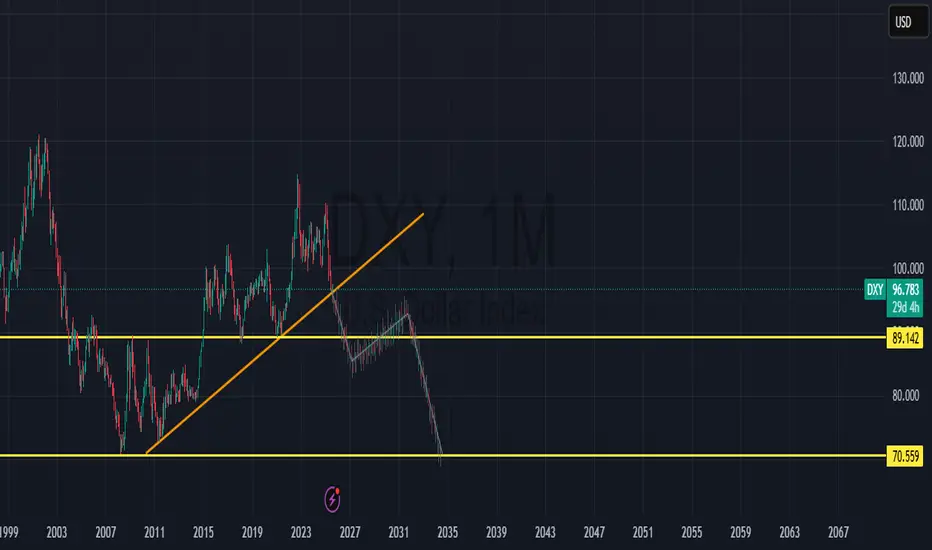
Long-term view for DXY!The current market sentiment isn't favorable for the dollar, but it still presents a good buying opportunity for long-term investors—especially for those looking to purchase USD from exchanges without using leverage or taking on trading risks.
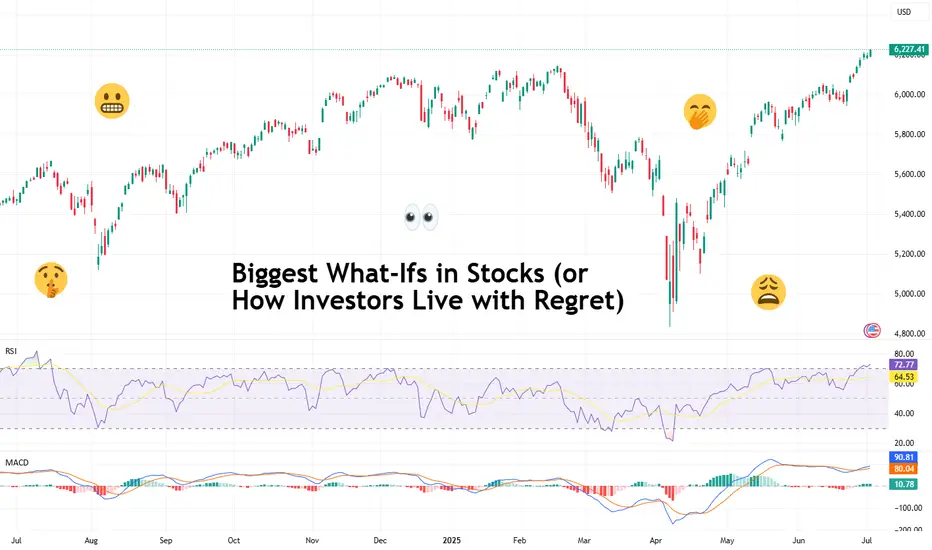
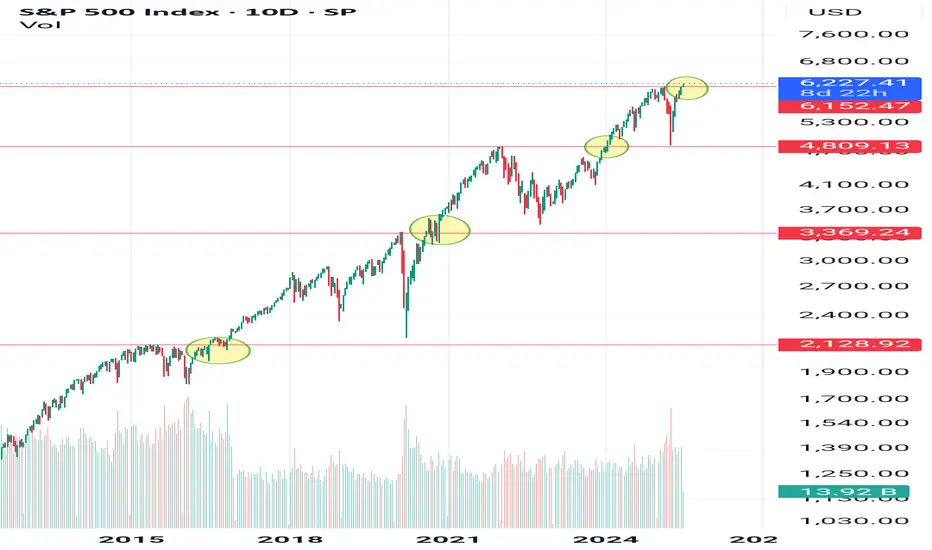
Biggest What-Ifs in Stocks (or How Investors Live with Regret)You think you’ve got regrets because you didn’t buy Nvidia NASDAQ:NVDA at $50 or sold Tesla NASDAQ:TSLA at $420? Join the club.
The stock market’s history is littered with “almost” trades, missed deals, and facepalm-worthy decisions that turned out to be trillion-dollar pivots.
This is the hall of fame for what didn’t happen — and what those stories teach us about how markets (and human nature) actually work. Call it a free masterclass in greed, fear, FOMO, and the priceless value of just sitting tight sometimes.
Take it easy today, grab your cold brew and read up on the biggest what-ifs in stock market history.
🍏 Ronald Wayne: The Patron Saint of “Oops”
Our first inductee needs no introduction. But let’s do it anyway. Ronald Wayne, the third Apple NASDAQ:AAPL co-founder, sold his 10% stake back in 1976 for the princely sum of $800. He wanted to avoid any debts if things went south. Sensible, right?
That $800 stake today would be worth more than $300 billion. That’s more than the GDP of Finland — and about 1.2 million new iPhones every single day for pretty much the rest of his life. Wayne has since said he doesn’t regret it. Which is probably the biggest lie he’s ever told.
🍿 Blockbuster’s Netflix “Pass”
In 2000, Netflix NASDAQ:NFLX was a DVD-by-mail startup with spotty profits. Reed Hastings, Netflix’s founder, knocked on Blockbuster’s door and offered to sell the whole thing for $50 million — about the price of a Hollywood production.
Blockbuster’s execs reportedly laughed him out of the room. “People will always want to drive to a store to rent a VHS,” they said, basically. Fast forward: Netflix is worth around $560 billion, and Blockbuster is down to one store that’s mostly a selfie museum for millennials who miss rewinding tapes.
💻 Microsoft’s Lifeline That Saved Apple
In 1997, Apple NASDAQ:AAPL was broke. Steve Jobs had returned but was days away from the company flat-lining for good. Enter Bill Gates.
Microsoft NASDAQ:MSFT wrote Apple a $150 million check, partly to keep antitrust regulators off its back. Jobs even appeared on stage with Gates beaming in on a giant screen like Big Brother — a moment that made every Apple fan cringe.
But that deal saved Apple’s hide. The iMac was born. The iPod followed. Then the iPhone. That $150 million is now a rounding error on Apple’s $3 trillion valuation. Sometimes your greatest rival is also your best frenemy.
🔍 Google: The $750K “Meh”
Before “Google it” became a verb, Larry Page and Sergey Brin tried to sell their little search engine to Excite — the Yahoo-lite portal that dominated the ‘90s web. The price? $750,000.
Excite’s CEO said search “wasn’t that important” — one of the worst calls in tech history. Today, Alphabet NASDAQ:GOOGL is worth over $2.1 trillion and always flashing bright on the Stock Heatmap , and Excite is a footnote in a forgotten Web 1.0 graveyard.
The lesson? Never dismiss a side project just because it doesn’t fit the spreadsheet.
💸 Masayoshi Son’s $200 Billion Slip
SoftBank’s Masayoshi Son is known for his giant, risky bets . And in 2017, he made a pretty good one: his Vision Fund scooped up a 5% chunk of Nvidia stock worth about $4 billion. He called GPUs the backbone of the AI revolution. He was right.
But by 2019, SoftBank was under pressure to tidy up its books. So Son sold the whole position for a tidy short-term profit. That stake today would be worth nearly $200 billion, given Nvidia’s rocket-fuel AI rally .
“We can cry together,” CEO Jensen Huang told Masa Son at an AI Summit in Tokyo last year. Early doesn’t always mean patient. And being “kind of right” can be the most painful lesson of all.
📊 Berkshire Hathaway: A Textile Mill’s Rebirth
Think of Berkshire Hathaway NYSE:BRK.A now — a $1 trillion behemoth. Insurance, utilities, railroads, huge piles of Apple shares . But back when Warren Buffett bought it, Berkshire was a dying textile business in New England.
Buffett only bought control because he was annoyed at the CEO’s lowball tender offer. It turned into his permanent holding company. The textile side eventually went extinct — but the insurance side became the cash-printing machine Buffett used to buy everything else.
Sometimes your best trade starts with pure pettiness.
🚀 Tesla: The Short Sellers’ Pain Cave
Here’s a more recent tale. Tesla was not long ago the most shorted stock on Earth. Everyone from hedge funds to your uncle at Thanksgiving was betting on Elon’s dream to fail.
Every now and then, the short-sellers get slapped with billions of dollars in losses, because the stock shoots up out of nowhere. The most recent example? November 12, when those naysayers nursed $7 billion in wiped out cash . Bears have been torched so many times, they might as well switch sides and sell Tesla hoodies instead.
🌌 Yahoo’s Double Miss: Google and Facebook
If you think blowing one chance is bad, try blowing two. Yahoo turned down the chance to buy Google for less than a million bucks. Then years later, they offered $1 billion for Facebook (now META NASDAQ:META ) — but bungled the negotiations and tried to lower the price. Zuck said “nope.”
But back to Google, because the story didn’t end there. In 2002, Yahoo said it wanted to buy Google for $3 billion. Brin and Page said $5 billion and Yahoo said no. Then Microsoft was ready to pay $40 billion to acquire Yahoo in 2008. But Yahoo said no.
Today, Google, Microsoft, and Meta are trillion-dollar titans. Yahoo? Sold itself for $4.5 billion, mostly for its patents, in 2016 to Verizon. Talk about slipping on the same banana peel more than once.
🧃 Apple: The Splits that Keep Giving
Want a reason to love boring old “buy and hold”? Apple NASDAQ:AAPL has split its stock five times since its 1980 IPO. If you’d bought 100 shares back then, you’d now have over 56,000 shares, plus mountains of dividends.
Next time you want to swing trade every squiggle, remember: sometimes the slowest route is the sweetest.
📝 Regret: The Only Universal Asset Class
Every trader has a “coulda, shoulda, woulda.” It’s the cost of doing business in a market that only makes sense in hindsight. Even the pros — billionaires, boards, hedge funds — have stories that make yours look tame.
Ronald Wayne reminds you that selling too soon can cost you your own island. Masayoshi Son proves being right but impatient is still being wrong. Yahoo shows that “almost” is worth exactly zero on a balance sheet.
What these stories prove is that the market’s biggest edge isn’t necessarily timing, genius, or inside scoops — it’s discipline, resilience, and sometimes a stubborn refusal to touch the sell button.
🤗 Bonus Story: Ballmer Regrets Nothing
But not every story has to be a regret story. Just look at Steve Ballmer, Microsoft ‘s former CEO. Since the early 2000s, he’s been holding his 4% stake in the software maker and that’s now worth more than $130 billion. No regrets found.
👉 What’s Your “One That Got Away”?
Now your turn : What’s your personal what-if story? Which ticker haunts you in your sleep? Drop your best missed trade or worst sell in the comments — we promise to laugh with you, not at you. Probably. Stay sharp. Stay patient!
DXY LONG 03/07/2025Here we have the DXY hitting the resistance of a multi-year confirmed tunnel, while the down trend seems very strong, and can break trough some more to the downside, its a good spot to start picking up some UUP stocks, I belive price will eventually break and hit the 93 price mark, will make a double bottom and run back up inside the channel.
Good luck
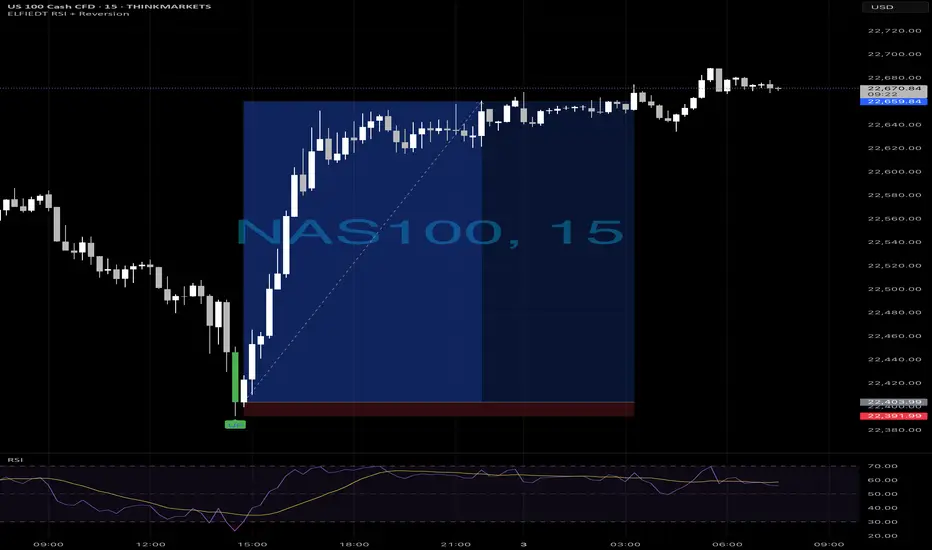
Ustec - longs📈 NAS100 Long Reversal — Powered by ELFIEDT RSI + Reversion Indicator
Timeframe: 15-min
Instrument: NAS100 (US Tech 100)
⸻
✅ Signal Setup (Long Entry)
This clean reversal was captured using my custom ELFIEDT RSI + Reversion indicator, which detects:
• RSI-based exhaustion conditions
• Precise reversal signals (green “UP” label on the chart)
• Trend-aligned confirmations
⸻
📌 Entry Criteria:
1. Oversold RSI conditions signaled potential exhaustion of the downtrend.
2. A clear bullish reversal candle closed with confirmation from the indicator.
3. The “UP” label marked the ideal entry candle just before the impulsive breakout.
4. RSI momentum shifted positively at the point of signal.
⸻
🎯 Execution Plan:
• Entry: At close of the signal candle with the “UP” label
• Stop-Loss: Placed just below the recent swing low (see red zone on chart)
• Target: Up to previous intraday structure and recovery zone
⸻
💡 Key Observations:
• Early signal allowed high RR entry before breakout
• RSI structure confirmed direction shift
• Strong sustained price action into close
⸻
📚 Learn More:
This trade is part of a larger system combining:
• RSI signal dynamics
• Momentum shift detection
• Session and structure alignment
If you’d like more information about the indicator or how to use it in your own strategy, feel free to follow or reach out.
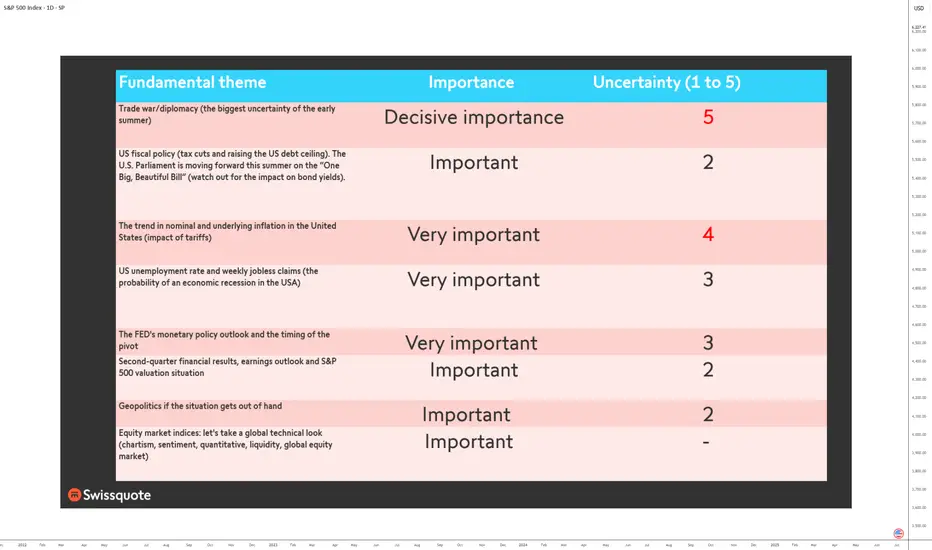
Top fundamentals that will shape the S&P 500 this summer 2025The summer of 2025 is characterized by a combination of macroeconomic and microeconomic factors that will shape the trajectory of the US equity market. While the S&P 500 is trading close to its all-time highs and at a valuation comparable to that at the end of 2021, the strength of the upward momentum will depend on the conjunction of several key variables. Understanding these fundamentals is crucial to grasping the potential and risks awaiting investors over the coming months.
1) The trade war and economic diplomacy, the main source of uncertainty
The trade issue remains the most unpredictable at the start of the summer. The July 9 deadline for the conclusion or failure of tariff negotiations is crystallizing tensions between the United States and its main partners. The prospect of a new wave of tariffs could have a direct impact on production costs, inflation and business confidence. Trade diplomacy is thus the variable most likely to provoke volatility jolts and challenge positive earnings growth expectations. If trade agreements are signed, then this will help to sustain the S&P 500's uptrend.
2) US fiscal policy: the “One Big, Beautiful Bill”
The Trump administration's major tax bill is another hotspot. This piece of legislation calls for an extension of the tax cuts initiated in 2017 and a dramatic increase in the public debt ceiling, to the tune of $5,000 billion. While these measures potentially support consumption and private investment, their medium-term impact on public finances is uncertain. The real issue for the equity market is to assess whether these decisions will lead to a surge in long-term US bond yields. A slippage in US Treasury yields would increase corporate financing costs and undermine currently high valuation multiples. Conversely, if yields remain contained, the equity market's upward momentum could continue.
3) Inflation and the Fed's monetary policy: a delicate balance
The trajectory of inflation, in particular that of the PCE index, will be a major determinant. US inflation is currently slightly below the Fed's target. Several components, notably the services sector, which accounts for almost two-thirds of the PCE basket, are proving relatively stable. Inflationary risks are more likely to come from commodities, particularly if trade tensions reignite. Oil, which accounts for around 11% of the PCE basket, is currently showing no major warning signs, benefiting from a geopolitical calm. Real estate and healthcare are also showing reassuring indicators. Against this backdrop, the Federal Reserve is adopting a cautious stance: while several major Western central banks are moving towards a neutral rate, the Fed is stalling and conditioning its monetary pivot on visibility regarding tariffs and corporate behavior.
The timing of rate cuts is one of the biggest sticking points. According to recent signals, the first rate cut could take place as early as September. However, influential members of the FOMC, appointed by the Trump administration, are arguing for earlier easing. The political pressure is strong: Trump is calling for immediate cuts, but Chairman Powell remains in control of the agenda, taking care to preserve a consensus within the committee.
4) The job market and the likelihood of a recession
The US employment situation is an advanced barometer of the economic cycle. Weekly jobless claims and the aggregate unemployment rate are closely monitored. Historically, a significant rise in unemployment signals that the economic slowdown is already underway. For the time being, the labor market is proving resilient, but the slightest deterioration could alter investors' central scenario and reinforce recessionary expectations. This risk is one of the potential dampeners to the prevailing optimism, unless it were to accelerate the timetable for resuming the cut in the federal funds rate.
5) Second-quarter results and earnings outlook
The second-quarter earnings season is of particular importance. US companies must demonstrate their ability to deliver earnings growth in line with forecasts, even as valuation multiples remain stretched. Maintaining high price levels on the S&P 500 assumes robust earnings growth and confident guidance from management. Failing this, the risk of a correction would be high, especially as the market has already incorporated many positive factors. The weakness of the US dollar and the price of oil, as well as the current momentum in AI, could hold out some pleasant surprises for second-quarter results.
6) Geopolitics and oil, potential sources of volatility
Finally, global geopolitics is a second-order variable, but one that could suddenly become a priority. A rapid deterioration in the international situation, particularly in the Middle East or the China Sea, could affect trade flows and oil prices, fuelling renewed inflation and financial volatility.
Conclusion :
The summer of 2025 promises to be a period of strategic transition for the US equity market. Between trade diplomacy, fiscal policy, inflation, the trajectory of interest rates and earnings momentum, investors will have to deal with an accumulation of uncertain factors. If these uncertainties gradually dissipate, the uptrend could continue. Conversely, the combination of a geopolitical shock, a rebound in inflation and a political stalemate over the federal budget would have the potential to weaken the current rally.
DISCLAIMER:
This content is intended for individuals who are familiar with financial markets and instruments and is for information purposes only. The presented idea (including market commentary, market data and observations) is not a work product of any research department of Swissquote or its affiliates. This material is intended to highlight market action and does not constitute investment, legal or tax advice. If you are a retail investor or lack experience in trading complex financial products, it is advisable to seek professional advice from licensed advisor before making any financial decisions.
This content is not intended to manipulate the market or encourage any specific financial behavior.
Swissquote makes no representation or warranty as to the quality, completeness, accuracy, comprehensiveness or non-infringement of such content. The views expressed are those of the consultant and are provided for educational purposes only. Any information provided relating to a product or market should not be construed as recommending an investment strategy or transaction. Past performance is not a guarantee of future results.
Swissquote and its employees and representatives shall in no event be held liable for any damages or losses arising directly or indirectly from decisions made on the basis of this content.
The use of any third-party brands or trademarks is for information only and does not imply endorsement by Swissquote, or that the trademark owner has authorised Swissquote to promote its products or services.
Swissquote is the marketing brand for the activities of Swissquote Bank Ltd (Switzerland) regulated by FINMA, Swissquote Capital Markets Limited regulated by CySEC (Cyprus), Swissquote Bank Europe SA (Luxembourg) regulated by the CSSF, Swissquote Ltd (UK) regulated by the FCA, Swissquote Financial Services (Malta) Ltd regulated by the Malta Financial Services Authority, Swissquote MEA Ltd. (UAE) regulated by the Dubai Financial Services Authority, Swissquote Pte Ltd (Singapore) regulated by the Monetary Authority of Singapore, Swissquote Asia Limited (Hong Kong) licensed by the Hong Kong Securities and Futures Commission (SFC) and Swissquote South Africa (Pty) Ltd supervised by the FSCA.
Products and services of Swissquote are only intended for those permitted to receive them under local law.
All investments carry a degree of risk. The risk of loss in trading or holding financial instruments can be substantial. The value of financial instruments, including but not limited to stocks, bonds, cryptocurrencies, and other assets, can fluctuate both upwards and downwards. There is a significant risk of financial loss when buying, selling, holding, staking, or investing in these instruments. SQBE makes no recommendations regarding any specific investment, transaction, or the use of any particular investment strategy.
CFDs are complex instruments and come with a high risk of losing money rapidly due to leverage. The vast majority of retail client accounts suffer capital losses when trading in CFDs. You should consider whether you understand how CFDs work and whether you can afford to take the high risk of losing your money.
Digital Assets are unregulated in most countries and consumer protection rules may not apply. As highly volatile speculative investments, Digital Assets are not suitable for investors without a high-risk tolerance. Make sure you understand each Digital Asset before you trade.
Cryptocurrencies are not considered legal tender in some jurisdictions and are subject to regulatory uncertainties.
The use of Internet-based systems can involve high risks, including, but not limited to, fraud, cyber-attacks, network and communication failures, as well as identity theft and phishing attacks related to crypto-assets.
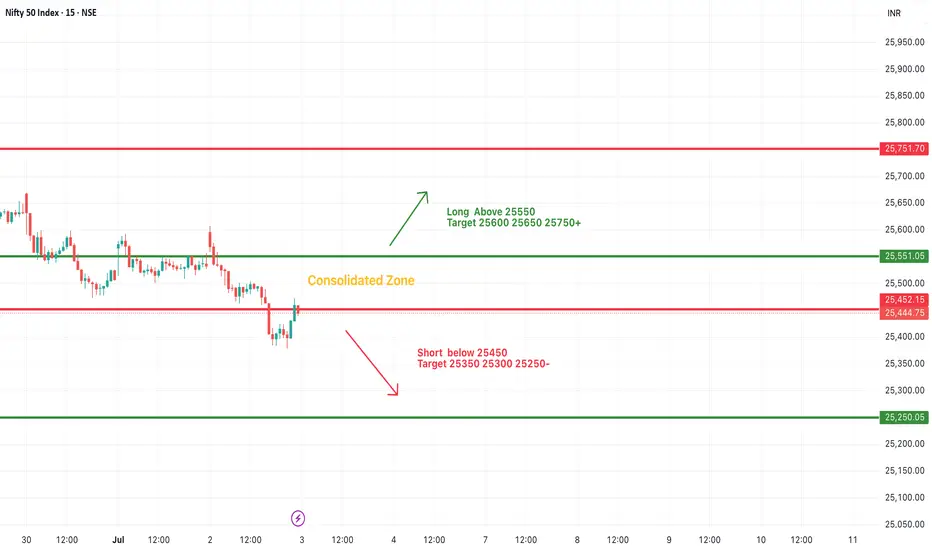
#NIFTY Intraday Support and Resistance Levels - 03/07/2025Nifty is expected to open flat near the 25,450 level, continuing to trade within a consolidation zone. The market has recently shown signs of indecisiveness, with price movement confined between 25,550 resistance and 25,250 support. Until a clear breakout or breakdown occurs, price action may remain range-bound.
If Nifty sustains above the 25,550 level, it can trigger fresh momentum toward 25,600, 25,650, and even 25,750+. On the downside, if it breaks and trades below 25,450, we may see selling pressure accelerating toward 25,350, 25,300, and 25,250.
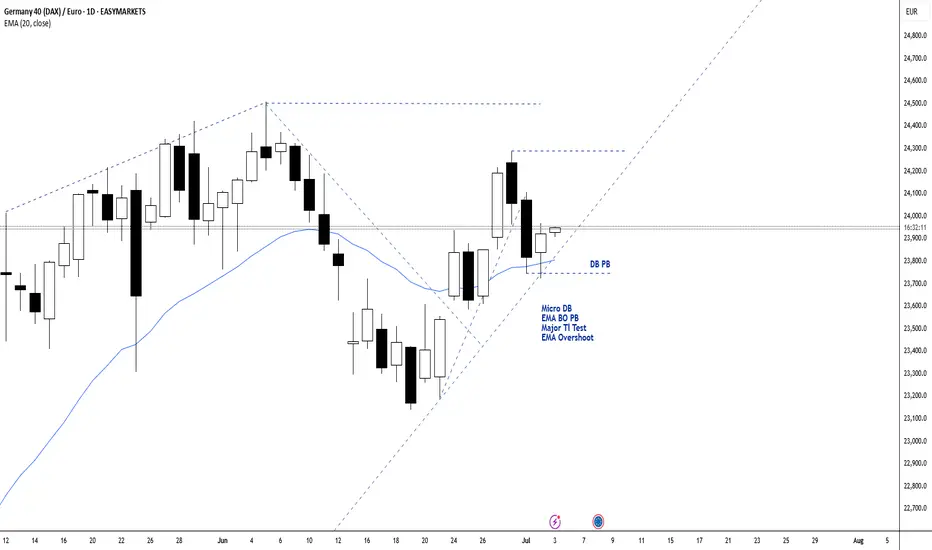
Long ScalpLong Scalp on DAXEUR.
Reasons to take the trade:
1. Major Bull Trendline test
2. Micro Double Bottom Pullback
3. Bullish Doji with long lower tail
4. Breakout Pullback to the EMA with double overshoot
5. It's an almost perfect 50% retracement of the last bull leg (that has a small one candle bear leg in the middle).
Reasons to Passe on it:
1. The last bear candle is bigger than I wanted, so this might be the first bear leg of the new trend.
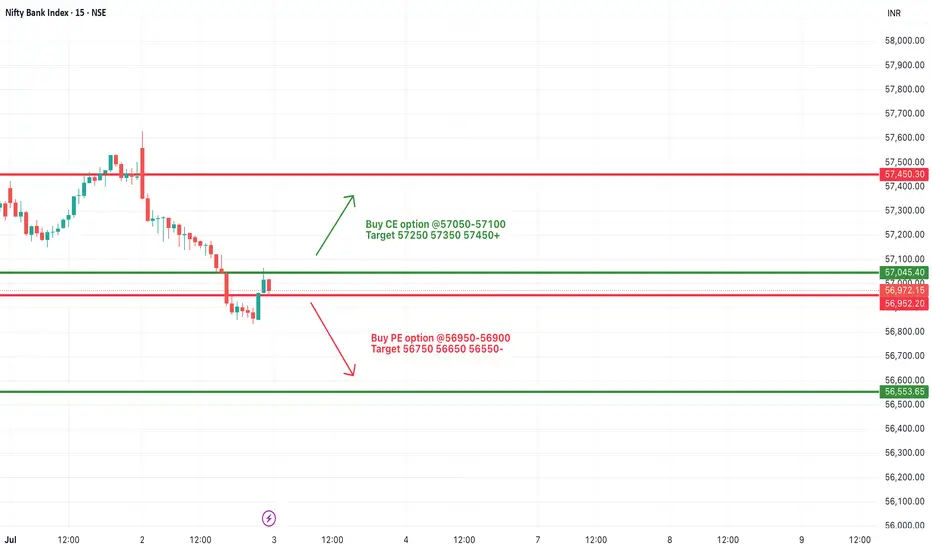
[INTRADAY] #BANKNIFTY PE & CE Levels(03/07/2025)Bank Nifty is expected to open flat near the 56,970 level. After a strong downward move in the previous session, prices are attempting to recover from the 56,950 support zone. This level may act as an immediate base in early trading hours.
If Bank Nifty sustains above 57,000–57,045 levels, we may see a short covering rally toward 57,250–57,450. However, any rejection near 57,000 can again drag the index toward 56,750 and 56,550. Since the price is opening near a key decision zone, it's advised to wait for directional confirmation before entering any trade.
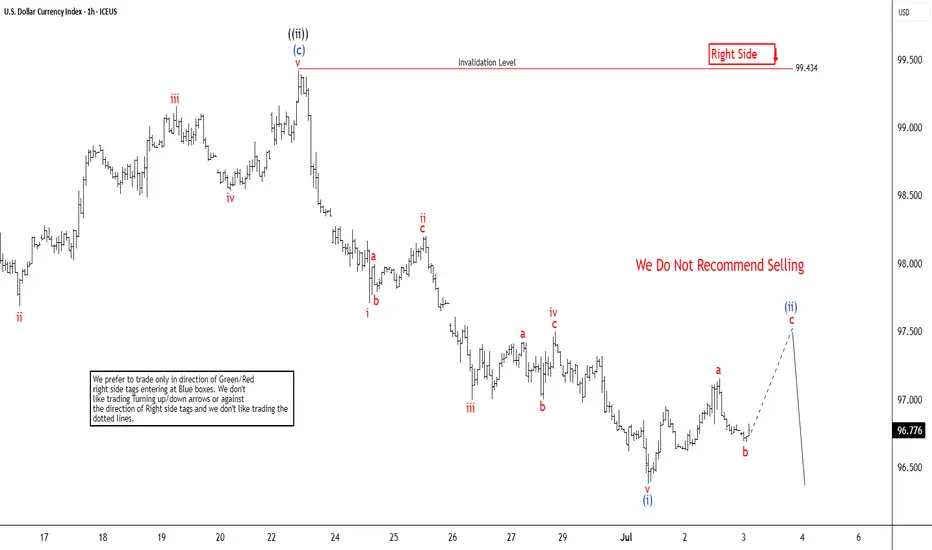
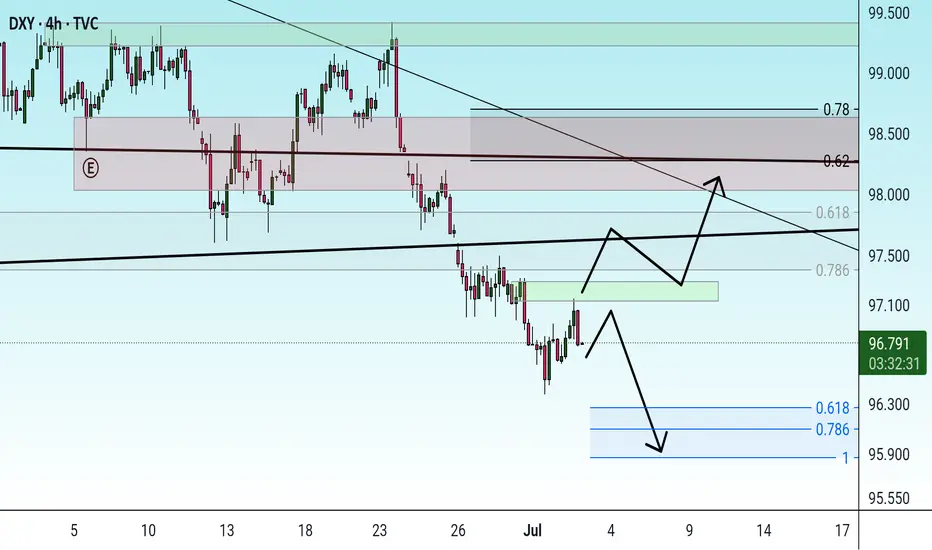
Dollar Index (DXY) Bearish Trend IntactThe Dollar Index (DXY) cycle, originating from its September 2022 peak, remains incomplete and exhibits a bearish outlook, signaling potential for further declines. The descent from the May 29, 2025 high is currently unfolding as a five-wave impulse pattern. From this high, wave ((i)) concluded at 98.35, followed by a corrective rally in wave ((ii)). The rally formed as an expanded flat, peaking at 99.43 as depicted on the one-hour chart below.
Subsequently, the Index extended lower, forming a nested structure. Within this decline from wave ((ii)), wave i bottomed at 97.7, with a corrective wave ii rally reaching 98.2. Wave iii then drove the Index lower to 97, followed by wave iv peaking at 97.49. The final leg, wave v, completed at 96.37, marking the end of wave (i). Currently, a corrective rally in wave (ii) is underway, aiming to retrace the decline from the June 23, 2025 peak. This rally appears to be unfolding as a zigzag pattern, with wave a concluding at 97.15 and wave b dipping to 96.69. Wave c is expected to target the 100%–161.8% Fibonacci extension of wave a, projecting a range of 97.45–97.9.
Should the Index reach this zone, it may encounter selling pressure, potentially leading to further downside or a three-wave pullback. As long as the pivot high at 99.4 remains intact, any rally is likely to falter in a 3, 7, or 11-swing structure, reinforcing the bearish bias for additional declines.
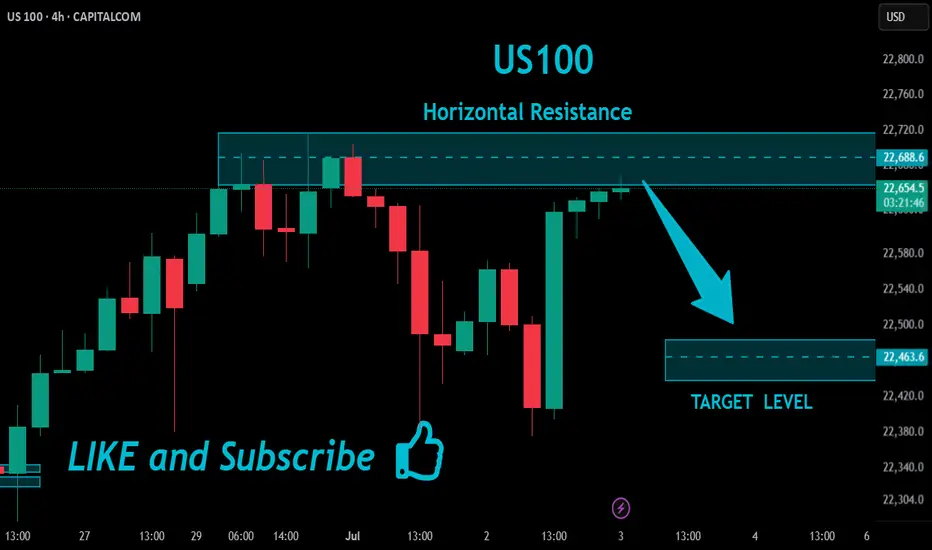
US100 Will Go Down!
HI,Traders !
#US100 made a retest
Of the wide horizontal
Resistance around 22688.6
And we are already seeing a
Local bearish reaction so
We will be expecting a
Further bearish move down !
Comment and subscribe to help us grow !
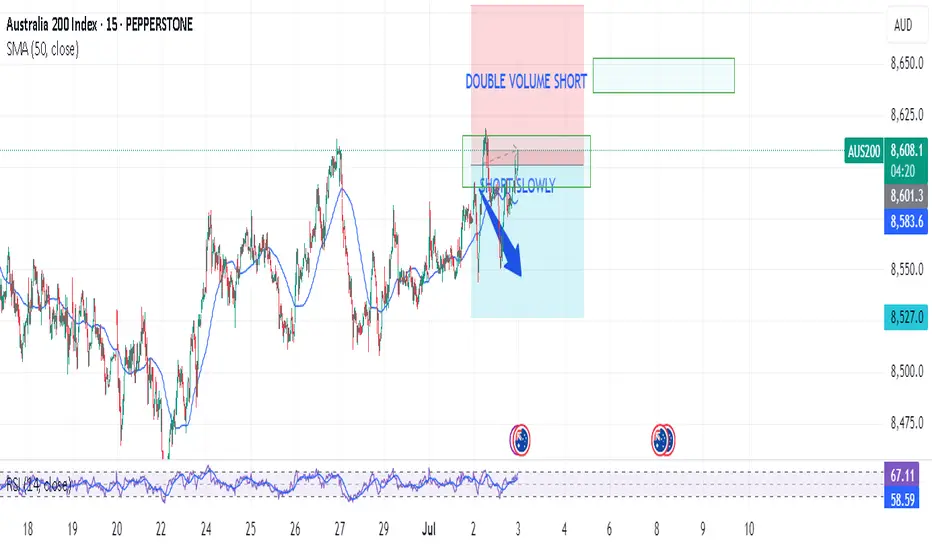
UK100/FTSE100Team,
SHORT UK100/FTSE100 slowly at 8796-8826
TARGET at 8772-8746 ranges
DOUBLE UP at 8846-66 - target at 8802-12

AUS200/ASX200 - LETS MAKE MILLIONYesterday, we hope you all enjoyed SHORT UK100 AND AUS200, we did it twice in our channel
Today we are reshorting AUS200 at 8600-8226 ranges
Target at 8572-8561
Yesterday, while doing REAL LIVE TRADING every day, we killed the NAS AND DOW on a long trade.
Bring us 6 out of 6 trades successful for the day.
USD weaknening is coming to an end?DXY is soon reaching a 1:1 second leg down (measured at 95.678).
Similarly, EURUSD is reaching a 1:1 since the Sept 1 (2022) low (measured at 1.2046).
Nasdaq shortI think it is time to take the lows on the lower time frame.
Time for a small reversal.
1min entry and bos .
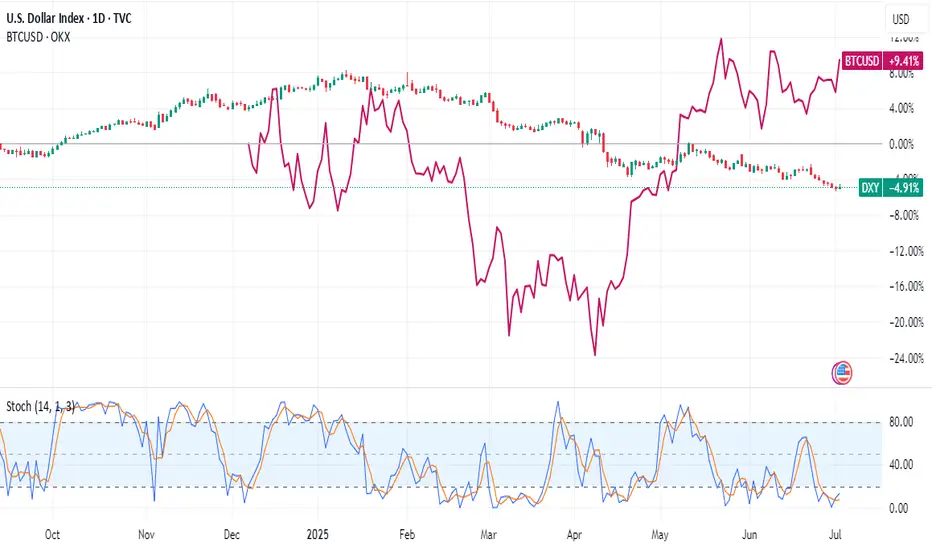
A Dollar in Freefall and a Bitcoin on the Brink
In the grand theater of global finance, narratives rarely align with perfect symmetry. The market is a complex ecosystem of competing forces, a cacophony of signals where long-term tectonic shifts can be momentarily drowned out by the piercing alarms of short-term volatility. Today, we stand at the precipice of one of the most profound and fascinating divergences in modern financial history, a story of two assets locked in an inverse dance, each telling a radically different tale about the immediate future.
On one side of this chasm stands the titan of the old world, the U.S. Dollar. The bedrock of global commerce, the world’s undisputed reserve currency for nearly a century, is in a state of unprecedented crisis. The U.S. Dollar Index (DXY), the globally recognized measure of the greenback’s strength against a basket of other major currencies, is in freefall. It is suffering its most catastrophic crash since 1991, and by some measures, is enduring its worst year since the historic turmoil of 1973. This is not a minor correction; it is a fundamental challenge to the dollar’s hegemony, a macro-level event driven by seismic shifts in U.S. economic policy, including aggressive trade tariffs and ballooning government deficits. For the world of alternative assets, a collapsing dollar is the loudest possible bullhorn, a clarion call to seek refuge in stores of value that lie beyond the reach of any single government.
On the other side of the chasm is the digital challenger, Bitcoin. Born from the ashes of the 2008 financial crisis as an answer to the very monetary debasement the dollar is now experiencing, Bitcoin should, by all fundamental logic, be soaring. The dollar’s demise is the very thesis upon which Bitcoin’s value proposition is built. And yet, while the long-term case has never looked stronger, the short-term picture is fraught with peril. A close reading of its technical chart reveals a market showing signs of exhaustion. A key momentum indicator, the stochastic oscillator, is flashing a stark warning, suggesting that the digital asset, far from rocketing to new highs, could be on the verge of a significant drop, a painful correction that could pull its price back below the psychological threshold of $100,000.
This is the great divergence. The macro-economic landscape is screaming for a flight to safety into hard assets like Bitcoin, while the micro-level technicals of Bitcoin itself are suggesting an imminent storm. It is a battle between the long-term fundamental signal and the short-term technical noise, a dilemma that forces every market participant to ask themselves a critical question: In a world where the old rules are breaking down, do you trust the map or the compass?
Chapter 1: The Fall of a Titan - Deconstructing the Dollar's Demise
To understand the magnitude of Bitcoin’s long-term promise, one must first dissect the anatomy of the dollar’s current collapse. The U.S. Dollar Index, or DXY, is not merely a measure of the dollar against a single currency; it is a weighted average of its value relative to a basket of six major world currencies: the Euro, the Japanese Yen, the British Pound, the Canadian Dollar, the Swedish Krona, and the Swiss Franc. Its movement is a reflection of global confidence in the U.S. economy and its stewardship. For this index to suffer its worst crash since 1991 is a historic event. To be on pace for its worst year since 1973 is a paradigm-shifting crisis.
The year 1973 is not a random benchmark. It was the year the Bretton Woods system, which had pegged global currencies to the U.S. dollar (which was in turn pegged to gold), officially died. Its collapse ushered in the modern era of free-floating fiat currencies. For the dollar’s current performance to be compared to that chaotic, system-altering period is to say that the very foundations of the post-1973 monetary order are being shaken.
The catalysts for this historic weakness are rooted in a dramatic shift in American economic policy, largely attributed to the actions of President Donald Trump’s administration. The two primary drivers are a protectionist trade policy and a fiscal policy of burgeoning deficits.
First, the tariffs. The implementation of broad tariffs on imported goods was intended to protect domestic industries and renegotiate trade relationships. However, such measures are a double-edged sword for a nation's currency. They create friction in the intricate web of global supply chains, increase costs for consumers and businesses, and often invite retaliatory tariffs from trading partners. This environment of trade conflict creates economic uncertainty, which can deter foreign investment. When international capital becomes wary of deploying in a country, demand for that country’s currency wanes, putting downward pressure on its value.
Second, and perhaps more fundamentally, are the rising deficits. The U.S. government has been running massive budget deficits, spending far more than it collects in revenue. This debt must be financed. When a country runs a large budget deficit alongside a large current account deficit (importing more than it exports), it becomes heavily reliant on foreign capital to purchase its government bonds. If the world’s appetite for that debt falters, or if the sheer volume of new debt issuance becomes too large to absorb, the nation’s central bank may be implicitly forced to monetize the debt—effectively printing new money to buy the bonds. This expansion of the money supply is the classic recipe for currency debasement.
The combination of trade protectionism and fiscal profligacy has created a perfect storm for the dollar. Global investors, looking at the rising deficits and the unpredictable trade environment, are beginning to question the long-term stability of the dollar as a store of value. This erosion of confidence is what is reflected in the DXY’s historic plunge. A weaker dollar makes U.S. exports cheaper and imports more expensive, but its most profound effect is on the global investment landscape. It forces a worldwide repricing of assets and sends a tidal wave of capital searching for alternatives that can preserve wealth in an era of fiat decay.
Chapter 2: The Digital Phoenix - Bitcoin's Long-Term Bull Case
In the world of finance, every action has an equal and opposite reaction. As the value of the world's primary reserve asset erodes, the value of its antithesis should, in theory, appreciate. Bitcoin is the dollar’s antithesis. Where the dollar’s supply is infinite and subject to the political whims of policymakers, Bitcoin’s supply is finite, transparent, and governed by immutable code. There will only ever be 21 million Bitcoin. This fundamental, mathematically enforced scarcity is the core of its value proposition.
The inverse correlation between the DXY and Bitcoin is one of the most powerful and intuitive relationships in the digital asset space. When the DXY falls, it signifies that the dollar is losing purchasing power relative to other major currencies. For investors around the globe, this means that holding dollars is a losing proposition. They begin to seek out assets that are not denominated in dollars and cannot be debased by the U.S. Federal Reserve. Bitcoin stands as the prime candidate for this capital flight. It is a non-sovereign, globally accessible, digital store of value that operates outside the traditional financial system. A falling dollar is therefore the strongest possible tailwind for Bitcoin, validating its very reason for existence.
This relationship transcends simple price mechanics; it is a philosophical and macroeconomic hedge. Owning Bitcoin is a bet against the long-term viability of the current debt-based fiat monetary system. The dollar’s crash, driven by deficits and monetary expansion, is not a flaw in the system; it is a feature of it. Bitcoin offers an escape hatch. It is a lifeboat for investors who see the iceberg of sovereign debt on the horizon.
This narrative is what has fueled the wave of institutional adoption that has defined the current market cycle. Sophisticated investors and corporations are not allocating to Bitcoin because they are speculating on short-term price movements. They are buying it as a long-term strategic reserve asset, a hedge against the very macroeconomic turmoil that the dollar’s crash represents. They see a world drowning in debt and a global reserve currency being actively devalued, and they are making a calculated, multi-generational bet on a system of verifiable digital scarcity. From this perspective, the long-term bull case for Bitcoin has never been clearer or more compelling. The dollar’s historic weakness is the ultimate validation of the Bitcoin thesis.
Chapter 3: The Ghost in the Machine - Bitcoin's Short-Term Technical Warning
If the story ended with the macro-economic picture, the path forward would be simple. But markets are not simple. They are a reflection of human psychology, a tapestry of fear and greed woven in real-time. While the fundamental, long-term story points resolutely upward, the short-term evidence, as read through the language of technical analysis, is painting a much darker picture.
Technical analysis operates on the principle that all known information, including the bullish macro fundamentals, is already reflected in an asset's price. It seeks to identify patterns and gauge market momentum to predict future movements. One of the most trusted tools for measuring momentum is the stochastic oscillator. It does not measure price or volume itself, but rather the speed and momentum of price changes. Think of it like a car's tachometer: it tells you not how fast you are going, but how hard the engine is working to maintain that speed.
The stochastic oscillator operates on a scale of 0 to 100. A reading above 80 is considered "overbought," suggesting the asset has moved up too quickly and the rally may be running out of steam. A reading below 20 is considered "oversold," suggesting a decline may be exhausted. The current technical analysis of Bitcoin’s chart reveals a deeply concerning signal from this indicator.
Despite the overwhelmingly bullish news of the dollar’s collapse, Bitcoin’s price momentum is reportedly waning. The stochastic oscillator is likely showing what is known as a "bearish divergence." This occurs when the price of an asset pushes to a new high, but the oscillator fails to do so, creating a lower high. This is a classic warning sign. It’s the market’s equivalent of a car’s engine sputtering and revving less intensely even as the driver pushes the accelerator to the floor. It suggests that the underlying buying pressure is weakening, that the rally is becoming exhausted, and that a reversal or significant correction may be imminent.
The technical forecast of a potential drop below the $100,000 level stems directly from this type of signal. It implies that the recent price strength is not supported by genuine momentum and that the market is vulnerable. Why would this happen when the fundamental news is so positive? There are several possibilities. Short-term traders who bought at lower prices may be taking profits. The market may be flushing out over-leveraged long positions, triggering a cascade of liquidations. Or, it could simply be the natural rhythm of a market. No asset moves up in a straight line. Even the most powerful bull trends require periods of consolidation and correction to shake out weak hands, build a stronger base of support, and gather energy for the next major advance. A pullback to below $100,000, while painful for those who bought at the top, could be a perfectly healthy and necessary event in the context of a much larger, multi-year bull market.
Chapter 4: Reconciling the Irreconcilable - The Investor's Dilemma
This great divergence presents every market participant with a profound dilemma, forcing a clear-eyed assessment of their own investment philosophy and time horizon. The market is speaking in two different languages simultaneously, and the message you hear depends on the language you choose to listen to.
For the long-term investor, the individual or institution with a five, ten, or twenty-year outlook, the story is clear. The historic crash of the U.S. dollar is the signal. It is the fundamental, world-altering event that confirms their thesis. The debasement of the world’s reserve currency is a generational opportunity to allocate capital to a superior, non-sovereign store of value. From this vantage point, the bearish reading on a short-term stochastic oscillator is, at best, irrelevant noise. It is the momentary turbulence felt on a flight destined for a much higher altitude. The strategy for this investor is one of conviction. They may choose to ignore the short-term dip entirely, or more likely, view it as a gift—a final opportunity to accumulate more of a scarce asset at a discount before the full force of the dollar’s crisis is felt in the market. Their actions are guided by the macro map, not the short-term compass.
For the short-term trader, the world looks entirely different. Their time horizon is measured in days, weeks, or months, not years. For them, the bearish divergence on the stochastic oscillator is the signal. The macro story of the dollar’s decline is merely the background context. Their primary concern is managing risk and capitalizing on immediate price swings. A warning of a potential drop below $100,000 is an actionable piece of intelligence. It might prompt them to take profits on existing long positions, hedge their portfolio with derivatives, or even initiate a short position to profit from the anticipated decline. Their survival depends on their ability to react to the compass of market momentum, regardless of the map’s ultimate destination.
The most sophisticated market participants, however, attempt to synthesize these two perspectives. They recognize that the long-term macro trend provides the overarching directional bias, while the short-term technicals provide the tactical roadmap for navigating that trend. Such an investor would maintain a core long position in Bitcoin, acknowledging the powerful tailwind of the dollar’s collapse. However, they would use the technical signals to actively manage their position and optimize their entries and exits. They might trim their position when the stochastic indicator signals overbought conditions, taking some profit off the table to reduce risk. They would then stand ready to redeploy that capital and add to their core holding when the technicals signal oversold conditions after the very correction they anticipated. This approach allows them to maintain their long-term conviction while respecting the short-term risks, blending the art of the trader with the discipline of the investor.
Conclusion: The Signal and the Noise
The financial markets are standing at a historic crossroads. The U.S. dollar, the sun around which the global monetary system has orbited for generations, is dimming. Its historic crash is a signal of the highest order, a fundamental warning that the era of unchallenged fiat dominance is facing its most serious test. This decay is creating a powerful gravitational pull toward assets defined by scarcity and sovereignty, with Bitcoin as the undisputed digital leader. This is the signal.
Simultaneously, the internal mechanics of the Bitcoin market are showing signs of short-term fatigue. The warnings from technical indicators like the stochastic oscillator are a reminder that no market is immune to the laws of gravity, that periods of profit-taking and consolidation are a natural and healthy part of any long-term advance. This is the noise.
The great challenge, and the great opportunity, for every investor today is to learn to distinguish between the two. The collapse of the dollar is a paradigm shift, while the potential drop in Bitcoin’s price is a cyclical correction. The former defines the destination; the latter describes the terrain along the way. The current divergence is a test of thesis, of timeframe, and of temperament. Those who are shaken out by the short-term noise will likely miss the long-term signal. But those who understand that the dollar’s fall is the very reason for Bitcoin’s rise, and who have the conviction to see the short-term turbulence for what it is, will be best positioned to navigate this great divergence and witness the dawn of a new financial landscape.
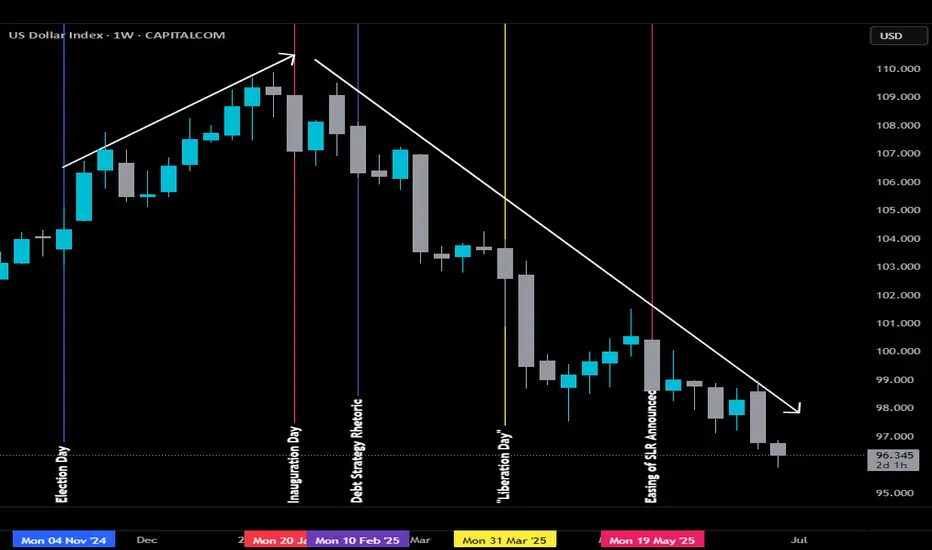
The Bessent Effect Explained: Weaken the Dollar The Bessent Effect Explained: Weaken the Dollar
There’s no coincidence that the U.S. dollar has had its worst first half of the year since the dawn of free-floating currencies in the 1970s. And if anyone knows how currencies tick — or unravel — it’s Scott Bessent, the man who once stood behind George Soros during the legendary short of the British pound in 1992. Now, three decades later, Bessent sits at the helm of the most powerful economy in the world, steering the U.S. Treasury through a historic moment: where America is trying to boost exports, undercut foreign currency manipulation, and lighten the crushing weight of debt — all while keeping inflation from boiling over.
Of course, no Treasury Secretary will ever say “we want a weaker dollar”, but if one wanted to do it strategically, they'd need to be part economist, part hedge fund manager and part illusionist.
Enter: The Bessent Effect.
📊 Charting the Decline
• After Election Day (BLUE LINE), the DXY marched upward, peaking near 109 — a reflection of market optimism or a dash of geopolitical anxiety.
• By Inauguration Day (REDLINE), that trend began to unwind. Investors started to squint at the fiscal roadmap and didn't love what they saw.
________________________________________
Debt Strategy Rhetoric: PURPLE LINE
In early February, Treasury Secretary Scott Bessent addressed the U.S. debt issuance strategy. While he openly criticized his predecessor’s reliance on short-term debt, his first major move was paradoxical: he continued that very approach, opting to maintain a heavy focus on short-term issuance while holding off on extending maturities. This subtle decision screamed one thing for markets: rollover risk. What if rates stay high? What if inflation persists? What if buyers disappear?
Result? The dollar started sliding faster.
________________________________________
Liberation Day: YELLOW LINE
On April 2, “Liberation Day” tariffs were announced. Potential retaliation from China and Mexico, and now you've got cross-border chaos. Trade wars spook global markets, slash demand for U.S. assets, and drive capital into gold and foreign currencies. The dollar’s dominance doesn’t vanish overnight — but the cracks begin to show.
________________________________________
Easing of SLR Announced: PINK LINE
On May 23, just when the DXY needed a break, Bessent went on Bloomberg and said, “We are very close to moving” on the Supplementary Leverage Ratio (SLR). Translation? Banks may soon face eased capital rules, making it easier for them to buy Treasuries.
Markets took it as regulatory backdoor stimulus — a shadowy workaround to support Treasury demand without triggering money printers. But it also raised fears about systemic risk, inflation, and policy overreach. The DXY barely blinked before continuing its methodical march lower.
________________________________________
But What If...
What if Bessent’s moves aren’t missteps, but part of a calculated devaluation strategy? A weaker dollar makes U.S. exports more competitive, revives domestic manufacturing, and reshapes global trade dynamics. By subtly bending the rules (instead of breaking them), Bessent may be re-engineering the dollar's role—less as a global anchor, more as a tool for national advantage. By easing the SLR, he may have discovered a subtle way to bring down the long end of the yield curve.
If it’s not currency destruction. Maybe it’s precision macro strategy?
________________________________________
What’s Next?
Sure, the DXY might bounce a little — even bad news needs a break. But what could drive it even lower?
How about the loss of Federal Reserve independence?
Luckily, that’d only happen if there were whispers of a “shadow Fed chair” waiting in the wings. But that’s just conspiracy talk... right?
Follow on X: @TheAlphaView
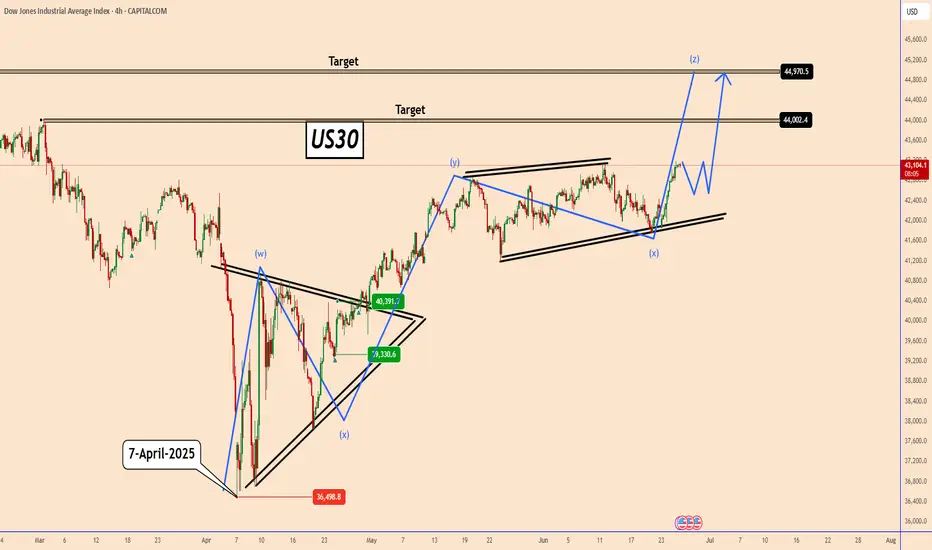
US30: The bullish trend remains in progressUS30: The bullish trend remains in progress
On April 7, 2025, US30 hit its lowest point at approximately 36500. Since then, despite significant concerns regarding Trump's tariffs and the ongoing turmoil in the Middle East, all indices have been on the rise.
Overall the U.S. indicators are showing robust performance.
In a worst-case scenario, we might observe US30 to make a minor correction close to 42500 before it bounces further, potentially retesting the chart level that aligns with its all-time high price as well.
Key target levels: 44000 and 44970
You may find more details in the chart!
Thank you and Good Luck!
❤️PS: Please support with a like or comment if you find this analysis useful for your trading day❤️
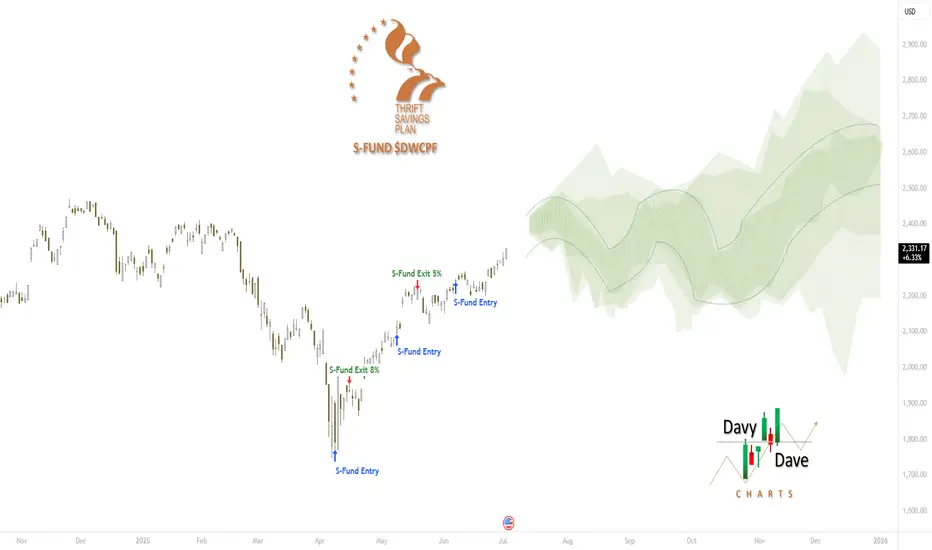
Thrift Savings Plan (TSP) S-Fund $DWCPF projections:past performance does not guarantee future performance, however, it can help guide us with the seasonality model. The trajectory is based on price action between July 19th - end of Q4, for the past decade.
Possibility of correction Given the behavior of the indicator within the current resistance range, possible scenarios have been identified. If the resistance range is broken, an upward and fluctuating trend to the red resistance range is likely.
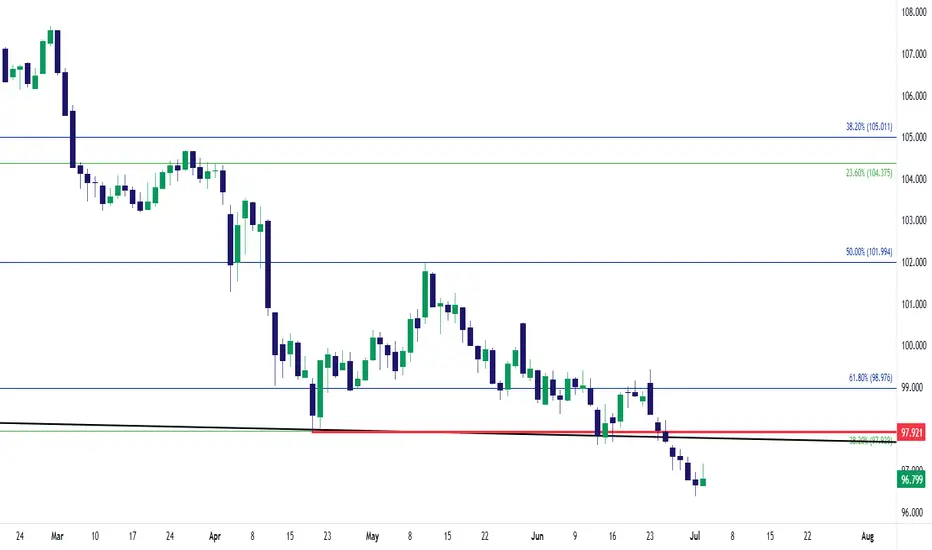
USD Tries to Break the Tide at NFPIt's been a painful week and a half for the USD.
Around the June FOMC meeting a hopeful bounce had built as the Fed sounded a bit less-dovish. While inflation remains below their expectations the labor market had held up relatively well, and with the threat of possible inflation from tariffs they didn't seem to be in any hurry to cut rates.
But then last week opened with Michelle Bowman saying she supported a rate cut as early as July, and DXY put in a bearish engulfing pattern. And then into the end of Q2 it was constant bleeding as the currency continued to trip down to fresh three-year lows.
Interestingly, the shocking miss on ADP data this morning illustrates weakness in the labor market, yet the USD is currently showing its first green day since last week's open.
This is likely more due to just how oversold the currency has become but it sets the stage for NFP tomorrow. While that data point is a major driver, it's supply and demand, which is denominated by positioning, that pushes prices. For tomorrow the interest is in a better-than-expected NFP print bringing a short-term squeeze in the USD, after which markets will get a look to see just how aggressive bears remain to be. The big area of interest for this is the prior swing low, at the 97.91 level, which set support in April and then held the lows in June, until the late-month breakdown move.
To date that spot still hasn't been tested for resistance and if sellers do get a chance to offer at that level, we get to see how aggressive they remain to be. - js