Potential outside week and bullish potential for CDTEntry conditions:
(i) higher share price for ASX:CDT above the level of the potential outside week noted on 5th September (i.e.: above the level of $0.078).
Stop loss for the trade would be:
(i) below the low of the outside week on 2nd September (i.e.: below $0.063), should the trade activate.

High-Risk, High-Reward Setup at Critical Confluence ZoneSTP is offering a compelling—but extremely high-risk—opportunity. As a nanocap stock with no confirmed uptrend, risk management must be the top priority.
Price has retraced into a major Fair Value Gap (FVG) from August 2023, and notably, the August 2025 candle printed a strong demand wick on elevated volume. This zone aligns with:
The 200% Fibonacci extension from the double top at 1.940
The 50% extension from the 1.900 swing high to the April 25 low
A 74-week decline from the 1.950 high, marking a significant Gann time support—a detail seasoned time-cycle traders will appreciate
This confluence suggests a structurally significant support zone where price may be preparing for a reversal.
Trade Scenarios
Option 1: Wait for a Wick Retest Price may revisit the demand wick/yearly s2 pivot, offering a more refined entry with improved risk-to-reward. Look for a strong daily or weekly bullish candle off the retest, with the stop-loss placed just below the wick.
Option 2: Enter Now with Wick as Anchor Aggressive entry at current levels, using the base of the large demand wick as your stop-loss. This approach allows price to develop organically while maintaining a defined risk profile and if there is a retest of the wick then could add more to the position (must be in line with your risk appetite) but just food for some thought.
Option 3: Liquidity Sweep & Reversal Price could sweep the lows of the demand structure, triggering stop-losses and trapping late shorts. A sharp reversal from this move would confirm a classic liquidity grab—ideal for reactive entries once momentum shifts.
This setup is rich with technical nuance and timing precision. Whether you're trading the wick, the sweep, or the structure itself, the key is disciplined execution and respect for volatility.

WHC is buying time? WHC seems reached strong support after big drops from downward trend,
it breaks out from descending tunnel.
Hopefully, it is going to be upward trend. Finders crossed! ^&^
I have entered the trade.
Target $6.

High R/R Opportunity from Key ZonesPrice has recently rallied into a key supply zone, so a reaction or rejection from this level is expected. While the projected path favors continuation, it's crucial to monitor the $0.320 support area. If we see a strong weekly bullish hammer-style candle with a solid close into this zone, that would trigger a long entry.
If price fails to hold $0.320, attention shifts to the $0.290–$0.270 range, which should act as a deeper support zone. From either level, the upside target remains $0.430, offering a compelling risk-to-reward profile for a staggered entry strategy.

Three Paths for VEEM: Pullback, Breakout, or BreakdownScenario 1 (yellow line): Strategic Pullback to Value Zone
Price retraces to the ~$0.67 region, aligning with a Low Volume Node (LVN) and the Fair Value Gap from the June candle. A bullish reversal candle in this zone would signal a high-probability long setup, suggesting accumulation at a key structural level.
Scenario 2 (green line): Breakout & Reaccumulation Above Resistance
The most bullish scenario unfolds if price decisively breaks and closes above the major resistance at $1.50. A successful reaccumulation above this level would confirm strength, offering a textbook pullback entry for continuation higher.
Scenario 3: (red line) Rejection & Macro Lower High
Price pulls back but fails to hold above the ~$1.16 zone, facing rejection. A subsequent break of the recent lows would confirm a macro lower high (LH), shifting the bias toward bearish continuation and invalidating bullish setups.

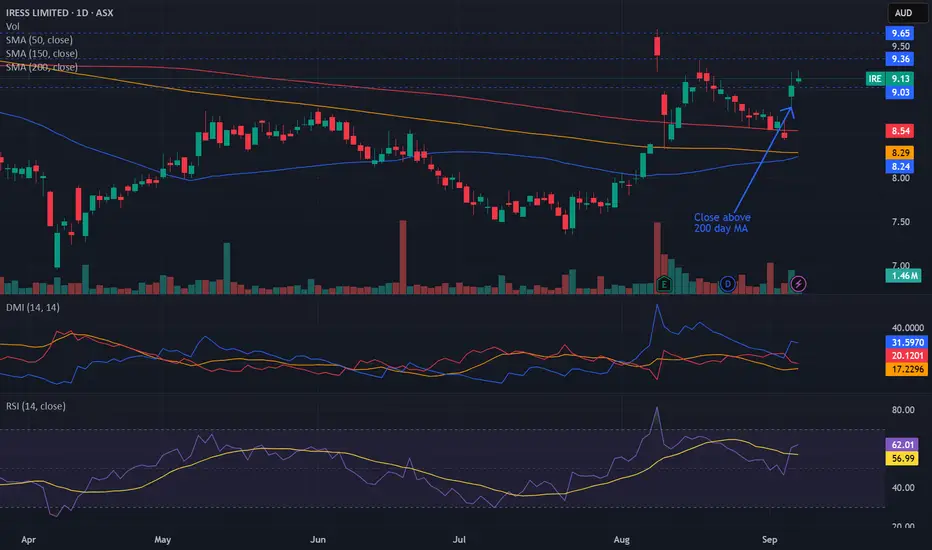
Bullish potential detected for IREEntry conditions:
(i) higher share price for ASX:IRE along with swing up of indicators such as DMI/RSI.
Depending on risk tolerance, the stop loss for the trade would be:
(i) below the low of the recent gap-up (4th September) of $8.80, or
(ii) below previous potential support of $8.63 from the open of 13th May.
Bearish potential detected for BENEntry conditions:
(i) lower share price for ASX:BEN along with swing of DMI indicator towards bearishness and RSI downwards, and
(ii) observing market reaction around the share price of $12.44 (open of 23rd June).
Depending on risk tolerance, the stop loss for the trade would be:
(i) above the potential prior resistance of $12.84 from the open of 11th June, or
(ii) above the potential prior resistance of $12.90 from the open of 11th July, or
(iii) above the declining 10 day moving average (currently $13.02), or
(iv) above the low of the range of day prior to the gap-down (1st September) of $13.10.

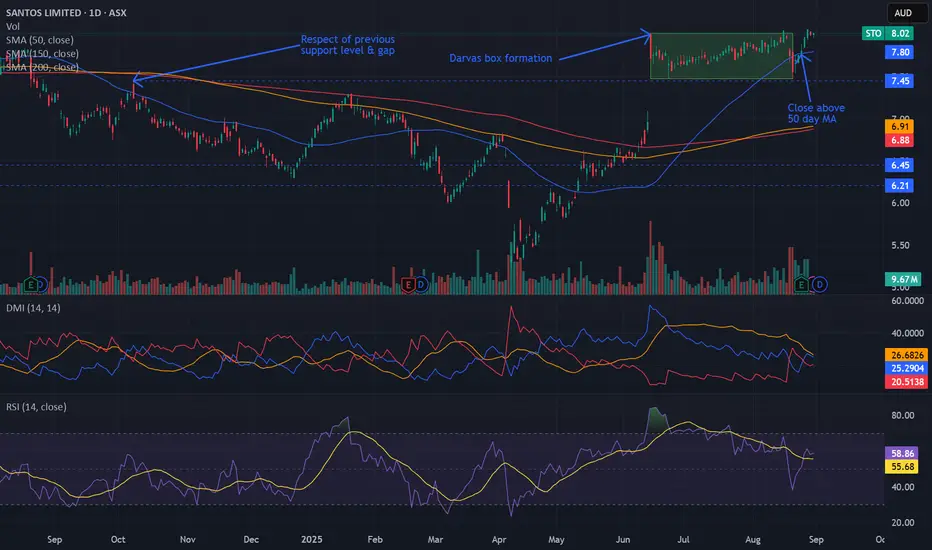
Bullish potential detected for STOEntry conditions:
(i) breach of the upper confines of the Darvas box formation for $ASX:STO.
- i.e.: above high of $8.02 of 16th June (most conservative entry), and
(ii) swing up of indicators such as DMI/RSI.
Stop loss for the trade (based upon the Darvas box formation) would be:
(i) below the support level from the low of 20th August (i.e.: below $7.48).
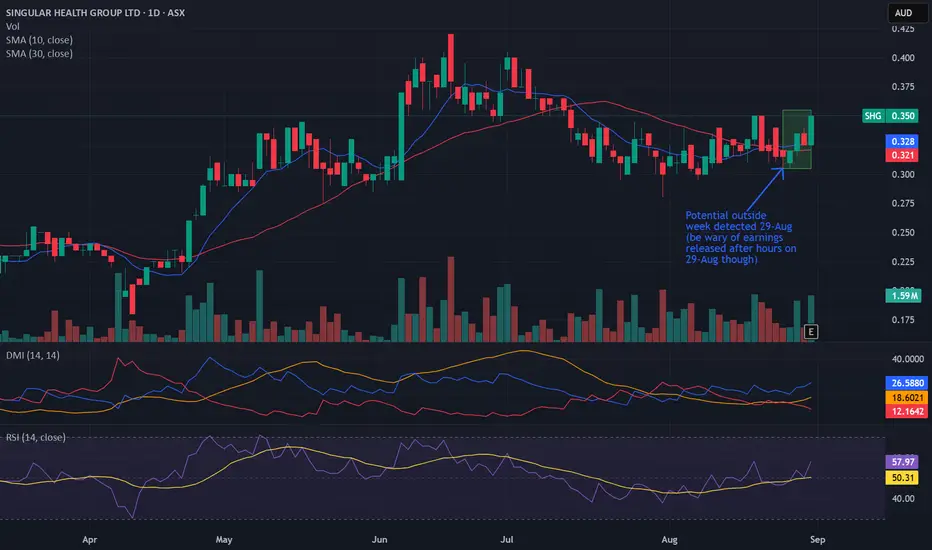
Potential outside week and bullish potential for SHGEntry conditions:
(i) higher share price for ASX:SHG above the level of the potential outside week noted on 29th August (i.e.: above the level of $0.355).
NOTE: Be wary of the market reaction on Monday, 1st September since the annual report was released after market hours on Friday, 29th August - don't chase the market if there is a severe gap up.
Stop loss for the trade would be:
(i) below the low of the outside week on 25th August (i.e.: below $0.305), should the trade activate.
Bullish potential detected for HIOEntry conditions:
(i) higher share price for ASX:HIO along with swing up of indicators such as DMI/RSI (break out of recent channel).
Depending on risk tolerance, the stop loss for the trade would be:
(i) below previous support of $0.017 from the open of 7th August, or
(ii) below previous swing low of $0.016 from the open of 17th July.

Bullish potential detected for SPKEntry conditions:
(i) higher share price for ASX:SPK along with swing up of indicators such as DMI/RSI.
Depending on risk tolerance, the stop loss for the trade would be:
(i) below previous support of $2.23 from the open of 4th August, or
(i) below previous support of $2.19 from the open of 12th June.

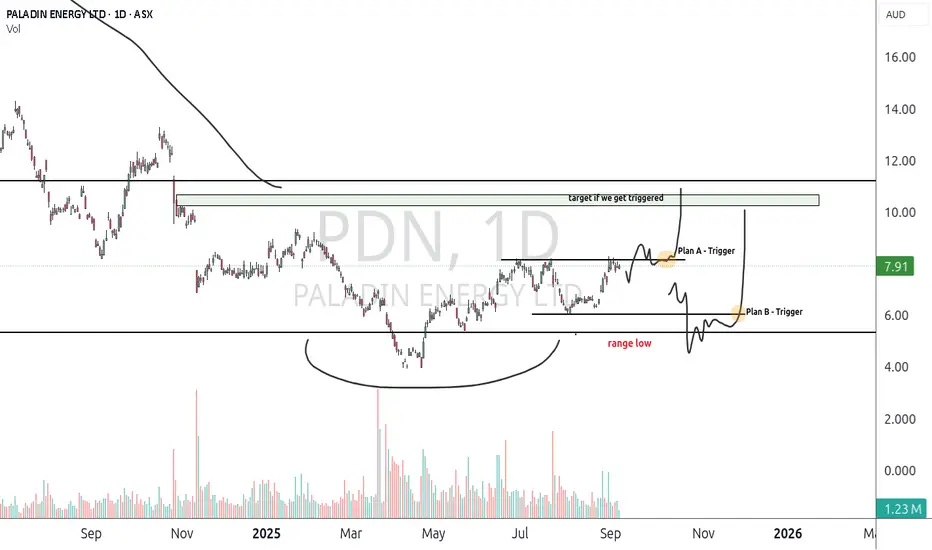
PDN Long triggers on PDN IF we get the pullback this is where il look to take a long.
If Price trade below Range low and holds Idea is wrong and its time to re-evaluate
Uranium
LTRlooking to trade green box in the coming weeks/months as LIT etf has broken out LTR is back inside range with big deviation of range low

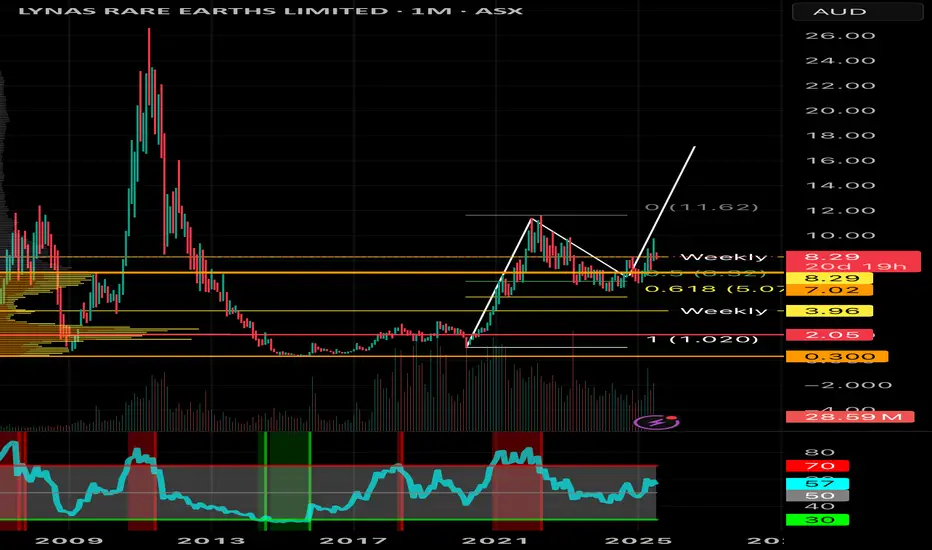
Rare Earth battle shifts gearsMP is flying after hours after the DoD pledged a $1bn of support. Lynas doesn’t have the same upside potential but looks like it’s ready to complete the bull flag pattern. A very strong looking chart, not financial advice but I like what I see here.
Rules for Toughness In Trading
Stay Composed Under Pressure
Toughness is not reacting impulsively when markets move fast.
Your job is to follow your plan, not your emotions.
Respect Your Stop-Loss
Cutting losses is a sign of strength, not weakness.
Never move a stop further away to avoid pain.
Let Profits Run
Fear will push you to take gains too early.
Real toughness is holding winners until your system tells you otherwise.
Accept Being Wrong
Tough traders admit mistakes quickly.
Pride has no place in the market—capital preservation comes first.
Prepare Relentlessly
Toughness is built before you enter the trade.
Write your rules, review your journal, and know your system inside out.
Control What You Can, Ignore What You Can’t
You cannot control the market.
You can control risk, position size, and your reactions.
Be Consistent, Not Dramatic
Endurance matters more than excitement.
Small, disciplined actions done every day create long-term success.
Detach from Ego
Toughness means trading the system, not proving you are right.
The market doesn’t reward pride—it rewards discipline.
Regulate Emotion
Anger, fear, and greed destroy decision-making.
Real toughness is staying calm when others panic.
Show Up Every Day
Toughness is persistence.
Win or lose, you come back to the screen and execute the process again.

$GNC price extension targets Let’s see how GrainCorp sp plays out here. Im expecting an extension from this point at $9.30 or $11.25 before a retrace and reset.
My theory is being led from Fibonacci extension and retracement tools.

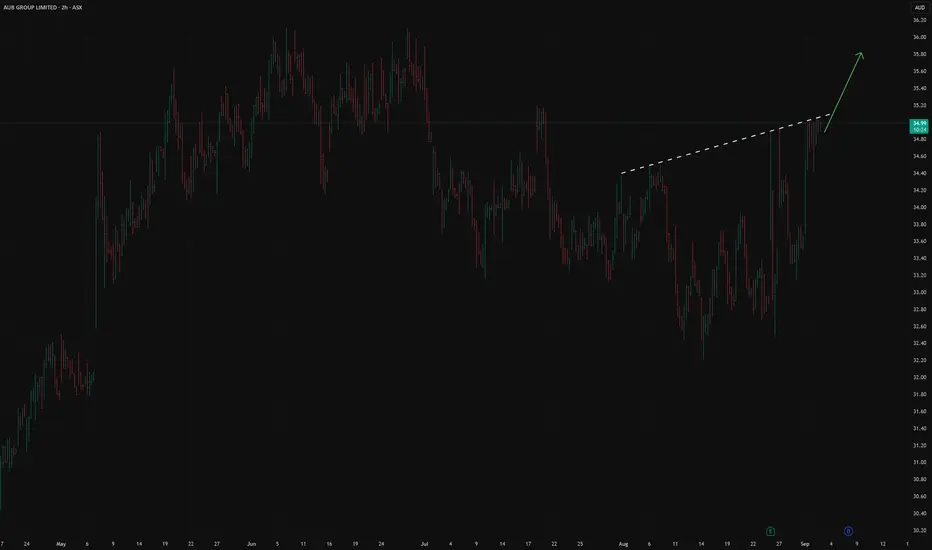
AUB AU ( AUB Group Limited) LongAUB Group Limited is a major Australian insurance brokerage and underwriting group, a component of the ASX200 index
Principal activities:
-Insurance Brokerage: AUB Group acts as an intermediary between clients (primarily small and medium-sized businesses) and insurance companies
-Underwriting agencies: The company develops, distributes and manages insurance products on behalf of licensed insurance companies
-International operations: Following the acquisition of the UK company Tysers in 2022, AUB Group significantly strengthened its presence in the UK market, engaged in wholesale and retail brokerage
-Partner network support: AUB Group holds stakes in partner brokerage businesses
Quotes are beating the market. We expect an approach to historical highs, as the company shows:
- strong financial results:
1. In FY25 reached 200.2 million Australian dollars, which is significantly higher than the FY24 figure of 171 million dollars.
2. The declared dividend increased by 15.2% to 91 cents per share
The acquisition of Tysers not only expanded the geographical presence, but also diversified the income. The international segment (mainly UK) now accounts for about 30% of the group's profit.
3. Under the leadership of CEO Michael Emmett, the company has been consistently fulfilling its stated strategic goals. The recent statements by the management about the focus on further optimization and growth in FY26 were also positively received by the market
We also expect a consistent increase in dividends in the coming years
The company's balance sheet is consistently growing, which is also positively received by the market
We are waiting for a local resistance breakout
Mithril Silver & Gold: Is +600% Upside possible?Mithril Silver & Gold combines district-scale high-grade gold-silver targets in Durango, Mexico with a compelling technical setup:
1. Experienced team: CEO and technical leadership have a proven track record taking projects from discovery through feasibility to successful exits, including multi-million ounce deposits.
2. District-scale upside: Six targets across the Sierra Madre district, with Target One already defined (~0.5Moz AuEq) and significant potential for lateral and depth extensions.
3. High-grade, low-capex potential: Target One grades ~7 g/t AuEq, offering the possibility of a high-margin resource with quick capital payback (<18 months according to CEO).
4. Well-funded exploration: Strong cash position (~A$14.2M as of March 31) plus a subsequent CAD 11.5M brokered private placement, financing the planned 2025 drill program (~35,000m).
5. Aligned insiders: Management and key shareholders have meaningful skin in the game, incentivized to grow the resource.
6. Clear roadmap: Updated resource planned for early 2025, providing a catalyst for potential re-rating and value realization.
7. Regulatory environment: Local support at state and municipal levels in Durango, with manageable operational liabilities and no long-term debt reported as of the latest financials.
Technical: Downtrend since 2009, well-formed base over the past 3 years, September 2024 bar marked by highest volume ever (inside bar), forming a cup-and-handle already broken with satisfying volume. Measured move target sits above the long-term downtrend line.
💡 Bottom line: The combination of district-scale targets, high grades, an experienced team, and strong funding creates an asymmetric risk/reward setup for investors in the precious metals space.

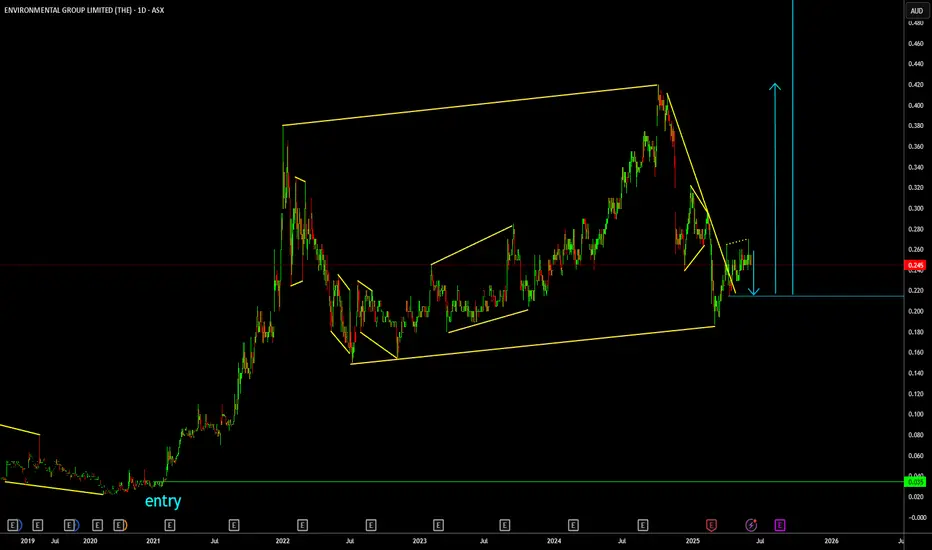
EGL long term buy setup almost readyHey people,
watching for the c wave down before long-term upside have an alarm or watch this daily/weekly for the buy setup according to your strategies... previous buy for an investor scored 1000% @0.035 more upside to come structure playing out perfectly
Bearish potential detected for WEBEntry conditions:
(i) lower share price for ASX:WEB along with swing of DMI indicator towards bearishness and RSI downwards, and
(ii) observing market reaction around the share price of $4.54 (open of 26th June).
Stop loss for the trade would be:
(i) above the declining 50 day moving average (currently $4.70), or
(ii) above the low of the candle on 24th July prior to the gap-down prior to the close below the 200 day moving average (i.e. just above $4.78), or
(iii) above the recent swing high on 23rd July (i.e.: above $4.93), depending on risk tolerance.

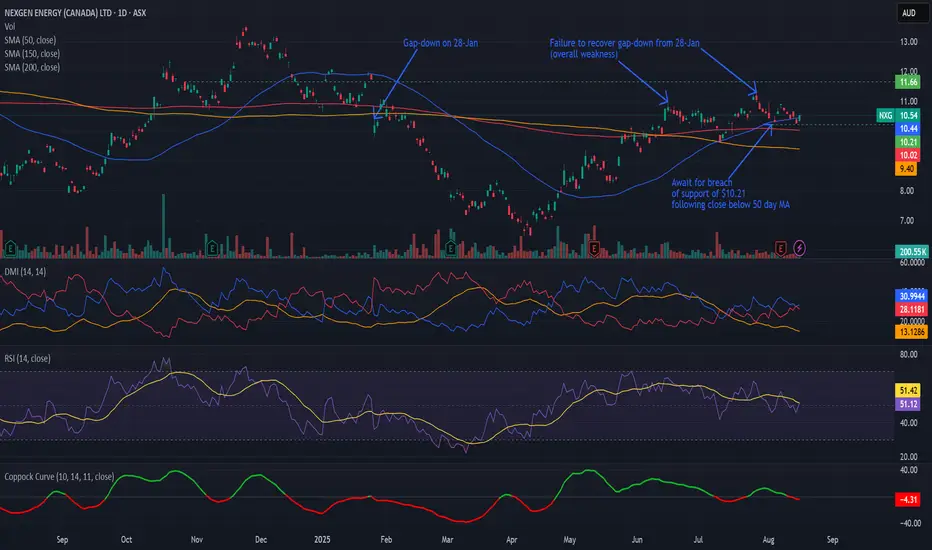
Bearish potential detected for NXGEntry conditions:
(i) lower share price for ASX:NXG along with swing of DMI indicator towards bearishness and RSI downwards, and
(ii) observing market reaction around the share price of $10.21 (open of 4th August).
Stop loss for the trade, depending on risk tolerance, would be:
(i) above the recent swing high of $10.92 of 7th August, or
(ii) above the potential prior resistance of $11.18 from the open of 28th July, or
(iii) above the potential prior resistance of $11.66 from the open of 28th October 2024.
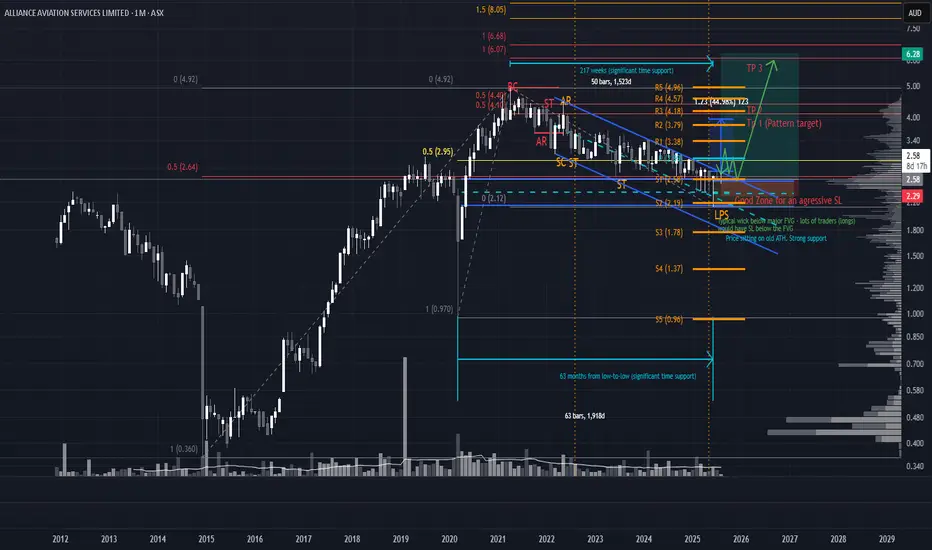
Don’t Sleep on AQZ: Smart Money May Already Be PositionedAQZ — 4-Year Reaccumulation + Bullish Doji = Strategic Long Setup
AQZ is looking primed for a long play. Price has been reaccumulating for ~4 years, and June printed a bullish monthly doji—a classic liquidity sweep. Price pierced the major fair value gap (FVG) from the May 2020 pump candle, tested the yearly S2 pivot, and found support right on the EQ of the range. That’s a trifecta of demand confluence.
Entry Scenarios Based on Risk Profile
Aggressive Entry Enter now with a tighter stop loss around $2.29, which aligns with two EQ zones: the June 2025 demand structure and the channel EQ. This setup suits high conviction traders looking to front-run the breakout.
Conservative Entry Use a wider stop beneath the Last Point of Support (LPS) for more breathing room. This protects against deeper retests while still respecting the bullish structure.
Preferred Entry (Low Risk, High Confluence) Wait for price to break and retest the channel, then consolidate above it. This would also confirm a break of the major 50% resistance projected from the all-time low to all-time high—a powerful signal of trend continuation.
Strategic Overlay
This setup blends long-term structural strength with tactical precision:
4-Year Base = Institutional accumulation
Doji Sweep = Smart money absorption
Multi-level confluence = High-probability AOI
If price rallies from this zone, expect momentum to build quickly. But as always—one step at a time. Let price confirm before scaling in.
*please note, arrows are not time analysis just pathing
Potential outside week and bullish potential for NOVEntry conditions:
(i) higher share price for ASX:NOV above the level of the potential outside week noted on 31st July (i.e.: above the level of $0.032).
Stop loss for the trade would be:
(i) below the low of the outside week on 31st July (i.e.: below $0.026), should the trade activate.
