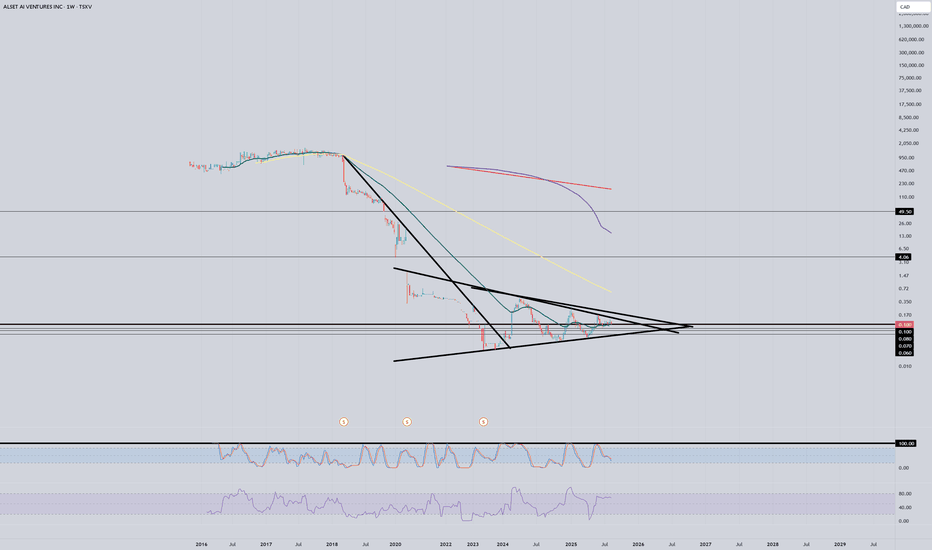
GOLD HITS $3,546 ATH - Time to "Swing the Bat" on Juniors Again!With Gold absolutely ripping to fresh all-time highs at $3,546, I couldn't help but dust off one of the old playbooks and revisit TSXV:ALTA .
Got back in at 10c because sometimes the best opportunities are hiding in plain sight while everyone's chasing the shiny new toys.
For those who've been following the flows here, you'll remember this was one of our porphyry plays that we've been tracking since the early days.
The technical setup + what they've built while everyone was sleeping? Chef's kiss 👌
The Setup That Brought Me Back 📈
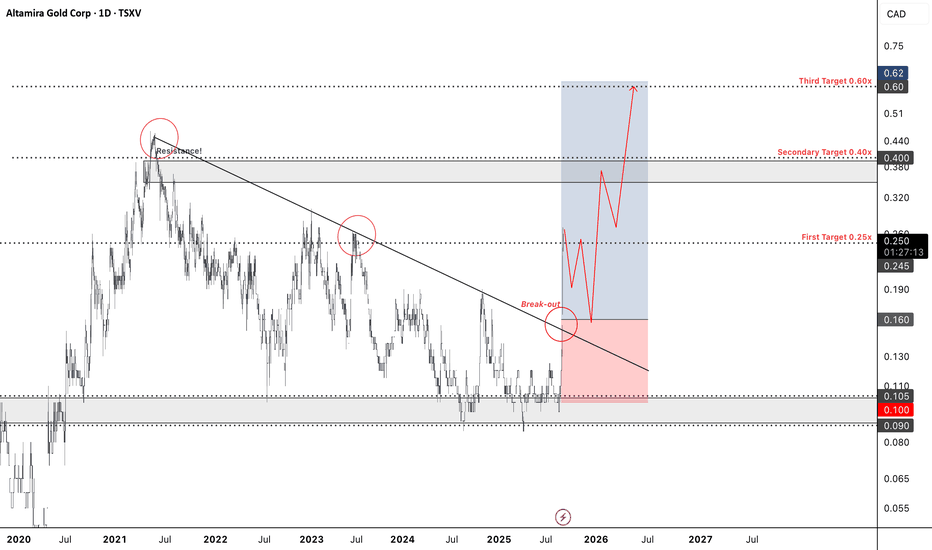
Current Position: Loaded at 10c
Buy Zone: 12c-16c (on any summer pullback)
Targets: 25c → 40c → 60c
The beauty of this setup is we broke almost 4 year resistance breakout level.
For those asking "but what if gold pulls back?" - and thats when you buy as juniors are about to fly this season,
these guys have production costs around $500/oz, so it's largely irrelevant for the fundamentals.
↳ On the Maria Bonita Discovery...
This isn't the same TSXV:ALTA from years past. They've been grinding away and DOUBLED their resource base with the Maria Bonita porphyry discovery.
We're talking 542,800 oz Indicated + 877,400 oz Inferred total resources now.
But here's the kicker - that latest deep drill hole hit 500 meters of mineralised zone. Five hundred meters! And surface samples pulling 27.5 g/t gold at Tavares Norte.
When you start connecting these alteration zones across 8+ untested targets, you're not looking at a deposit anymore... you're looking at a potential gold camp.
Why Junior Season is Cooking 🔥
Gold hitting $3,546 isn't just a number - it's confirmation that the macro thesis around monetary debasement is playing out exactly as mapped. The flows into private assets we've been tracking?
This is just the beginning.
Junior explorers with legitimate discovery stories are going to get re-rated hard over the coming quarters. TSXV:ALTA porphyry system in Brazil's proven Alta Floresta Belt (6M+ historical oz) positions them perfectly for institutional attention.
The Technical Picture
Clean breakout from that multi-year downtrend ✅
Volume confirming the move ✅
25c will be strong support once we clear current resistance
Quick test back to buy zone likely before the real slingshot begins
For those with patience, this has all the makings of another home-run setup brewing towards
those $2+ targets we used to talk about.
Sometimes the best plays are the ones that have been quietly improving while nobody's watching.
Highly recommend tracking that 12c-16c zone for new entries.
This summer pullback could be the last chance before we start that final slingshot move.
Who else is positioning for junior season? 👇
Not financial advice - I own shares and clearly think this thing's going to the moon 🌙
Also I will be back with more macro, tech, mining, crypto... you name it, the Pig is back from a long break...
#JuniorGold #Porphyry TSXV:ALTA PEPPERSTONE:XAUUSD
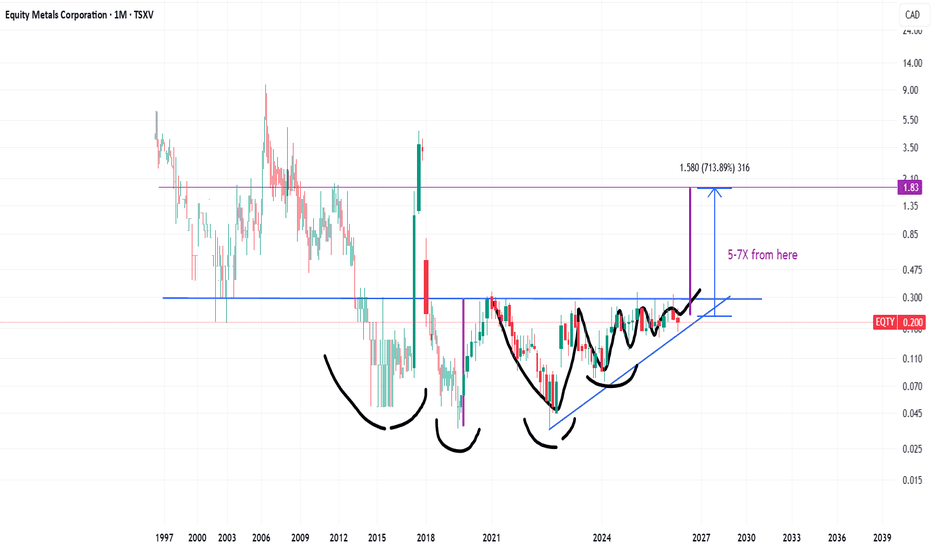
IH&S and Asc Triangle gives 5-7 x in time for EQTY Silver stockBullish set up for silver stock
Silver charts long term indicate break out, this small silver miner could 5 to 7 x according to
the inverse Head and Shoulders pattern its making atm
On the right hand side of the shoulder its made an ascending triangle
Bulkowski suggests 60 % chance of breakout into the next zone up, which is realistic for ascending triangles
The chart calls for 7x from here, thats possible but may take a while, as the pattern took such a long time to form
Good luck out there this is one to tuck away for 5 years in some tax free savings fund or off shore account and be pleasantly surprised when it gets there sooner!
Its only a small 50 M stock so liquidity may be an issue. Equally for a small investor that may well help to make those above average gains that you are looking for
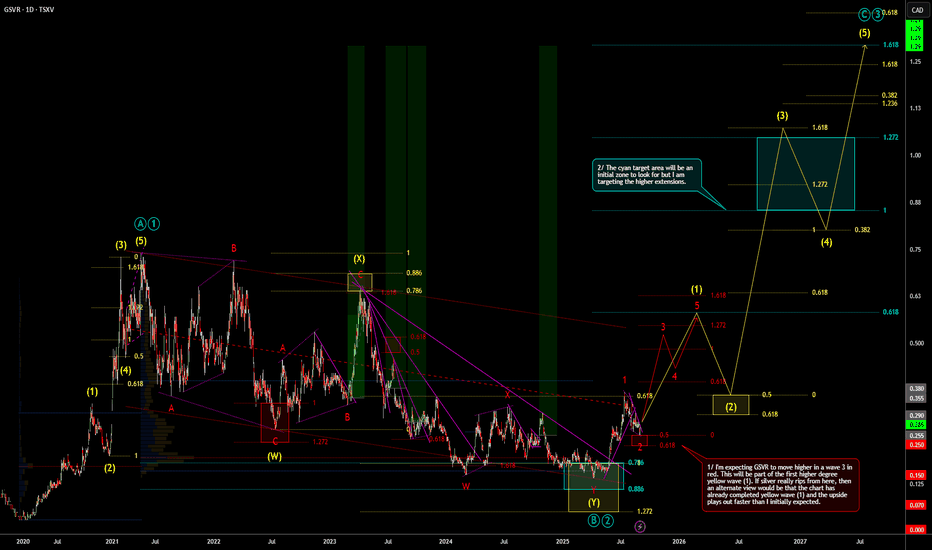
Daily Outlook on GSVR Guanajuato Silver CompanyThis is my Daily chart outlook for TSXV:GSVR I have added in tranches during the decline looking for the up move which I believe is unfolding now. The chart could unfold in ABC or 12345. Price currently looks like it is ready to breakout of the wave 2 consolidation.
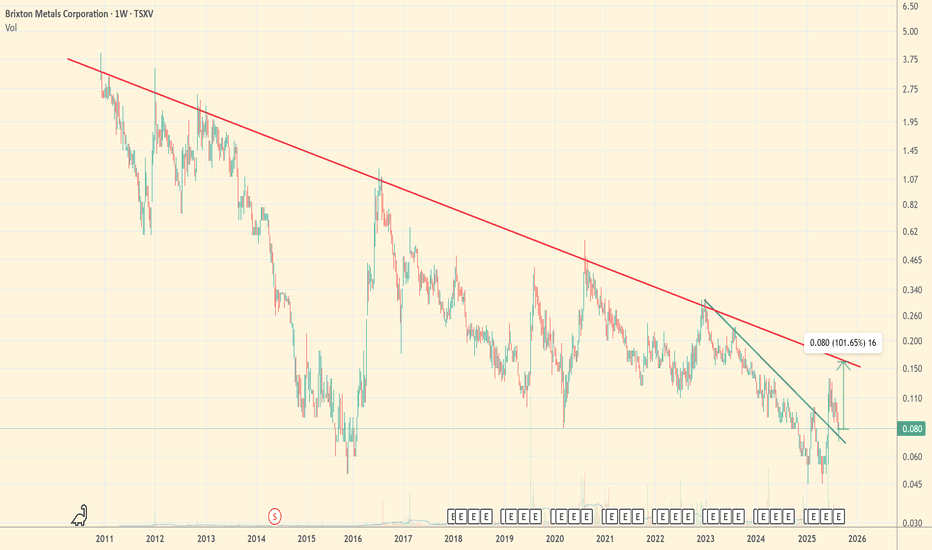
Trading Idea: Brixton Metals (BBB.V / BBBXF)There is the bear market in precious metals from 2011 in a stock. There couldn't be worst timing for listing the Brixton Metals than the 2011 top in gold. Nevertheless - there we are. The gold bull market is here and thus my trade idea. I guess we all see the technicals pretty well so I will post only the fundamentals regarding the company:
1. Stage: Early Delineation (porphyry confirmed + strong Au intercepts, but no resource/PEA yet).
2. Financing: JV deals (Ivanhoe, Eldorado) cover G&A. BHP on the register → secured runway for next programs.
3. Information Risk: no resource, no NPV/IRR yet → medium risk.
✅ New geological model / reinterpretation (UBC porphyry index + new surface work)
✅ First drill holes show scale (Trapper: 64 m @ 5.7 g/t Au)
✅ Large, consolidated land package (2945 km², 100% Brixton)
✅ Early discovery stage (new porphyries, no drilling yet)
✅ Small market cap / manageable float (<$100M)
✅ Financing secured for current program (JV + BHP participation)
✅ Structured newsflow (soil → model → drilling → assays)
✅ Active management / storytelling (CEO interviews, regular updates)
✅ Historical production / showings (discovery 1952, legacy work)
✅ Regional context (Golden Triangle – proven district)
Don't forget to do your own research!
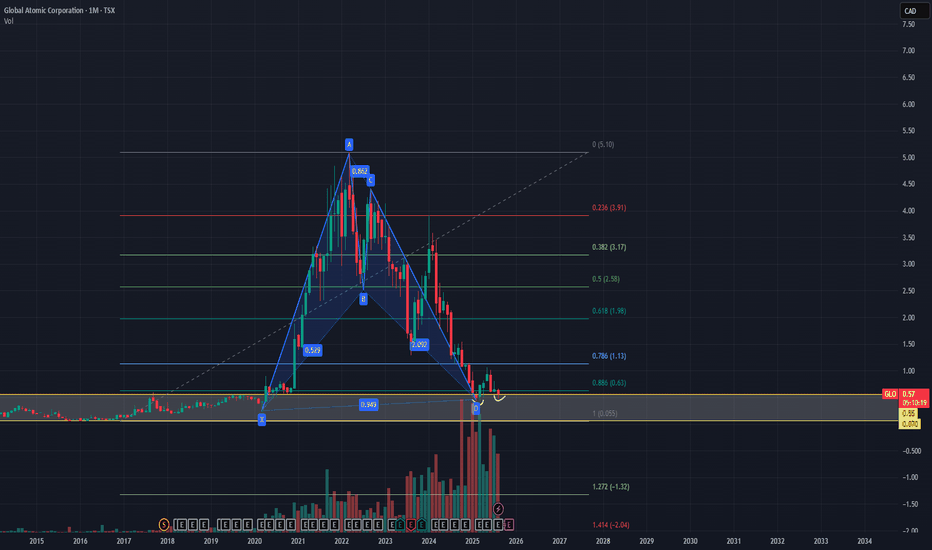
Play on Uranium at key levels.Looking more into nuclear energy, uranium miners/contractors seem to be fitting the scenario where more demand will come.
Knowing that above the previous breakout levels the price simply runs up higher it make it very easy to strategize stop losses.
The company also has communicated with the public that they will be opening operations in Niger in 2026 so holding those key levels which is also an 0.886 fib retrace makes even more sense.
Targeting higher prices of at least 2.50$ in the next year or so.
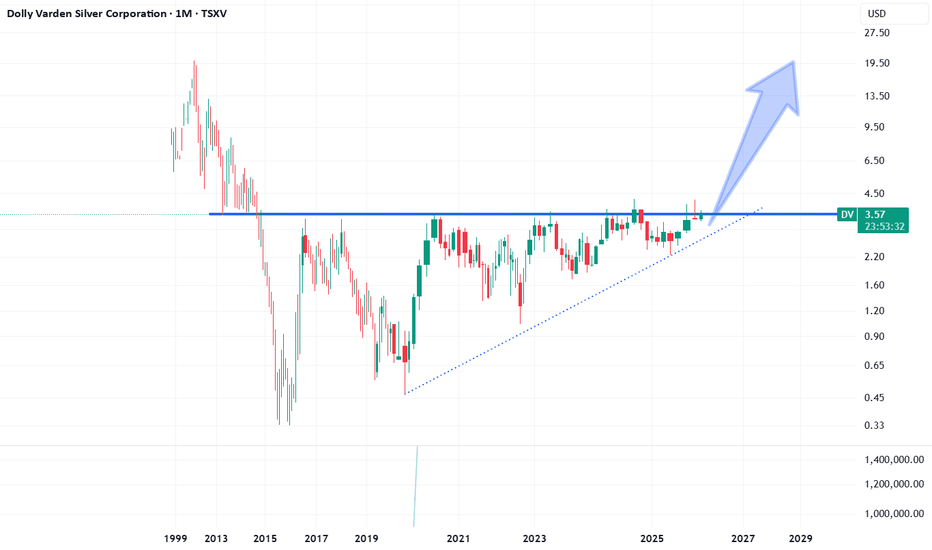
Asc Triangle on DV - thats very bullish over next few years Bullish Ascending Triangle set up for DV
written about it in the past
What a lovely trade, rare example of a silver miner that just wants to pop on balance of probability back up to its all time high
Pattern indicates buying over multiple years with the price of silver moving up most likely soon to ATH this could be a lovely holding if you have children to save up for in a college fund and teach them about silver, devaluation of purchase power in most fiat currencies plus buy them a silver coin to hold in their hands for good luck!
Non advisory but you kind of know its works! ;-)))
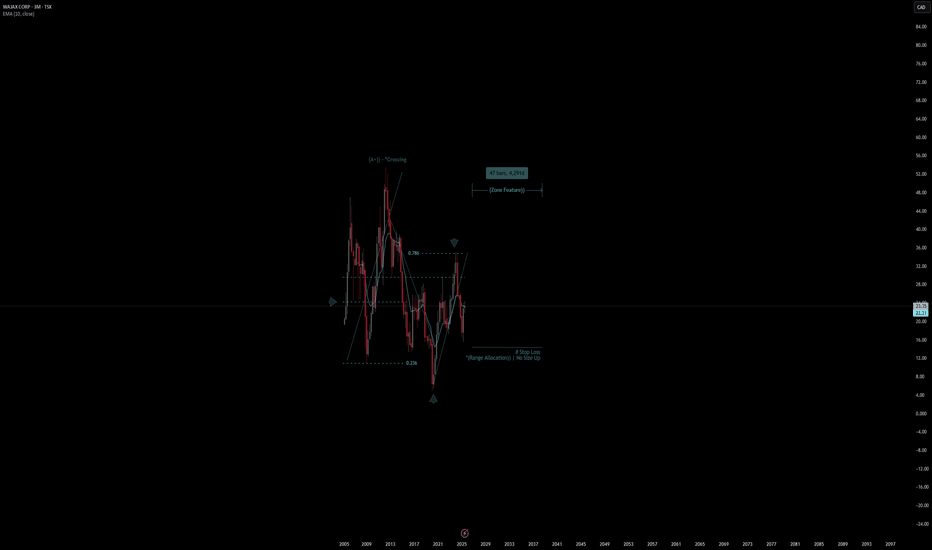
WAJAX CORP | Chart & Forecast SummaryKey Indicators On Trade Set Up In General
1. Push Set Up
2. Range Set Up
3. Break & Retest Set Up
Notes On Session
# WAJAX CORP
- Double Formation
* (A+)) - *Crossing - *Reversal Entry - *10EMA | Subdivision 1
* (Range Allocation)) | No Size Up - *Retest Area | Completed Survey
* 53bars, 4839d | Date Range Method - *(Uptrend Argument))
- Triple Formation
* (P1)) / (P2)) & (P3)) | Subdivision 2
* 3 Monthly Time Frame | Trend Settings Condition | Subdivision 3
- (Hypothesis On Entry Bias)) | Regular Settings
* Stop Loss Feature Varies Regarding To Main Entry And Can Occur Unevenly
- Position On A 1.5RR
* Stop Loss At 10.00 CAD
* Entry At 20.00 CAD
* Take Profit At 35.00 CAD
* (Uptrend Argument)) & No Pattern Confirmation
- Continuation Pattern | Not Valid
- Reversal Pattern | Not Valid
* Ongoing Entry & (Neutral Area))
Active Sessions On Relevant Range & Elemented Probabilities;
European-Session(Upwards) - East Coast-Session(Downwards) - Asian-Session(Ranging)
Conclusion | Trade Plan Execution & Risk Management On Demand;
Overall Consensus | Buy
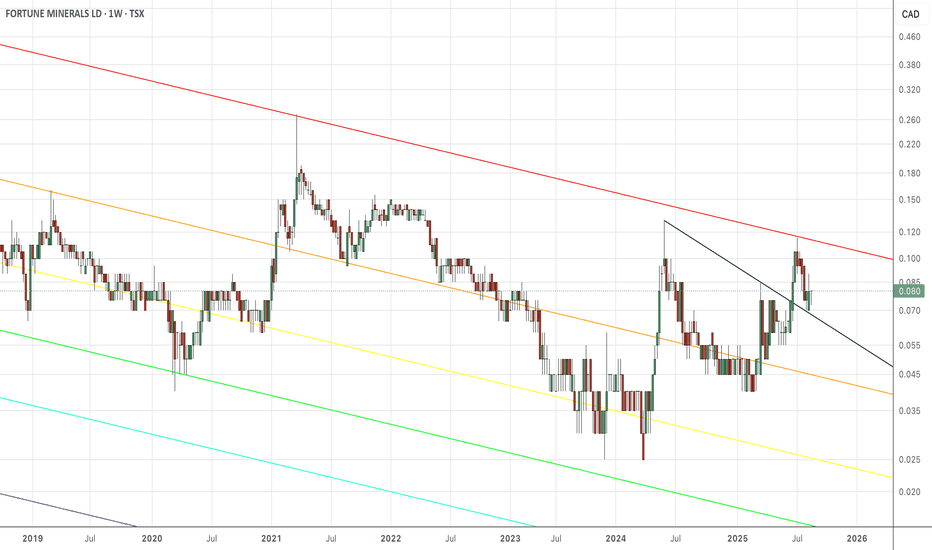
Fortune MineralsFT price landing on support with what almost look like spinning tops. If you squint your eye, they look like spinning tops. You know what that means? Reversal. Reversal to where? The 1-level. If the price reverses and slams back into the 1-level, guess what? Yes, a breakout. Breakout and land on top of the all-time bearish fib channel. And then lift off for the $.25us pivot.
Holla,
ps: stop crying in the chats. Nobody wants to hear your boo-hoo story. If you don't like FT, sell and go away - nobody care! You say you sold, but you're still here, so.....
sus
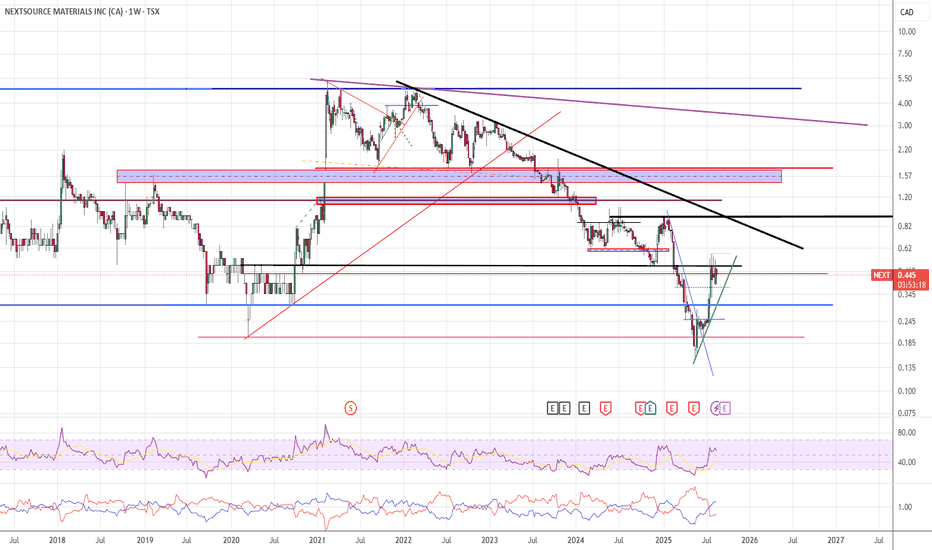
NEXT: big move in the makingNEXT: recent trend change from down ward to up in combination with increased volumes and positive corporate developments - closest target at $0.93C.
*** Graphite - as every mining corporation/ governments are chasing new graphite projects and and industrial corporations are trying to secure enough graphite "ex-china" to continue their normal operations - NEXT already is producing and recently got its first graphite supply contract, also NEXT has capacity to rapidly increase production and get more contracts.
*** Graphite is needed almost everywhere - from Nuclear plants to tanks, plains and electric cars and with 700%+ tariffs on Chinese graphite are coming by Dec/2025 - most of the western world will be under supplied by a minimum of 30% for at least next 5 yrs+. Perfect Cash Storm for NEXT is in the making.
Closest price test for NEXT is $0.93 (probably will break it with ease) - 2nd stop - $1.78 - also possibility of FOMO run in Dec/2025(once tariffs finalized) that could drive NEXT to test $4.85 by end of FEB/2026.
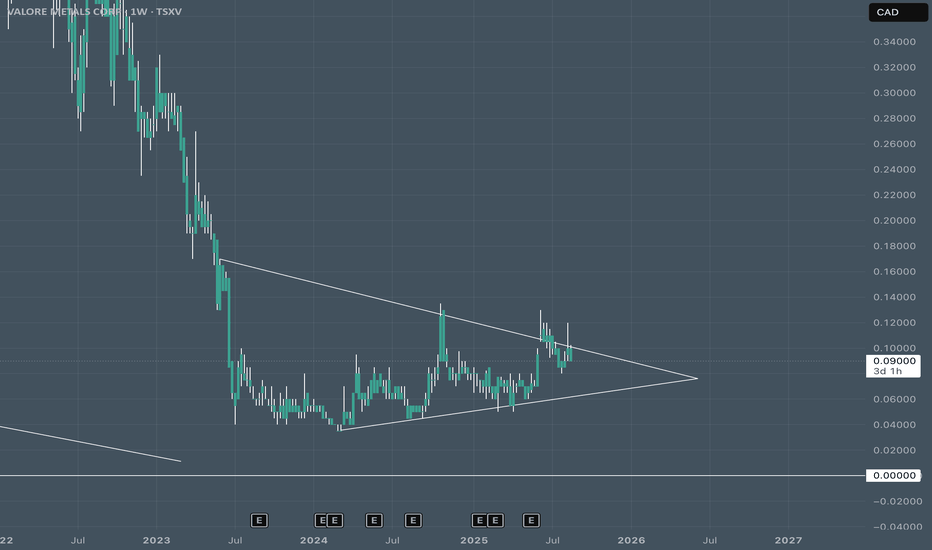
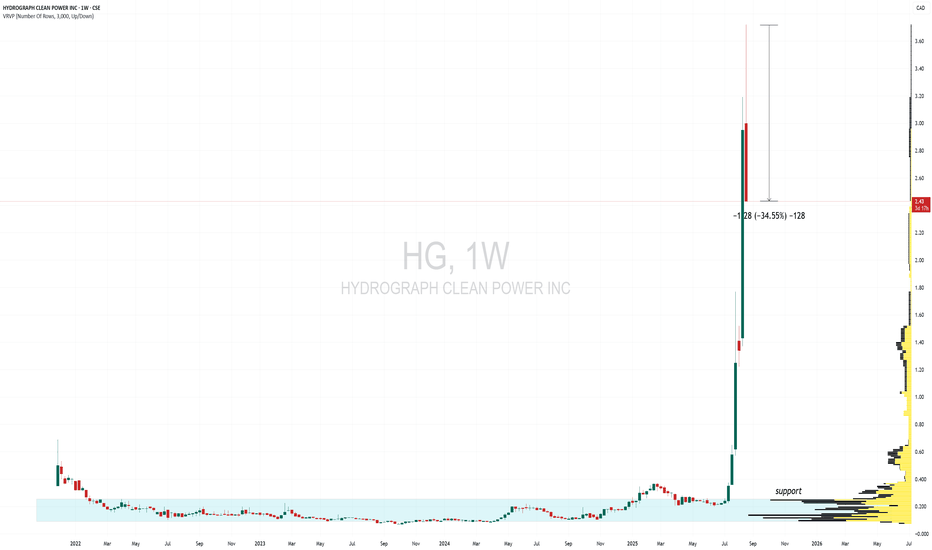
Not sure that this chart has had enough bullish consolidationsNot sure that this chart has had enough bullish consolidations on the way up. Day 1 of the new weekly candle has already created a massive -35% reversal candle.
Yikes. Usually when you have this kind of run-up, the path of least resistance is all the way back down to where it started.
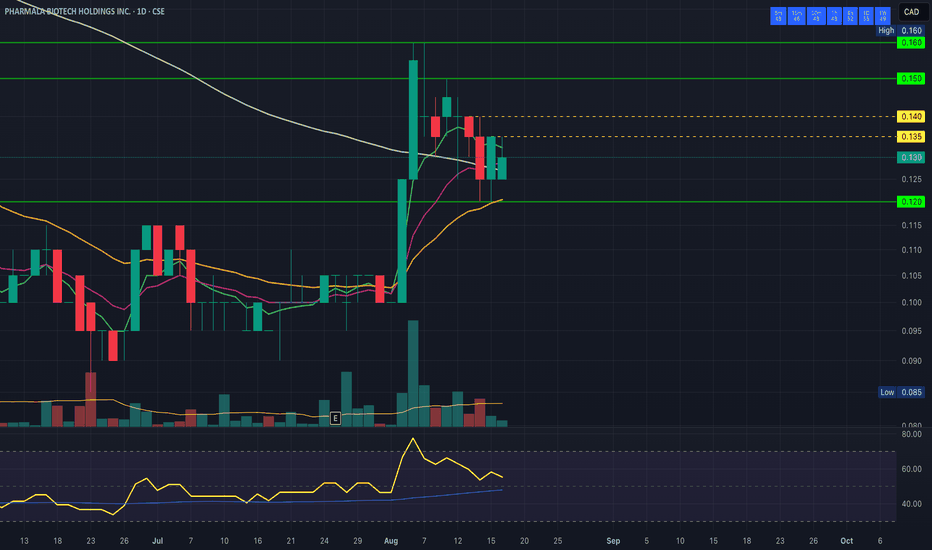
Volatility coming to MDMAMDMA is sideways and healthy consolidation so far, need to keep 12c support and want to see a break above 13.5c soon. Two daily inside bars in a row tells me volatility is coming when this tight range breaks.
I publish regular technical analysis of the psychedelic sector. Be sure to like and follow to not miss an important update!
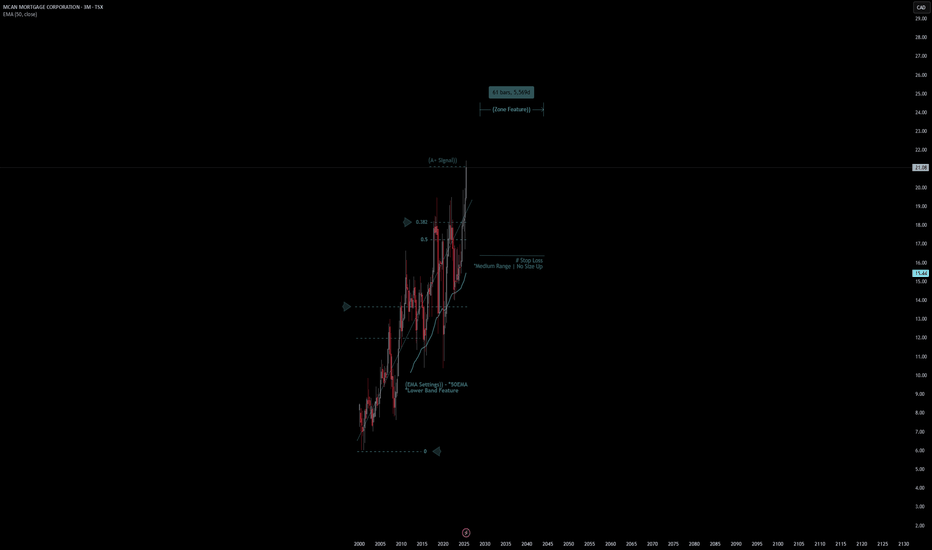
MCAN Mortgage Corporation | Chart & Forecast SummaryKey Indicators On Trade Set Up In General
1. Push Set Up
2. Range Set Up
3. Break & Retest Set Up
Notes On Session
# MCAN Mortgage Corporation
- Double Formation
* (EMA Settings)) - *Lower Band Feature | Subdivision 1
* Stop Loss - *Medium Range | No Size Up | Completed Survey
* 61 bars, 5569d | Date Range Method - *(Uptrend Argument))
- Triple Formation
* (P1)) / (P2)) & (P3)) | Subdivision 2
* 3 Monthly Time Frame | Trend Settings Condition | Subdivision 3
- (Hypothesis On Entry Bias)) | Regular Settings
* Stop Loss Feature Varies Regarding To Main Entry And Can Occur Unevenly
- Position On A 1.5RR
* Stop Loss At 15.00 CAD
* Entry At 18.00 CAD
* Take Profit At 23.00 CAD
* (Uptrend Argument)) & No Pattern Confirmation
- Continuation Pattern | Not Valid
- Reversal Pattern | Not Valid
* Ongoing Entry & (Neutral Area))
Active Sessions On Relevant Range & Elemented Probabilities;
European-Session(Upwards) - East Coast-Session(Downwards) - Asian-Session(Ranging)
Conclusion | Trade Plan Execution & Risk Management On Demand;
Overall Consensus | Buy
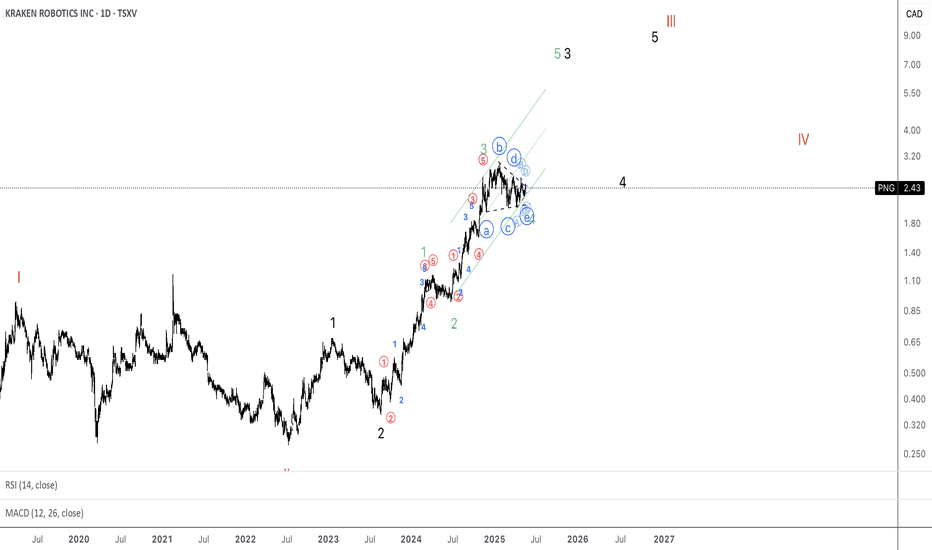
Long Kraken Robotics PNG.V as Wave 5 unfoldsHere triangle is going to end its formation very soon and a break to the upside is expected to unfold the green wave 5.
Triangle is a type of correction that always precedes the final movement in the larger trend.
If assume that wave 5 will be the same length (as waves 1 and 3 are equal in length), the price will go above 6 CAD.
It's bullish baby!!! It will rebound.I am working outside my comfort zone today! I usually stick to the DIA or the SPY or SLV, but I am trying to expand my horizons . I may even try another chart if I have time.
You should be able to trade any stock or asset regardless of what it is. All charts are the same. It just has a different title on it. I got this stock suggestion of it being bullish from a group I joined.
So using the information I have gained over time and based on this chart, I will try to analyze this chart.
I am using the Heikin Ashi candlesticks.
1) They show more of a directional movement within candlesticks.
2) They tend to filter out the market noise so you can see the market direction better.
3) It reduces false signals, allowing you to stay in the trade longer.
4) And, it also gives you a smoother appearance making it easier to see trends and reversals.
But I often switch between regular candlesticks as those are the candlesticks I started trading with and I still do get a little bit of information from the regular candlesticks.
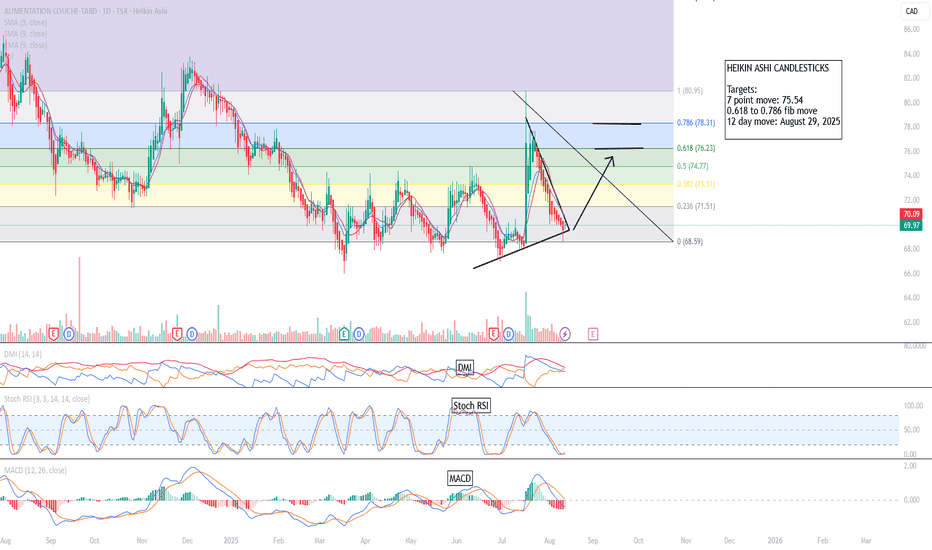
I think we had an descending triangle forming on the ATD with the tip forming on Friday, August 15th.
Usually, the chart can exit 2/3 before the tip. So it can start exiting the triangle before now and August 15, 2025 usually with some fundamental trigger.
It can either exit up or down at the tip but I suspected that the market will exit up given the daily indicators suggesting a move upward.
The DMI on the daily chart is indicating abullish move.
The Stoch RSI is just crossing over to a bullish move, and
The MacD has just started to indicate a bullish move with a bar color change.
TARGETS:
Targets:
7 point move: 75.54
0.618 to 0.786 fib move
12 day move: August 29, 2025
**If it hits one of these targets, I am out of my trade.
STOPS:
1) the low of the previous Heikin Ashi candlestick,
2) 2 red Heikin Ashi candlesticks,
3) a specific dollar amount for a total loss for my trade or
4) a specific dollar amount per contract.
**If it hits one of those stops, I am out of my trade.
My trading plan only entails me to use 10% of my total account. If I am wrong on this trade, I will not implode my account.
Trade at your own risk, make sure you have both targets and stops in place, a trading plan in place and only use 3% or less of your account on each trade.
Happy Trading Everyone!
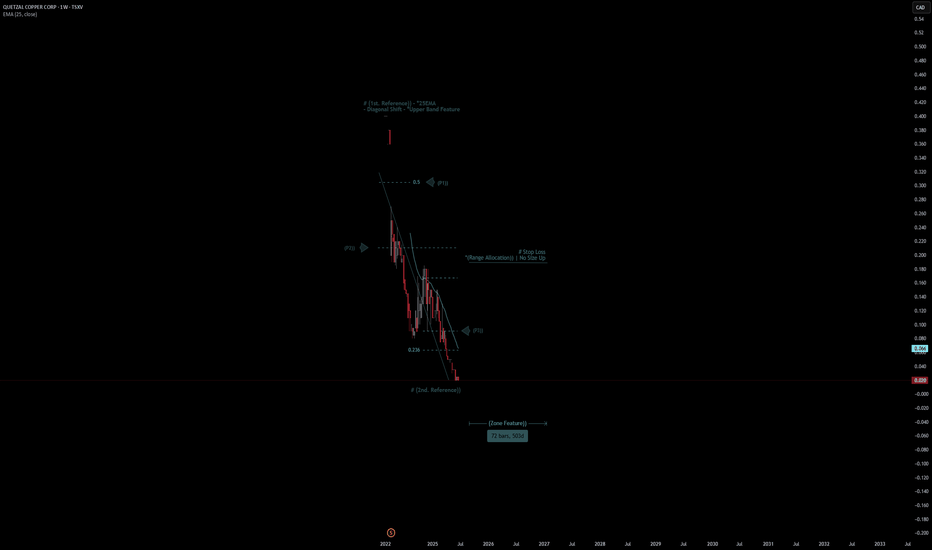
Quetzal Copper Corp Quote | Chart & Forecast SummaryKey Indicators On Trade Set Up In General
1. Push Set Up
2. Range Set Up
3. Break & Retest Set Up
Notes On Session
# Quetzal Copper Corp Quote
- Double Formation
* (1st. Reference)) - *25EMA | Subdivision 1
* (Range Allocation)) | No Size Up | Completed Survey
* 72 bars, 503d | Date Range Method - *(Uptrend Argument))
- Triple Formation
* (P1)) / (P2)) & (P3)) | Subdivision 2
* Weekly Time Frame | Trend Settings Condition | Subdivision 3
- (Hypothesis On Entry Bias)) | Indexed To 100
* Stop Loss Feature Varies Regarding To Main Entry And Can Occur Unevenly
- Position On A 1.5RR
* Stop Loss At 9.00 CAD
* Entry At 5.00 CAD
* Take Profit At 0.50 CAD
* (Downtrend Argument)) & No Pattern Confirmation
- Continuation Pattern | Not Valid
- Reversal Pattern | Not Valid
* Ongoing Entry & (Neutral Area))
Active Sessions On Relevant Range & Elemented Probabilities;
European-Session(Upwards) - East Coast-Session(Downwards) - Asian-Session(Ranging)
Conclusion | Trade Plan Execution & Risk Management On Demand;
Overall Consensus | Sell
MDMA forming a daily bullflag setupThis is a daily bullflag unless bears prove otherwise. Bulls trying to hold 13c as the new daily higher low. Daily EMA12 is catching up to us and anticipated to also provide support. Backtest on the pullback found support at the daily 50SMA which has been an important moving average in the past.
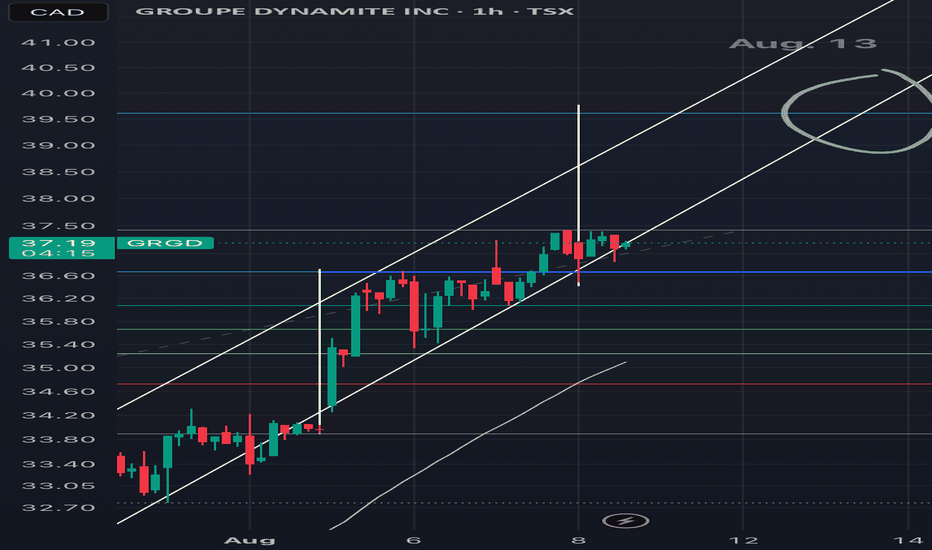
GRGD upwards and beyondBig pump ongoing and no one really saw that coming… unless you’ve been paying attention.
These guys are killing it. Every time I walk in front of their two stores in a mall close by, it’s pretty much always packed. I think this could eventually reach Aritzia in terms of market cap (~7b). And now GRGD is 4b. Lots of headroom.
Anyways, it’s getting tested rn and if the price holds, we could see close to 40$ quite soon. If it gets under that resistance line, I could see this dropping to high 20’s / low 30’s. There’s hasn’t been such a pump yet with this one and the early buyers are probs gonna take some $$ soon. So beware in the short term, but things are def looking up with this one.
✌️
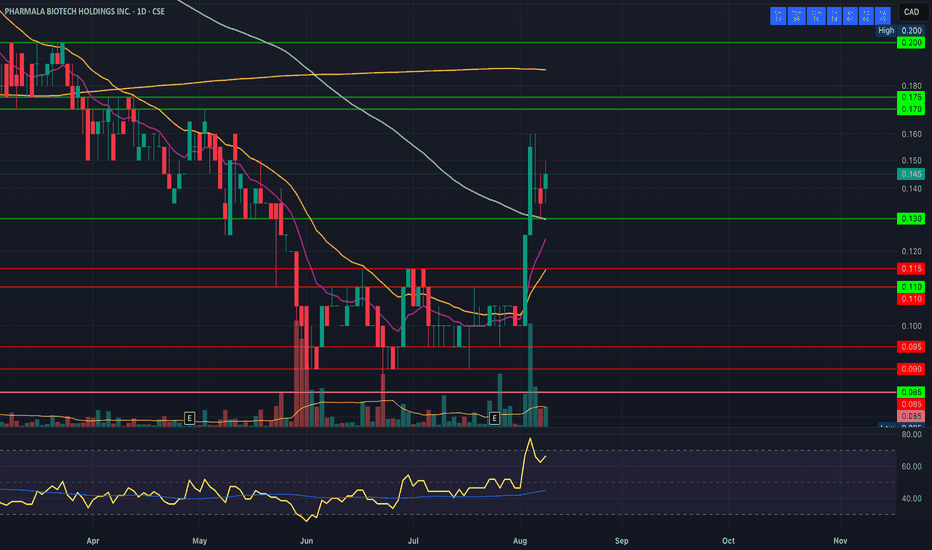
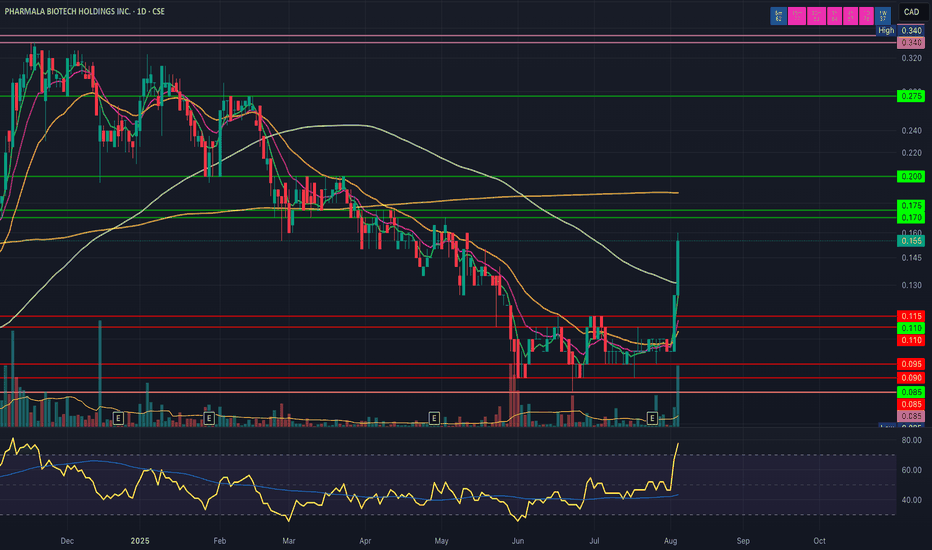
MDMA bulls charging hard Another huge day after yesterday's giant breakout, more than tripling yesterday's volume. Today had the first sign of some sellers on the tape, which is entire expected after a 60% move, but the sellers did nothing to stop the buying pressure closing half a cent off the high. Congrats to the bulls who took this trade setup I posted on July 28th!
I publish regular technical analysis of the shrooms sector, be sure to like and follow so you don't miss future updates!
