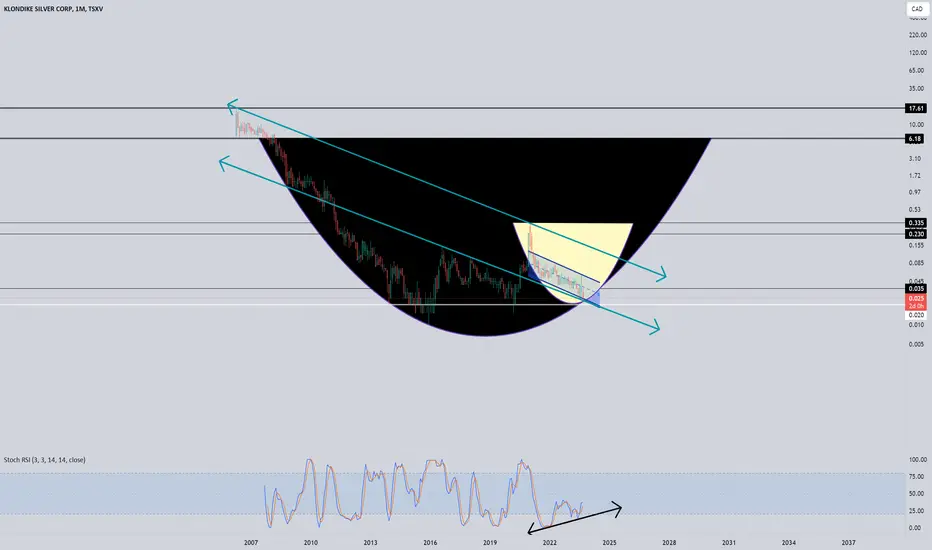
Could a Breakout Finally be Near?!?I can't help but wonder if this chart is telling us something?!? It's been a slow grind down, but this positive divergence on the RSI leads me to believe something is about to happen one way or another. As I've said before, nothing happens here without a massive pop in the spot silver price.
STAY TUNED!
Side note: Likely nothing to read too much into; but I visited their website and it's much improved from recent years. Sounds crazy, but sometimes the look and quality of a company (even online) can say a lot about what's to come.
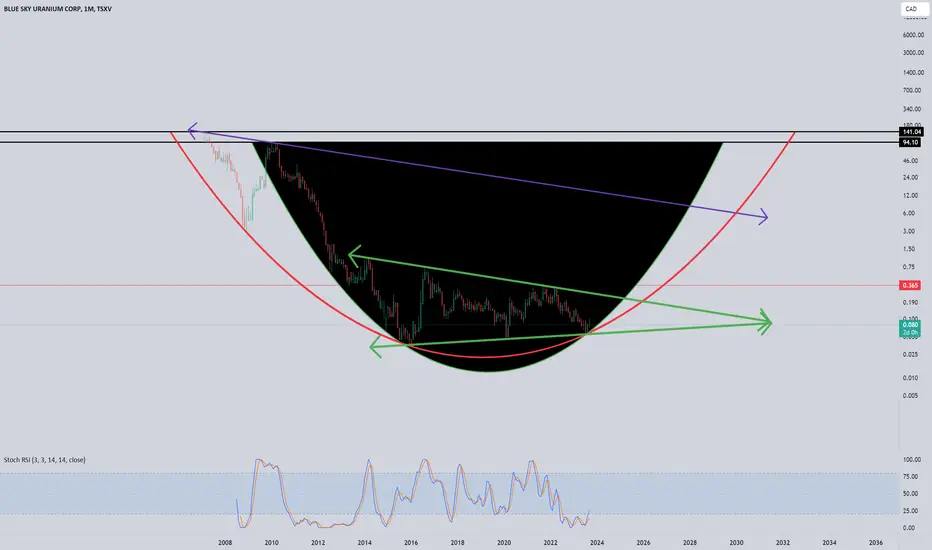
Blue Sky Uranium is getting ready for something BIG!This is looking like a beautiful setup and aligns well with a uranium bull run. Let's keep an eye on this one for the remainder of the decade ;).
Canadian TireA long term possible scenario for Canadian Tire can be labeled According to the attachment chart.The time to reach the goal is the next 4 years

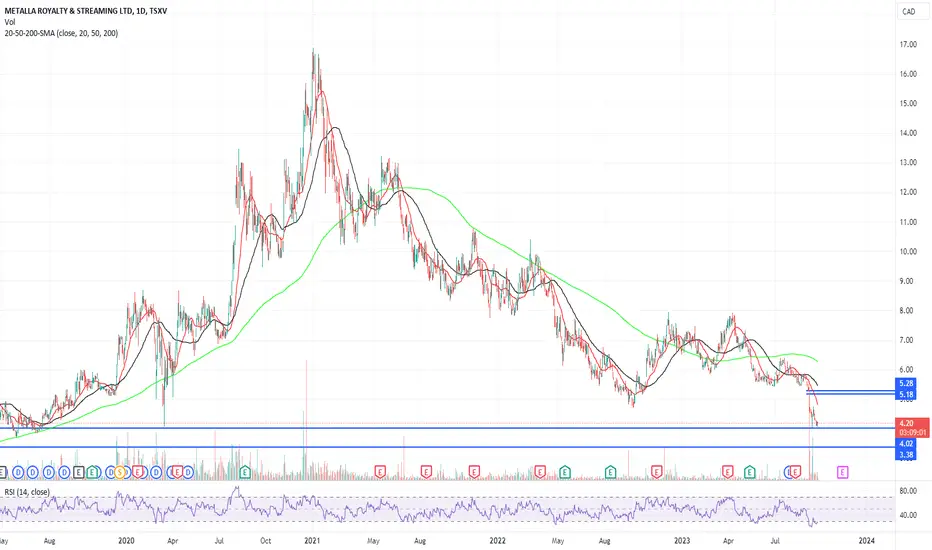
MTAMTA is oversold.
A good opportunity from $4.20 for a 20% swing back to the $5.18 gap-fill.
Starting a position here.
Will add if it drops lower.
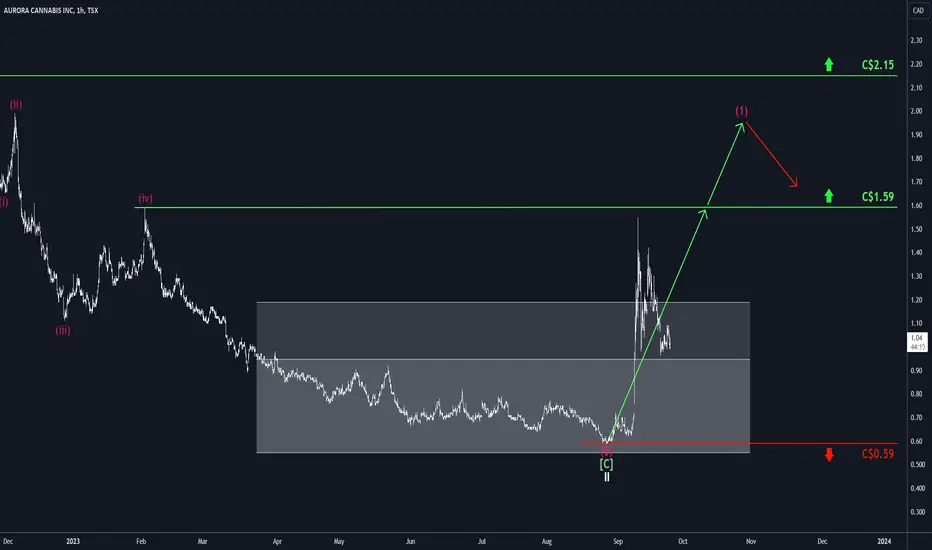
Aurora: Electrified ⚡Aurora continues its electrifying trajectory. The price dipped further into its inactive target zone during the last trading week and is now visibly striving to resume the primarily expected uptrend. These efforts should soon yield bullish results. Aurora’s next target, the resistance at C$1.59, lies approximately 60% away. This resistance must be surpassed to grant wave (1) in magenta, its well-deserved peak a bit higher. An intermediate correction is expected to pull the price back slightly.
Update on Enbridge Stock This is just a quick video I have made for some of the followers. For some odd reason I wasnt able to reply, so here are my thoughts out loud.
I havent yet purchased Enbridge stock and waiting for the first to test the trend again and of course the supports mentioned on my video.
Please note that I am not an expert so share your thoughts ideas and let us all work together

late stage double top collapseThis heavily pumped stock suffered a colossal double top, after hitting that big 4.618 extension.
See my recent BRW.v chart for a similar set up.


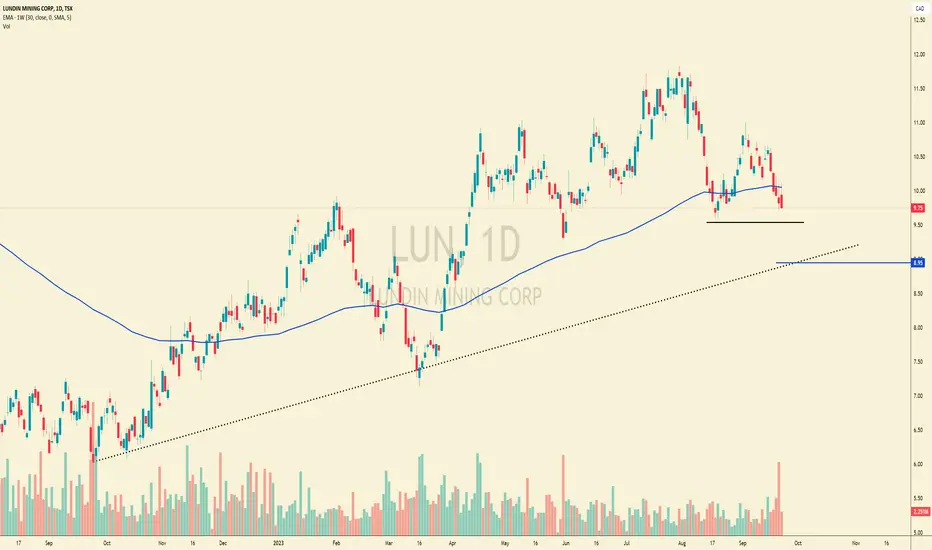
whats thisGiven the number of red days in a row here, I think that it's probable to assume that a {double-bottom} may provide a bounce to reverse the trend. If it fails, then one could look for placing a bid at around the $9 mark.
$lun.to
feels good$gato.to looking good, now back above weekly EMA30. Price bounced last week at a point that was a previous resist. Super bullish if it makes a sideways bull flag here.
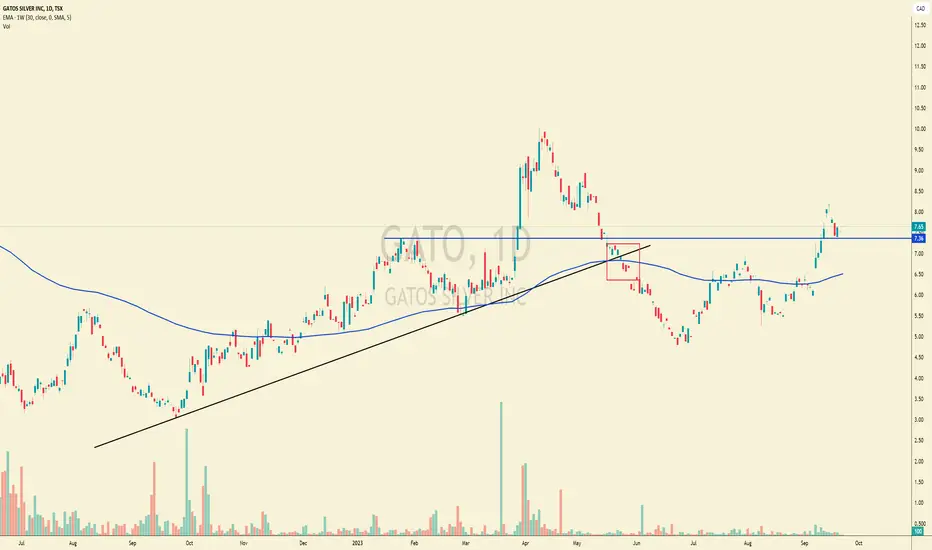
mixed signalsnot a big fan of the engulfed candle on Friday, but the big local horizontal support hasn't broken yet.
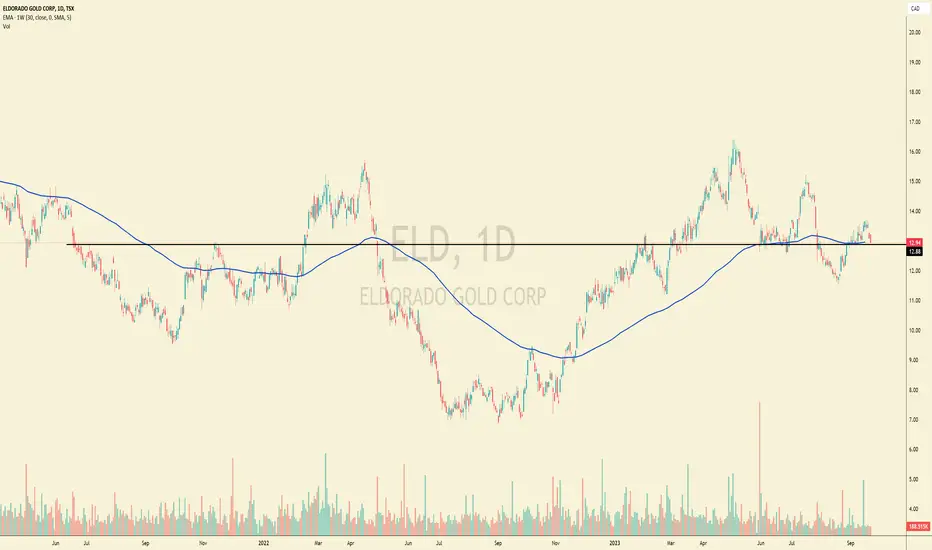
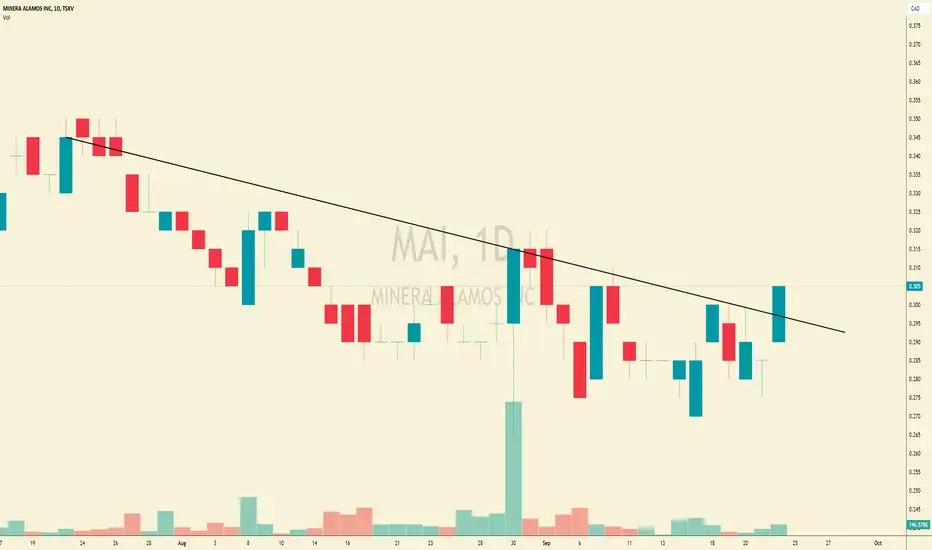
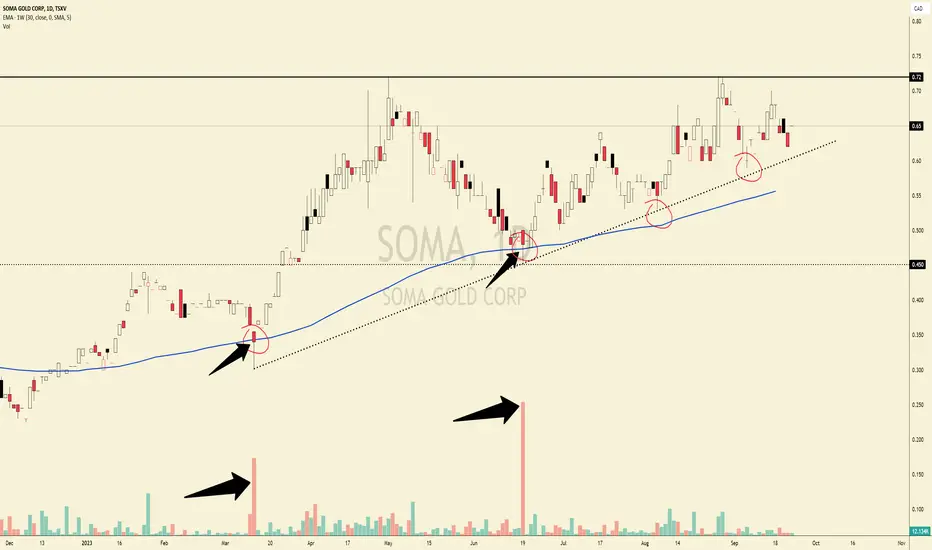
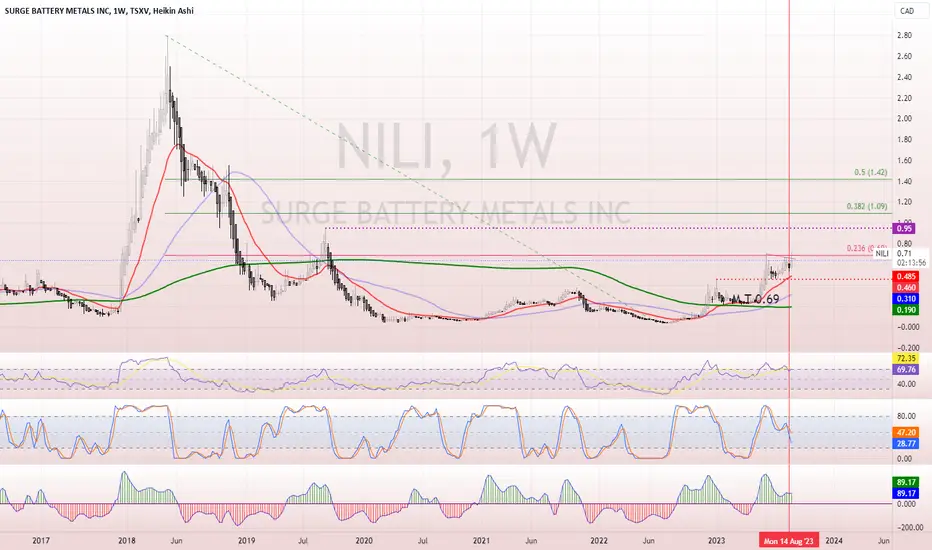
sellers leaving the buildingI just love this chart. Look how each capitulation event is met with max pain for the bears the very next day, many times in a row along that rising support line.
Selling volume is waning. Looks set for a probable breakout past 72 cents next time.
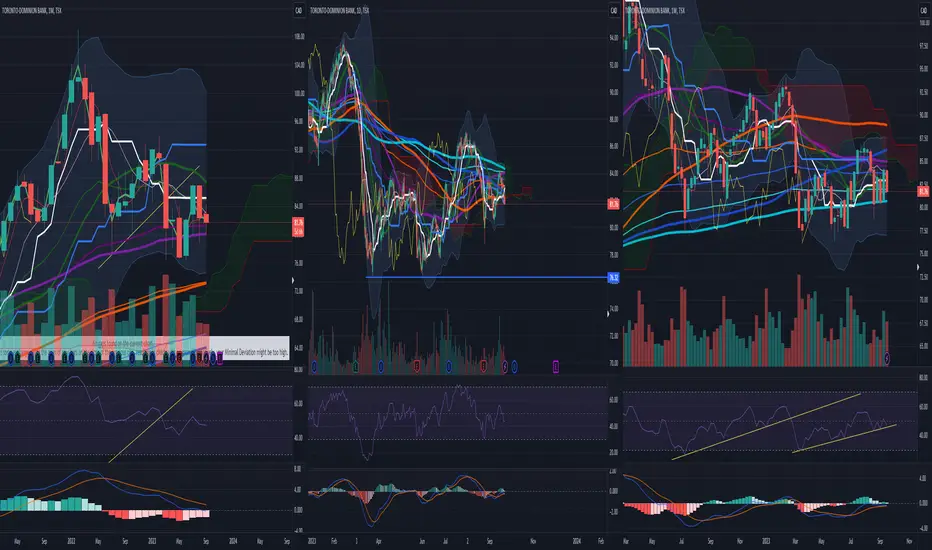
Short TDWeekly bear flag
Weekly 200 week SMA being tested too many times
Weekly under Red Ichimoku cloud
Volume spike at the top of the daily green ichimoku cloud suggesting heavy selling
TP1: Daily level identified
TP2: 100 month SMA
Is RY forming a head-and-shoulders?* Big support between 125-127
* now reaching previous resistance (135) from November 2022
* It broke through this before (February 2023) but retreated back to support.
* Will it rally to a new high or stall out?
Honestly I don't know. Would love to hear your comments.
NYSE:RY TSX:RY

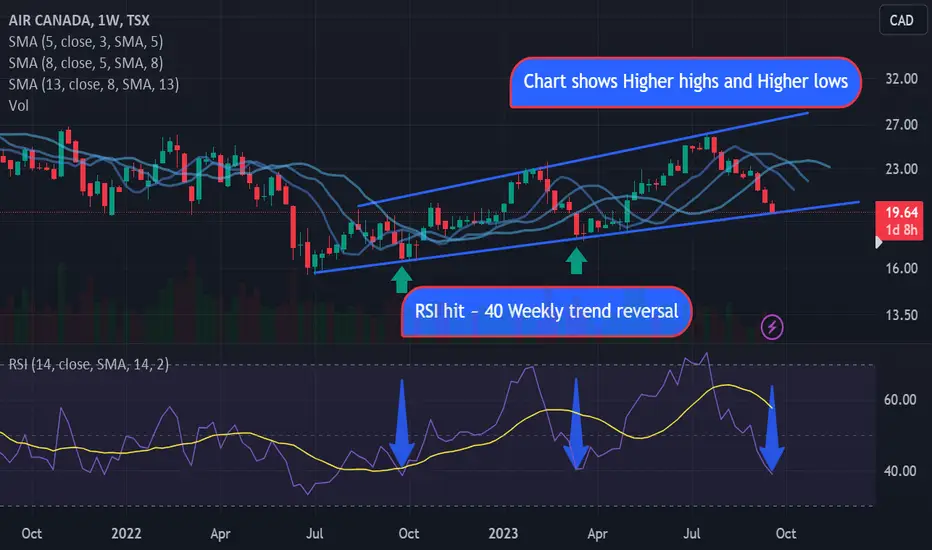
Air CanadaLooking juicy.
Weekly chart shows higher highs and higher lows, and when RSI hits 40, reverses trend from down to up.
Broader marker is the only unknown, and will get in when weekly shows consolidation.
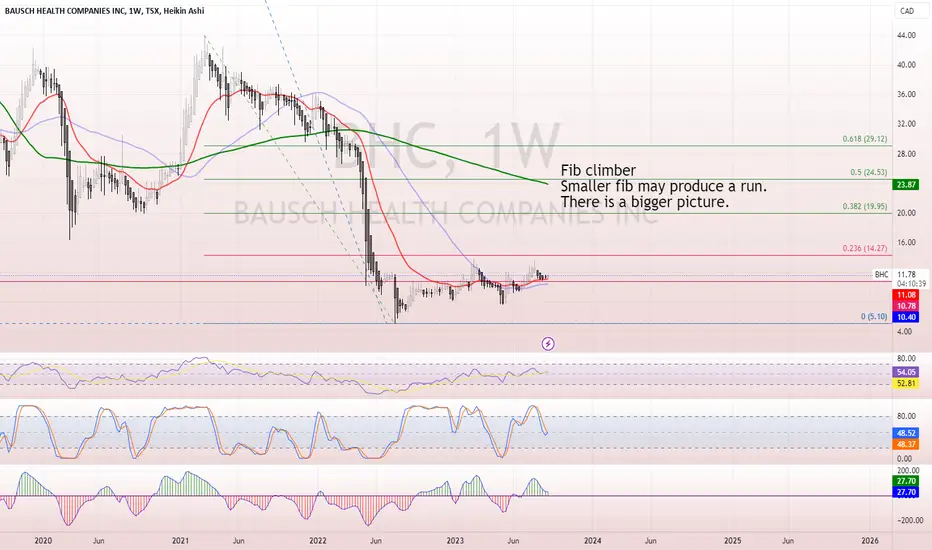
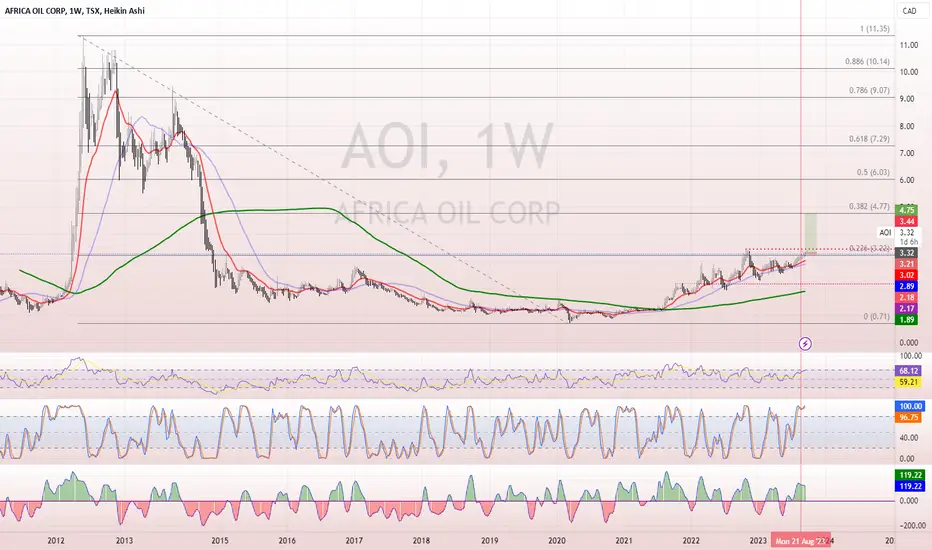
AOI LongWe have held the 236, targeting the 382. My main concern with this trade is the recent high. I've allowed some wiggle room for a retest. Usual stop loss MGMT of taking profit in 3rd's and riding weekly HK candles.
I've got a golden ticket.There is no place I know that compares to pure imagination. Living there, you'll be free, if you truly wish to be.
Risk to Reward Ratio is the key to constant wins at tradingI love writing those articles on my Blog, mainly because I learn from reviewing my trades & secondary for the value it gives back to the trading community.
I been preaching Trading is simple but not easy. It is based on following a winning trade plan. & how do you find such a plan? Try & fail, Try & succeed there is no other way. There is the possibility of a generous soul teaching how a winning strategy & thats what I hope to do in this article. I will share 2 rules
Rule number 1 Always trade the bigger picture.
Find out what the bigger picture chart is doing & trade based on that. In this trade am placing my trade decision in the (W) chart the top chart in white. My bigger picture chart is the monthly (M) not shown. And the chart I use to time my enter & exit is the Day chart (D) below in Black
Rule number 2 Risk to Reward ratio,
This should be rule #1 but I placed it as number 2 to add importance to the rules of trading the bigger picture. Aim for a Risk to Reward ratio of 3 to 5. This means you asses the Risk (how. much money you can loose) before you asses the Reward (how much money you can win).
In this trade, the bigger picture chart (M) is in a downtrend. The trading chart (W) comes into untested Supply Zone (SZ) with a Risk of less than a dollar. I take my SHRT in the red Circle
The reward is 4-5 dollars per share, mostly due to a price free fall zone, with little Demand zone (DZ) to challenge the price. I took profit at two point marked by the red X in the Daily chart.
There are odd enhancers as to why I took this trade, but they are outside the scope of this blog. If you like to learn more about my winning trading strategy that I been practicing for 11 years. Follow my Blog & learn to trade smarter.

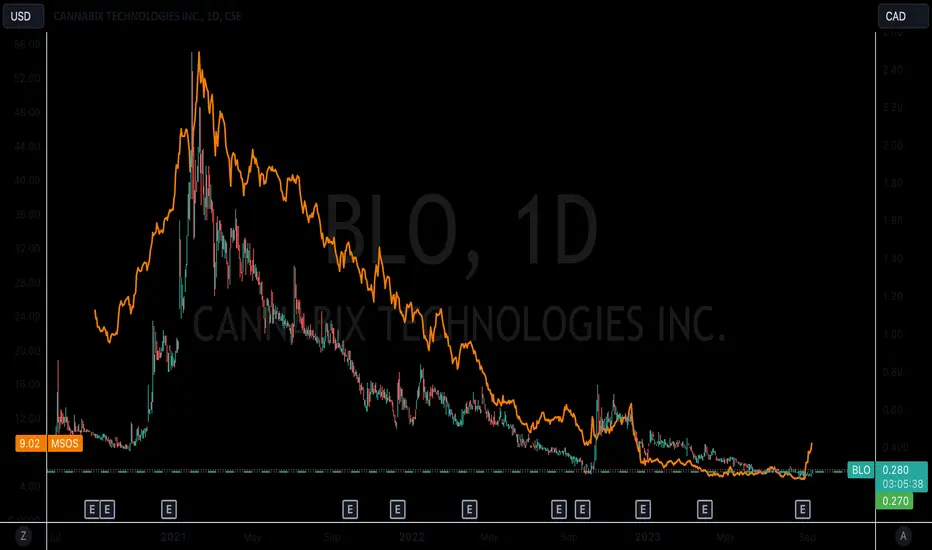
Marijuana Stocks Running, is BLO next?Marijuana stocks have been ripping lately.
There's a correlation between MSOS and Cannabix Technologies.
Will the next boom happen with the marijuana breathalyzer stock?
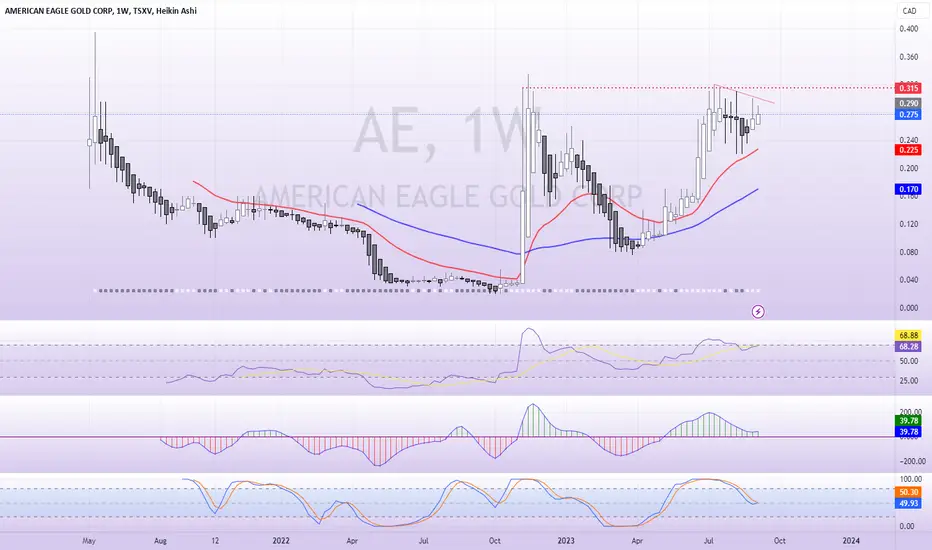
AE at challenging levelWatching here to see is AE can break through this level. MA's are there for support on 4 hr.
BHCA little sideways still on the 4 hour, watching here to see if we can get moving, 4 hour STOCH RSI alarm set.