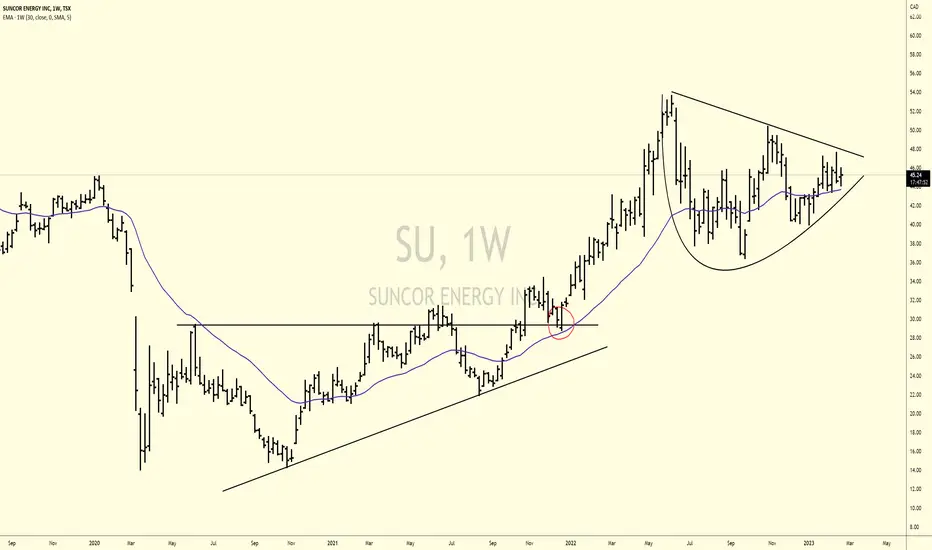
Squeezing should resolve in weeksUnlike oil price, which is in a bear flag, Suncor is squeezing bullishly in my opinion.

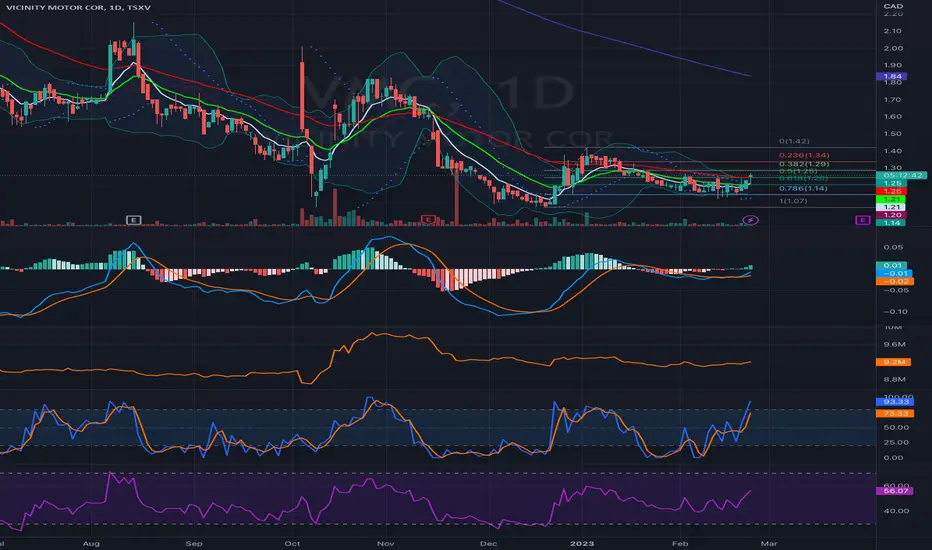
EV Bus & Truck Manufacturer | BB Squeeze BreakoutA good chart setup for a potential breakout after a series of positive news releases. $55M valuation is low for the sector.
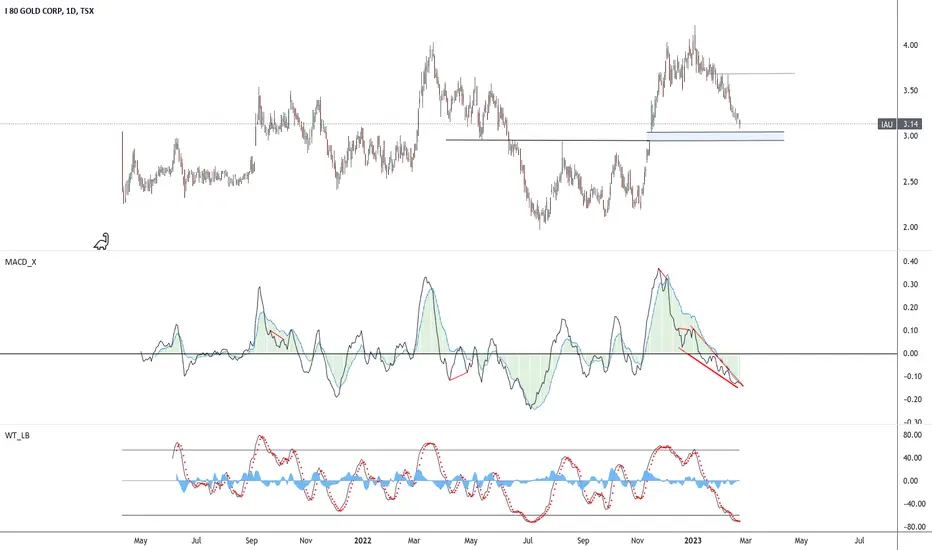
i-80 gold65 million secured for exploration. Sprott biggest holding, One mill to pull stock from 4 pits in the works, similar to Aris Gold style.
EXRO, LONGI have waited in the bushes for a long time , AND not once but twice before I have chased the notorious EXRO beast but my claws missed him, or her lol , but this time is different , this time we are in a confirmed stage 2 mua ha ha , feel my CLAWS .

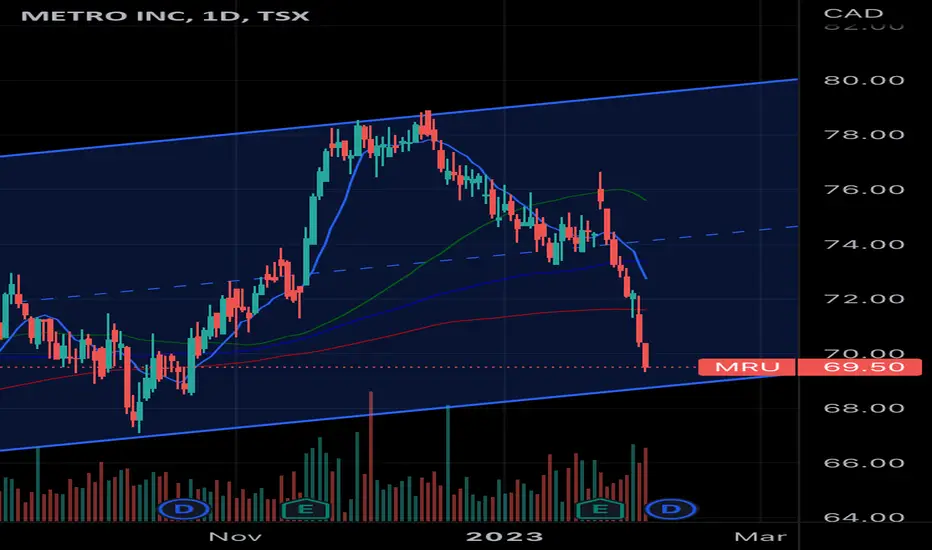
BNS Momentum Trade " After Earnings"TSX:BNS
After we are clear of earnings, I'll be looking for the price to pull back to the Nov 28 resistance of 71.50 near the 50 SMA and 50 EMA (old resistance becoming new support). If we can get confirmation with a reversal pattern double/ triple bottom or inverted Head and Shoulder, I'll be looking to enter with Real Life Tradings momo indicator.
Stop loss will be placed just below the reversal pattern and the target will be at 100 WMA near $79.00.
I have a few concerns with hitting our target:
1) We might have the 200 SMA as resistance.
2) If The 50 WMA backs up the current resistance at 74.30.
If we are able to break through both resistances this could be a good 2.5r - 3 r trade.
If we fall through the 71.50 level, I'll be looking for a similar setup at the 69.00 and 65.00 areas.
Remember to always manage your risk when trading and have a stop loss.
Happy trading!

The fun is about to startThe fun is about to start The fun is about to start The fun is about to start

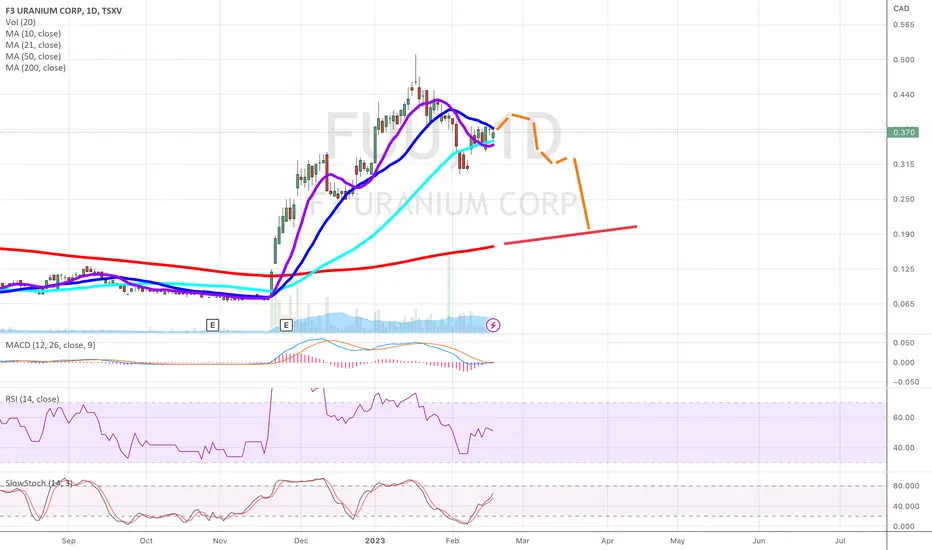
Head and Shoulders Topping PatternThere is a head and shoulders topping pattern in F3 Uranium. I'm expecting a big pullback. Uranium isn't going to the moon just yet. It is more of a long-term play that may take 6 months to a few years to start doing something major.
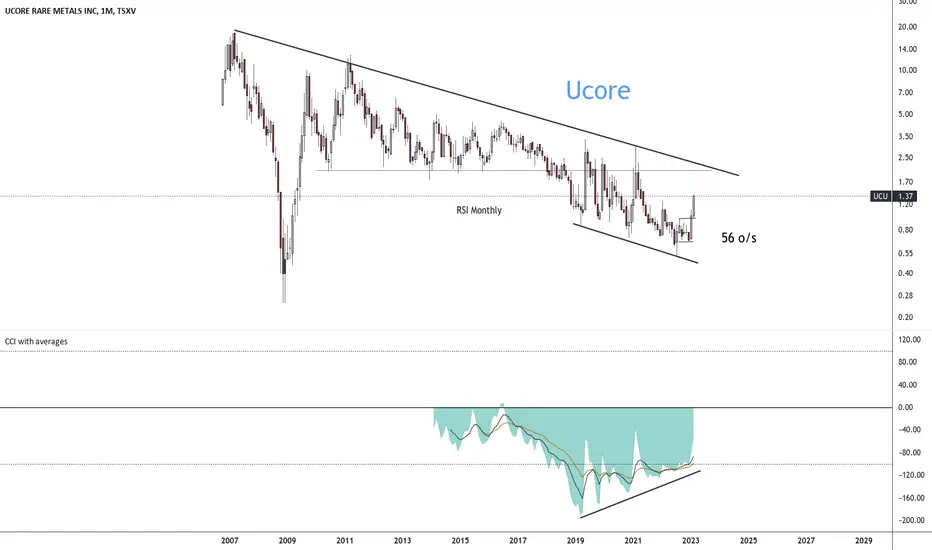
Ucorerare earth plant in the works, supply from Alaska. Patented quick recovery system. Share consolidated a while ago. North America needs supply as Chinaman bad now....
GOLDEN CROSSToday, Medipharm Labs's 50-day moving average line crossed above its 200-day moving average line, forming a GOLDEN CROSS, a STRONG BULLISH signal.
Today, the stock went up by 13.33% on more than 4 times average daily volume.
Tradingview's technical analysis summary is BUY:
tradingview.sweetlogin.com
GLTA!
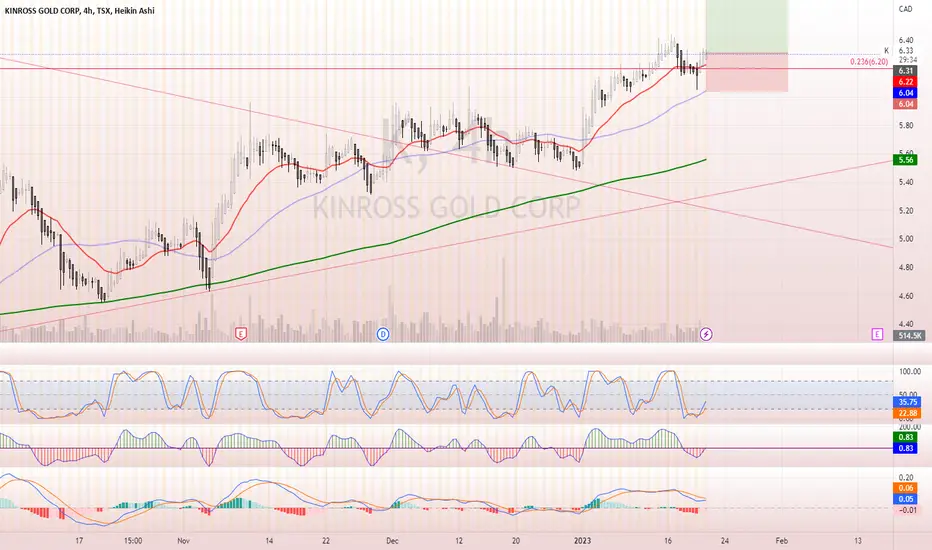
K LongEntry here on Kingross Gold. Looking for a run up the fib ladder, expecting a stop at the 200 weekly.
EMX is presenting an opportunity Major lone term support line dating back to 2017.
thoughts & Information is on the chart.
This is Not financial advice.

Imminent price action reversal for Canopy Growth CorpCanopy Growth (CGC/WEED) currently in a bear flag pattern. Watch for confirmation/invalidation over the next few days.

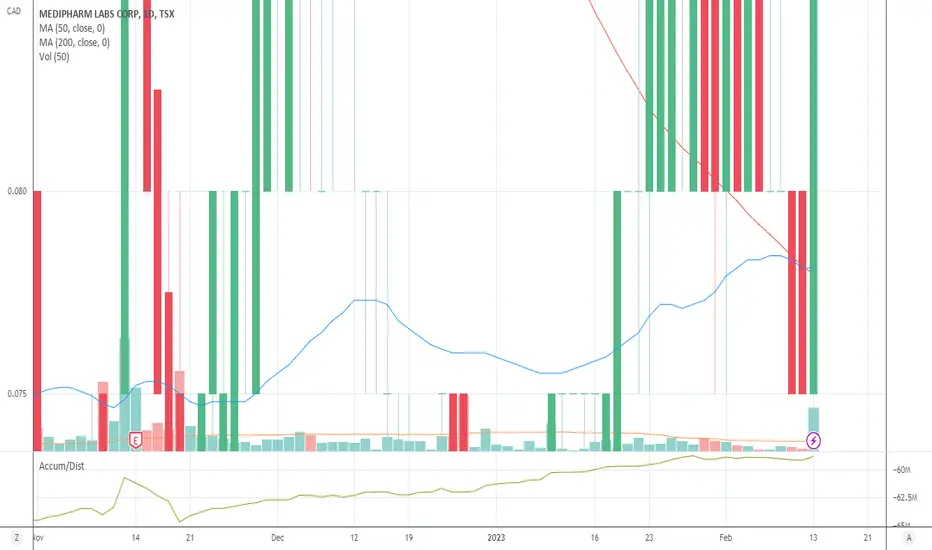
IMMINENT GOLDEN CROSSMedipharm Labs's 50-day and 200-day moving average lines are a quarter of a penny from forming a GOLDEN CROSS, a strong BULLISH signal.
Extrapolation of these lines strongly suggests that they might form a GOLDEN CROSS this coming week.
Also, the Accumulation/Distribution indicator has clearly been trending upwards.
Tradingview's current technical analysis summary is STRONG BUY: tradingview.sweetlogin.com
GLTA!

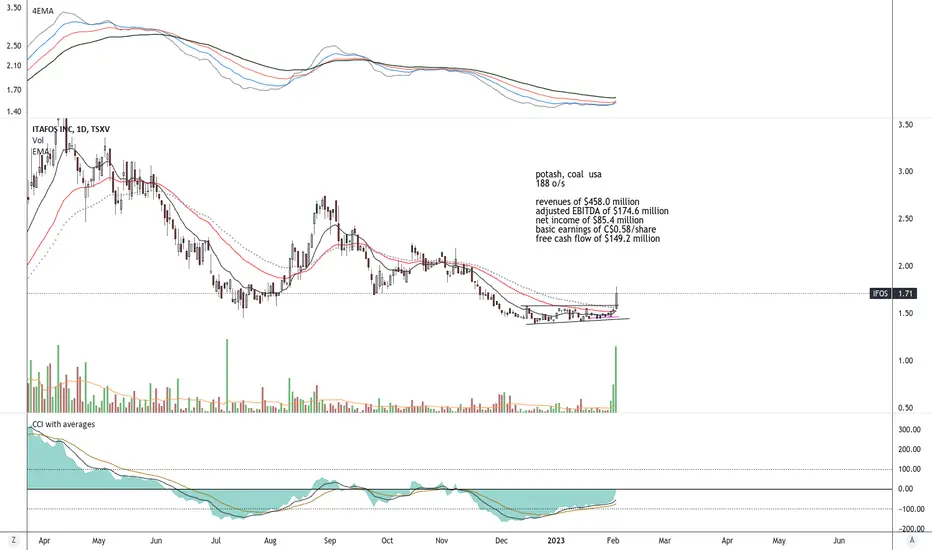
Cash flow positivewhatever happens in the bull market for precious metals, this company will always be cash flow positive and growing.
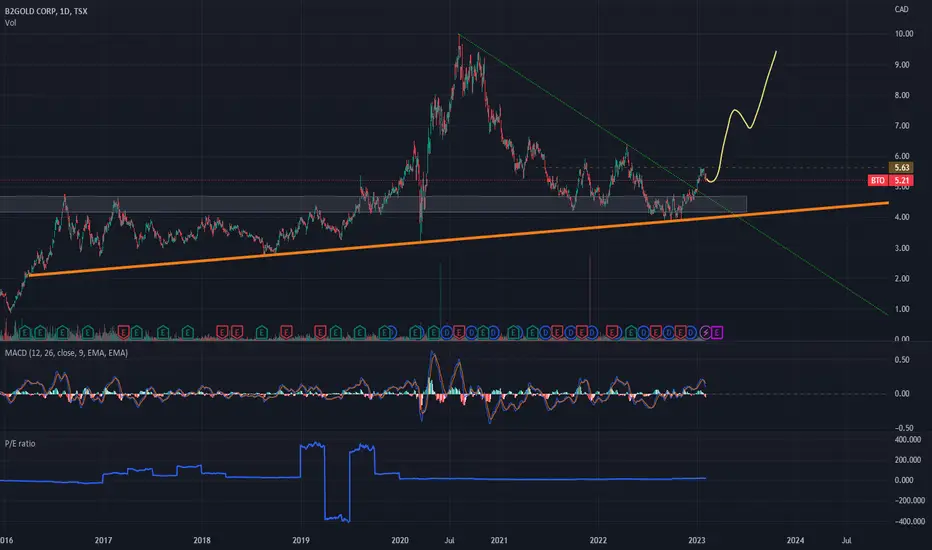
Long triangle patern brokenAccording to P/E, averaged, targeting price just shy of 10$. Strong res broken.
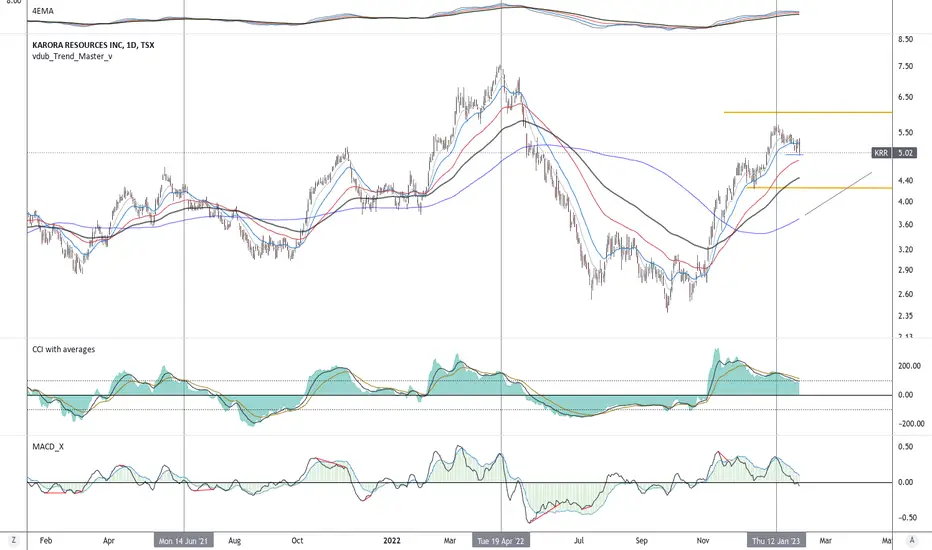
7% safe betEach wave looks to move on a monthly basis. If you pick the lower and and sell at the centre of the channel it’s about a 7% gain
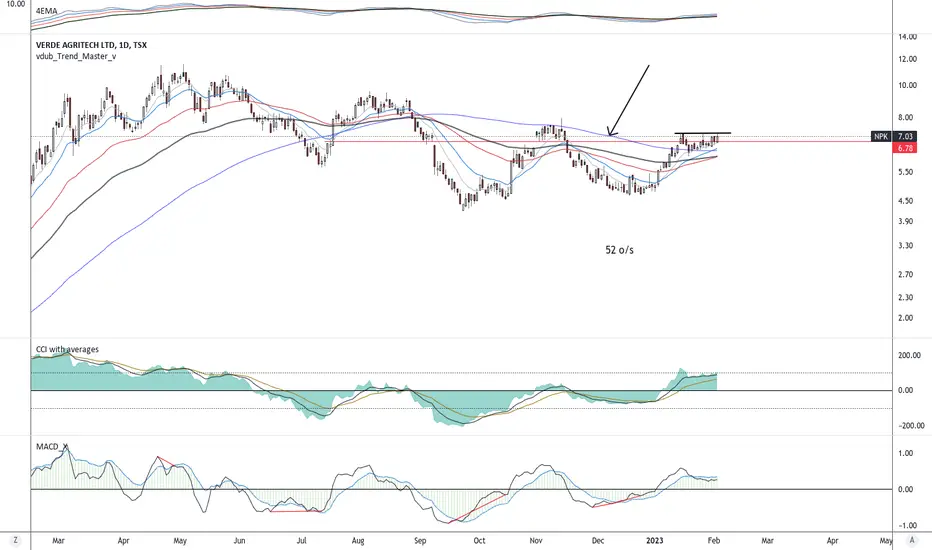
NPKBrazil fertilizer with huge expansion. price over the blue line is what ya want to see. Low float, 52 million shares.
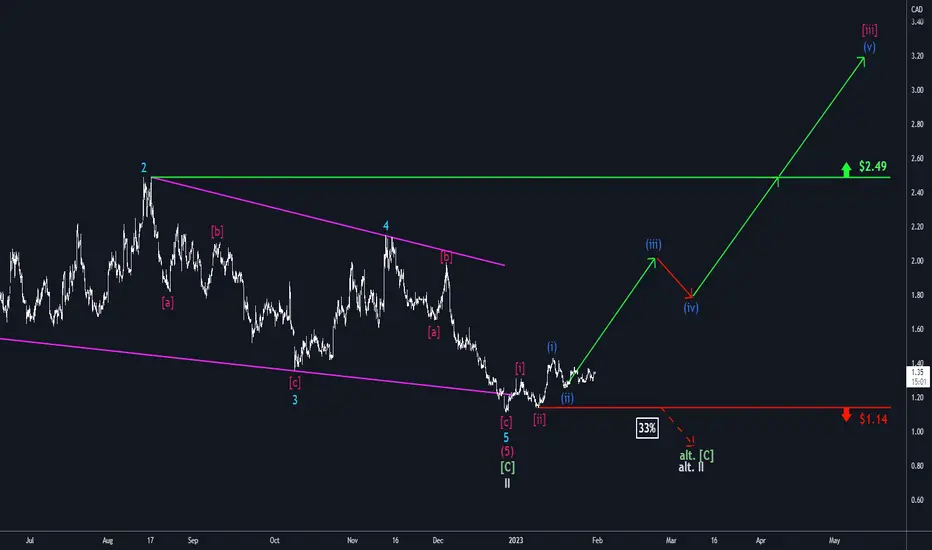
Aurora: Sleeping Beauty 👸It's time to activate our wake-up call to get Aurora back into motion, since we expect the course to rise up North, even though it is still creeping sideways momentarily. In our alternative scenario, there is a slight probability of 33% that the course could drop below the $1.14 support line instead. In this case, it would continue to move South until it reaches the low of the grey wave alt. II. Primarily, the stock should make the climb and fulfill the blue wave (iii) before dropping into a correction of the blue wave (iv). Once completed, the course should have gained momentum to be able to exceed the resistance line at $2.49 and wander further North in order to complete the pink wave .