POTENTIAL GOLDEN CROSSAn extrapolation of MEDIPHARM LABS' 50-day and 200-day moving average lines suggests a GOLDEN CROSS should take place early next year.
According to The Globe and Mail, the target price for LABS is $0.10:
www.theglobeandmail.com
This represents a 20% upside potential.
GLTA!

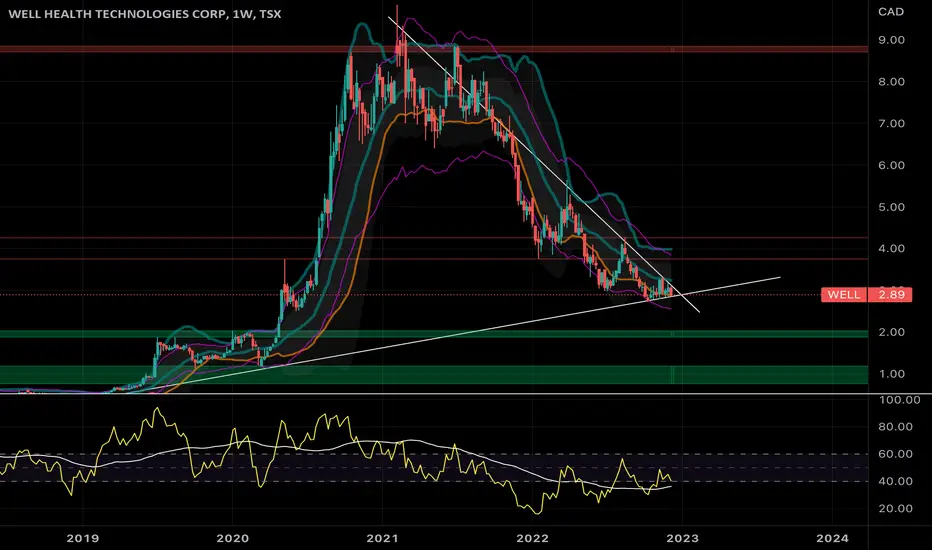
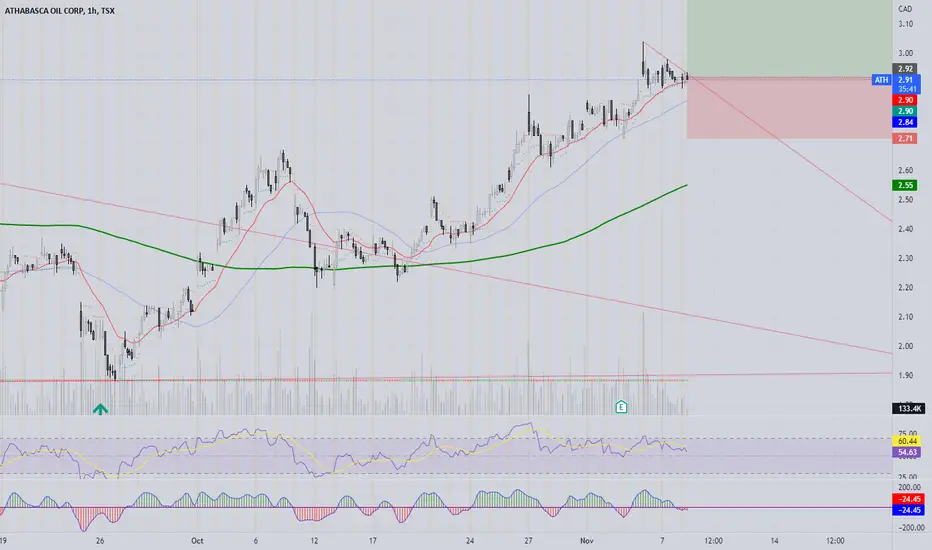
Well - Buy at 2 and below and sell at 4My idea for this small CAD company. Give me your thoughts. Mine is buy below 2 sell around 4. look for reversal.
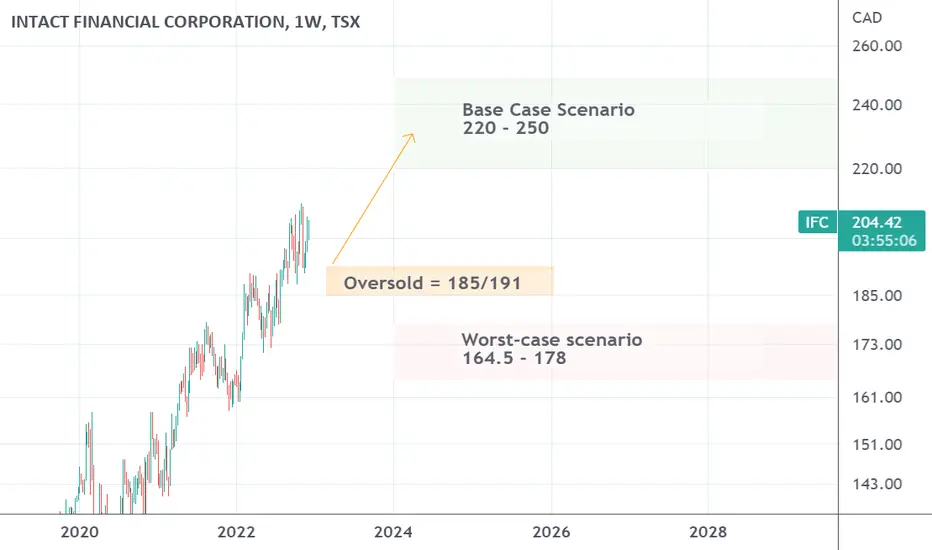
IFC is likely to keep pushing higherIntact financial stock price has been resilient and clearly maintained its upward momentum. IFC stock’s average yearly returns are almost 12.7% which makes sense given its low volatility.
Shares of Intact financial is likely to continue upward trend toward a price range between 220 and 250 by the end of 2023. If price falls between 184.8 and 190.5 it would make an attractive buying opportunity.
The worst-case scenario is to see IFC stock price trades between 165 and 178 by the end of 2023 which is a decline between 10 to 20% from current level.

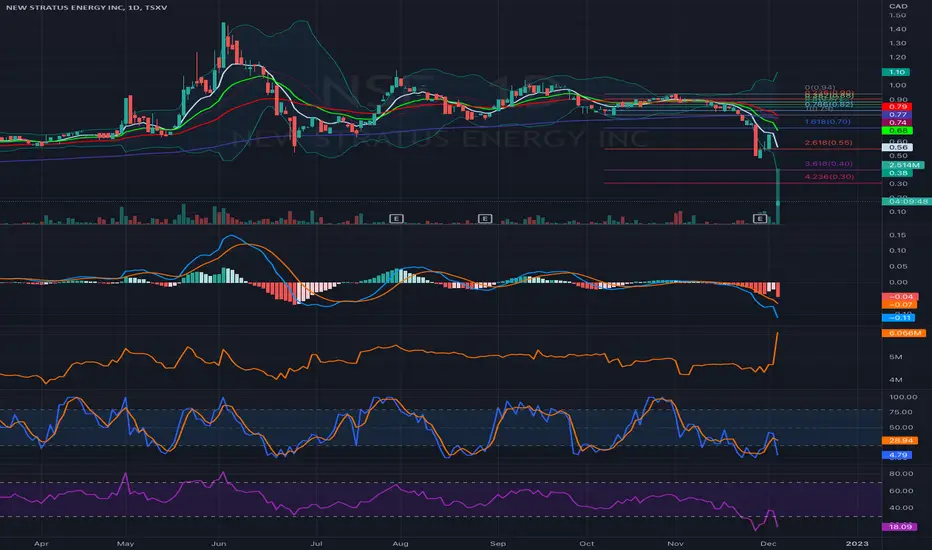
Arbitration related selloff; company has .30/share in cashCurrently trading at .175 and has .30/share in cash. Arbitration related selloff.
WEED looking good, double bottom on Renko + logPurely technical, haven't done fundamental analysis on the sector. Double bottom on Renko + log. Renko for noize reduction and log should also give a nice boost if this probability plays out.

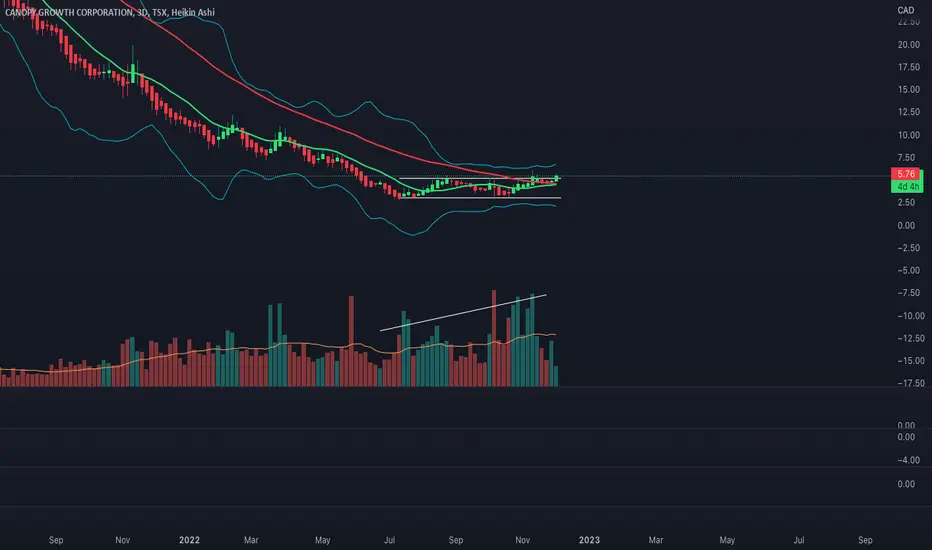
POT Stock WeedWEED chart on the 3D time frame.
-Weed looking good here, imo. 3D 13/48 MA cross imminent, but 48MA not yet turning up
-Bollinger squeeze in progress, nice channel
-Volume increasing
These are the technicals I look for.
None of this should be interpreted as financial advice, I am not a professional or certified financial adviser! all charts, and or analysis' are my personal opinions and observations only!
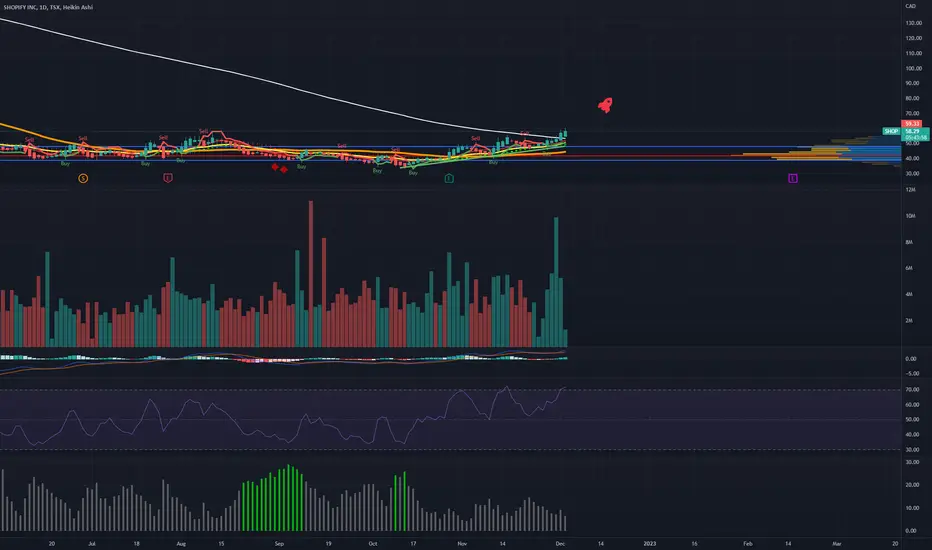
Way oversold, not too late to enter! TSX:SHOP is looking excellent for further upside. As inflation continues to drop, expectations for rising rates will also continue to drop. This is bullish for high growth stocks like SHOP. We are now above a key level (200 Day SMA), which often is the beginning of a technical bull market. Although I started my position a month ago, this stock is still tremendously oversold on the longer term charts and still has a lot of long-term potential for growth. I believe it's one of the most unfairly treated stocks this year by far on the TSX. The risk/reward looks favourable over the coming weeks and months, and the downside risk is now much lower than when inflation was continuing to climb every month.
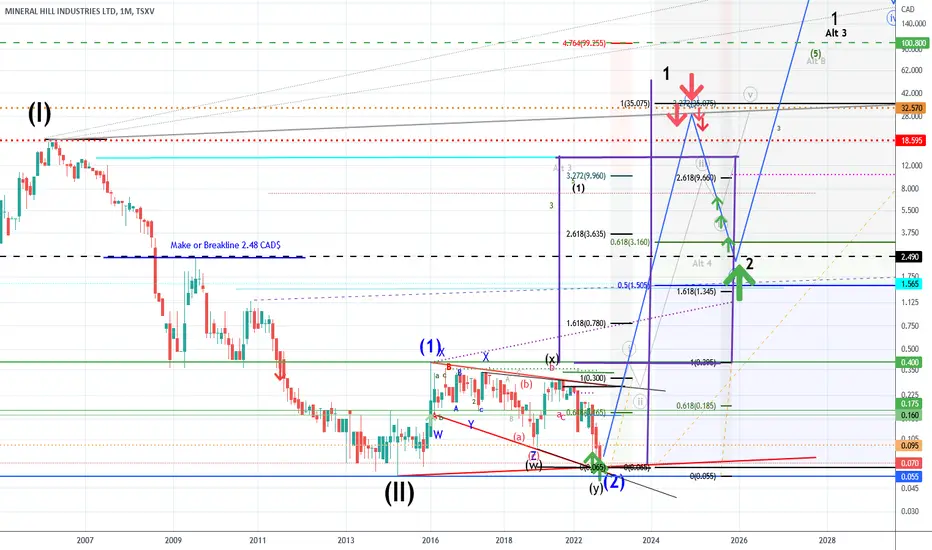
Mineral Hill Industries Long A possible traders dream within a complex wave (2)
This is no advice to buy or to sell a stock. Every investor is acting on his own risk. Stocks can rise or fall.
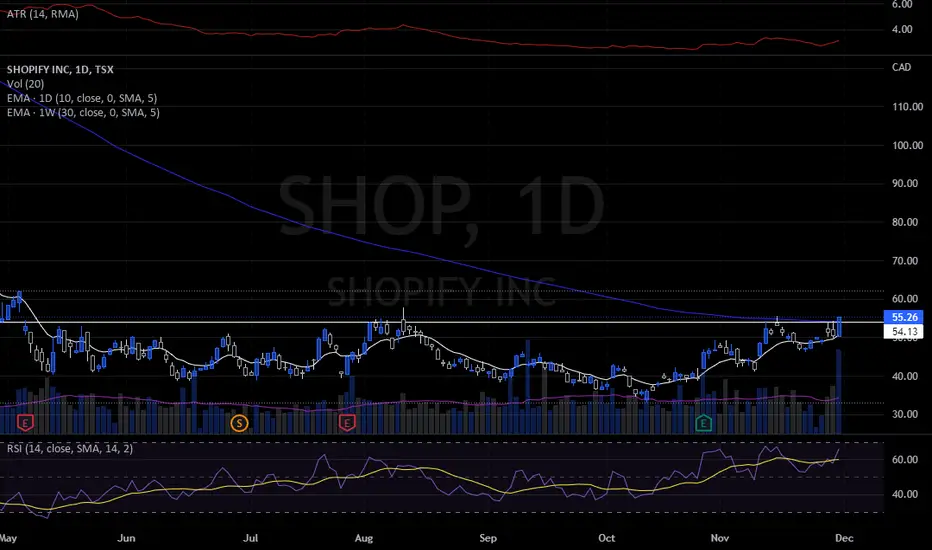
Shopify breakout long!Shopify looks like it is breaking out of a long-term base, this is the price action from the TSX, slightly different on the U.S. side. Moved above the 30 week average on very high volume today.
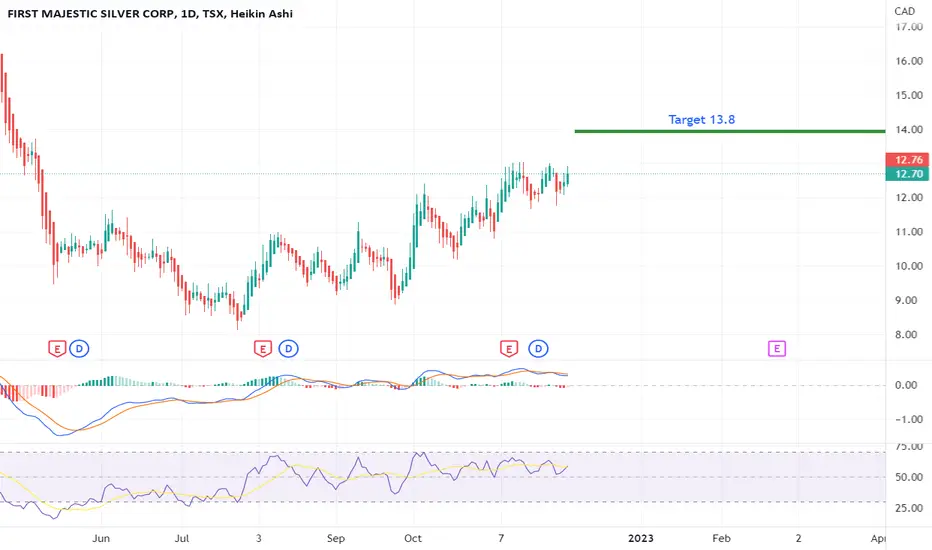
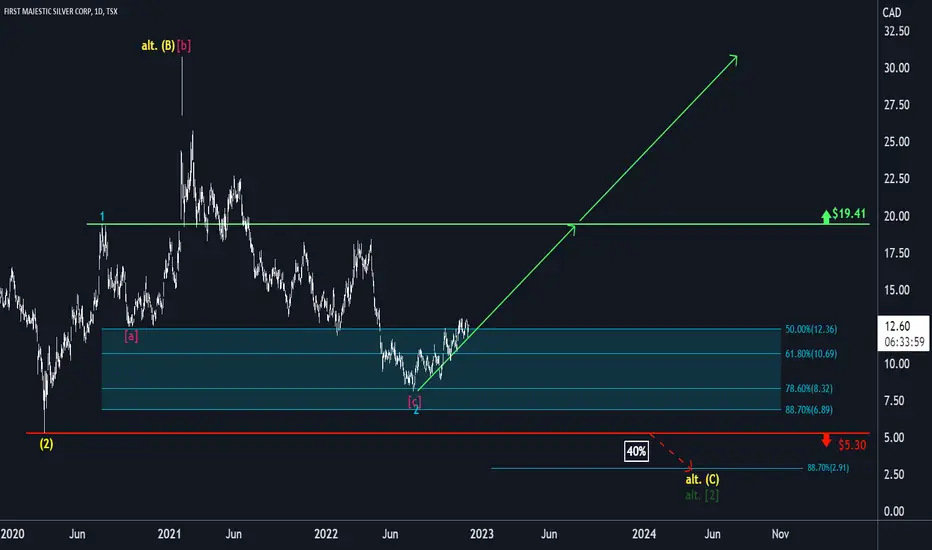
First Majestic: Time to Say GoodbyeFirst Majestic is currently paving its pathway to leave the turquoise target zone between $6.89 and $12.36 for good, to wander above the resistance line at $19.41 and resume the upwards trend further North. Our alternative scenario displays a 40% chance for the course to drop below the support line at $5.30 which would be continued with a downwards slope around the $2.91-mark to complete the dark green wave alt. .
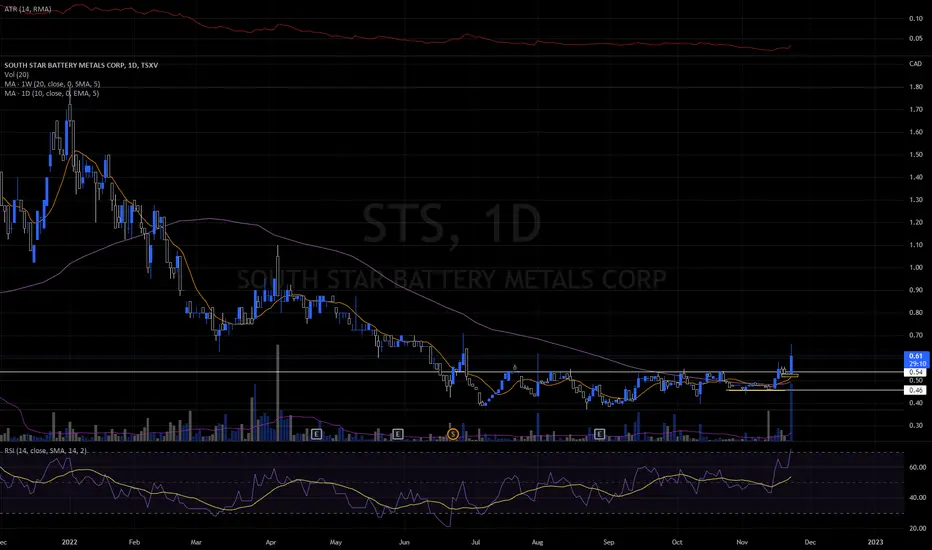
STS BreakoutSouth Star Battery Metals (STS) breakout with high relative volume and relative strength. Has moved over upper resistance after a long base period over the 30 week moving average above the 10 day EMA.
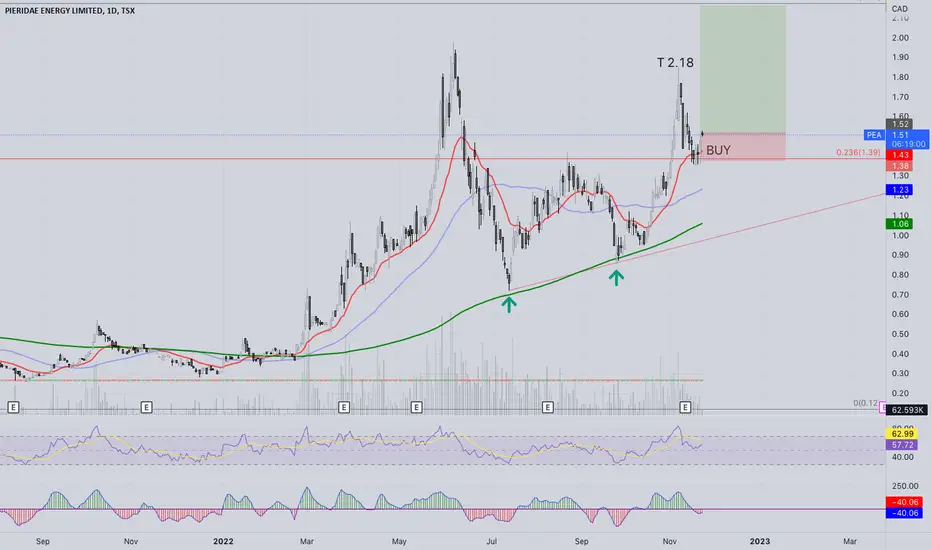
PEA entry longLooking for a ride up the ladder on this one, looks to be holding the 236 fib level. Everything is pointing up.
Possible failure would be at the previous highs. If we fail there the bottom of the triangle could be tested.
Usual SL mgmt. Trail SL on Daily and weekly 50:50.
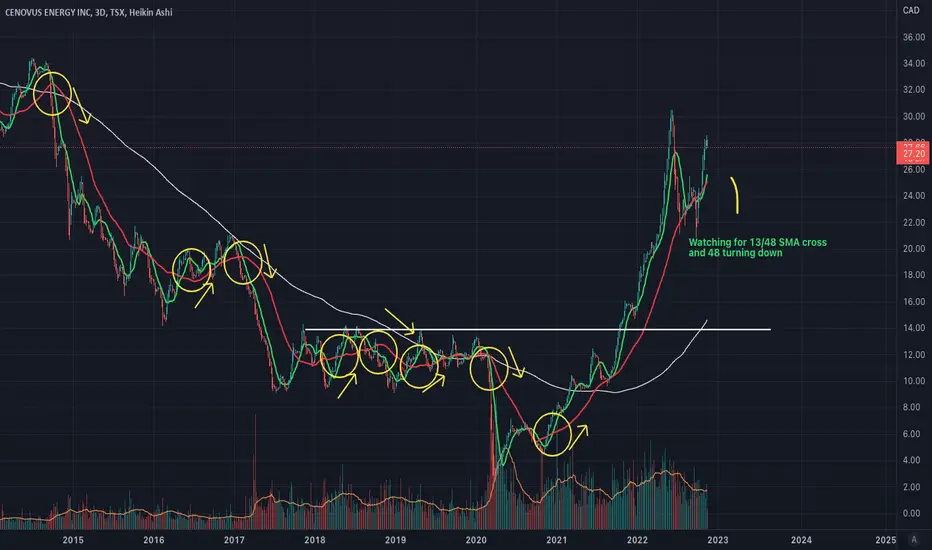
Cenovus Energy INC.CVE price chart analysis on the 3Day time frame 2015-Current.
In line with my "Keep it simple stupid" philosophy, my trend analysis shows that when the 13 SMA crosses the 48 SMA, it is a notable occurrence, possibly indicating a change in trend upcoming. My buy or sell decision occurs when the red 48 SMA turns down (Bear) or up (Bull). This simple strategy shows me possible % gains if playing various long or short market equity instruments and entering/exiting the trade near or at these occurrences. Included is the 200 SMA line.
My method of trading this ticker is to buy or short 100% of my position at the 13/48 SMA crosses (with 48 pivoting up or down) This helps my probability of success and risk factor. Using this method and resulting in 8 trades short and long, I could possibly have made around 75% gain on the downside since 2015, and an additional approx. 400% gain on the long side since Jan. 2021 had I been selling at these level. Normally I would be still holding the position until a new 13/48 SMA cross down (so return would be less). The support line is included around $14/sh mark for interests sake, as price would most likely bounce around there for a bit imo.
I could also add other indicators such as custom buy sell signals and or MACD, RSI, SAR to assist my decision making but the trend based idea keeps me grounded in the trade.
I generally use Heikin-Ashi candles for simplicity/clarity and also remove the wicks.
None of this should be interpreted as financial advice, I am not a professional or certified financial adviser! all charts, and or analysis' are my personal opinions and observations only!
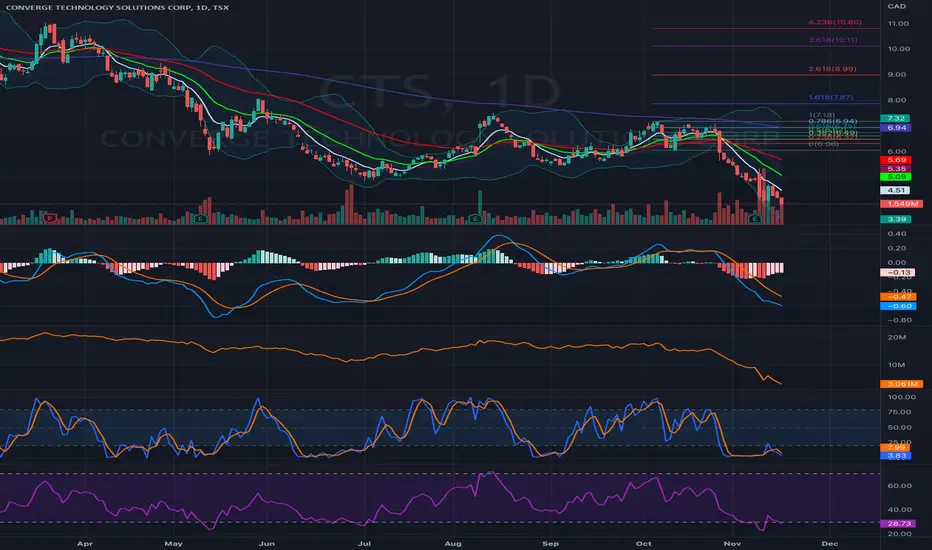
Oversold, undervalued, $10 analyst price target, insiders buyingOversold likely due related to tax loss selling. Solid Q3 financials. Large insider buys. $10 price target from Scotiabank analyst.
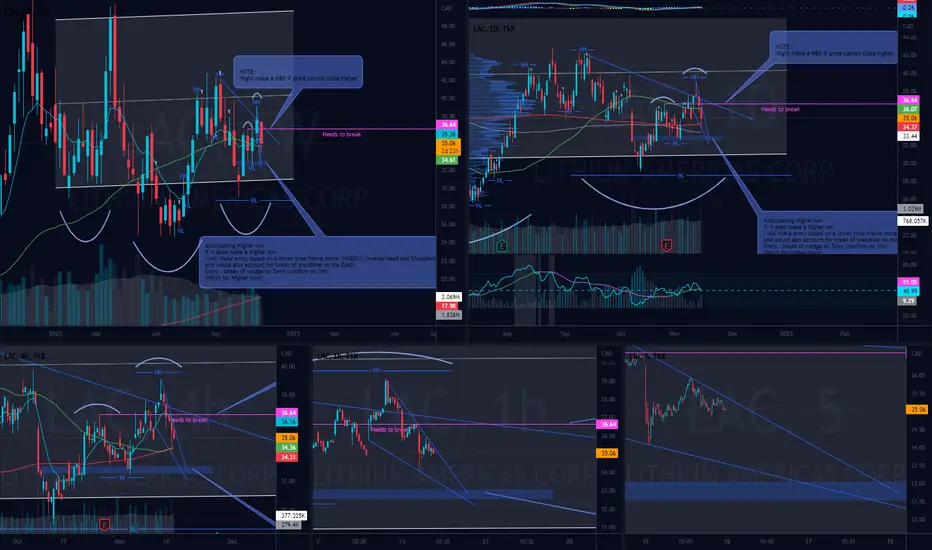
LAC (tsx) Weekly Inverse Head and Shoulders idea Possible Weekly Inverse Head and Shoulders . Detailed Description in Chart
Waiting for break of wedge on higher time frame for entry but watching to move higher than making a Right shoulder on a possible Head and shoulders (daily chart). Watching for Higher lows on higher time frames. Overall though is could move to top of channel on weekly. Risk management is paramount in this market, trade what you see and profits are profits even if they're small!
Caryon chart art, do we buy because Peter Schiff tells us to?Ascending broadening wedge yet apparently the bottoms are in!
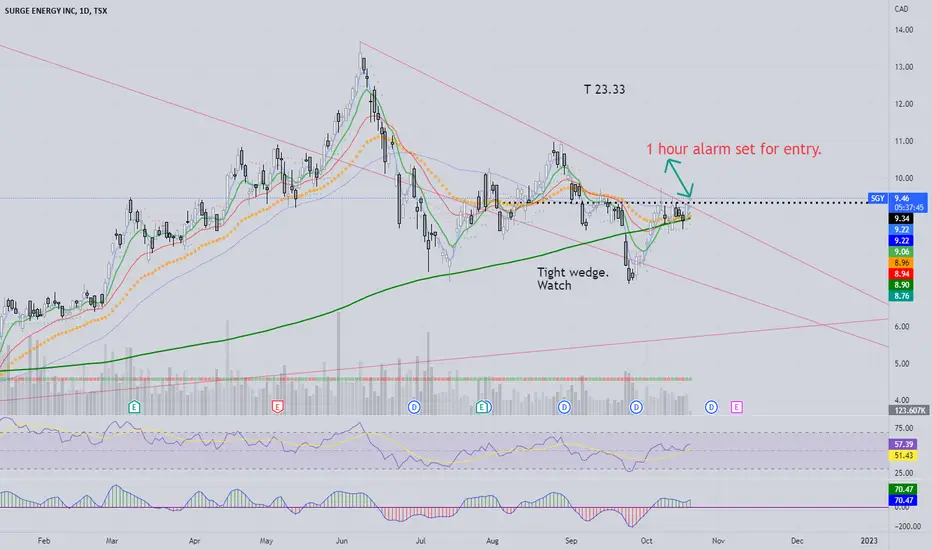
SGY LongAlarm set here for small pullback on 1 hourly. Broken through diagonal trend line. Target at major236. Will update on entry.
Weed stocks downtrend may break. Very early to tell and all breakouts at some point look at bit like a double bottom, but this looks a bit like a double bottom.
Been wanting to buy weed stocks since the high and all the way down. I think cannabinoids have many potential benefits and may be an important industry. Just didn't make sense while it was in a speculative bubble and didn't make sense when it was winding down that bubble in a protracted downtrend.
I think we've now reached a point where there's good RR on the long and we have a fairly reasonable way to define a stop betting on the double bottom formation.
