H+H International A/S | Chart & Forecast SummaryKey Indicators On Trade Set Up In General
1. Push Set Up
2. Range Set Up
3. Break & Retest Set Up
Notes On Session
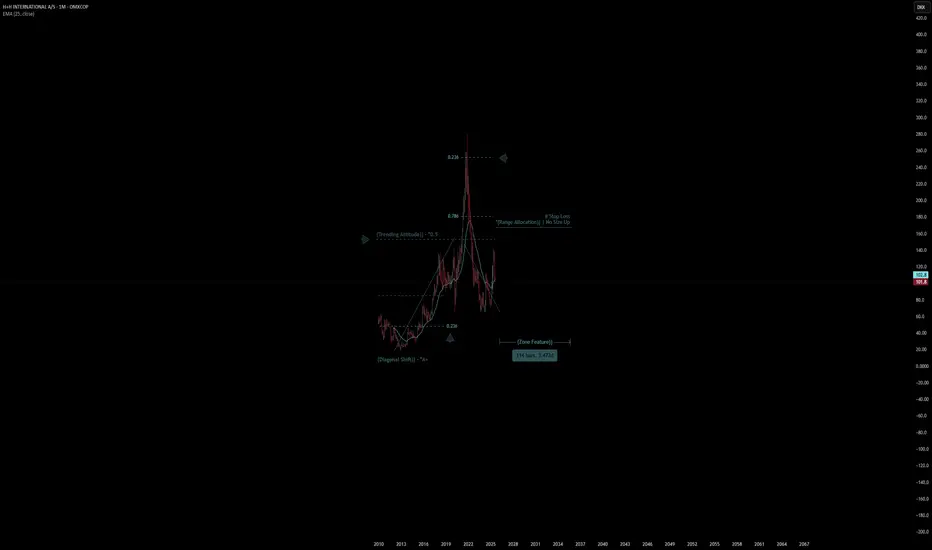
# H+H International A/S
- Double Formation
* (Trending Attitude)) - *0.5 - *Retest & Entry - *25EMA | Subdivision 1
* (Range Allocation)) | No Size Up - *Retest Area | Completed Survey
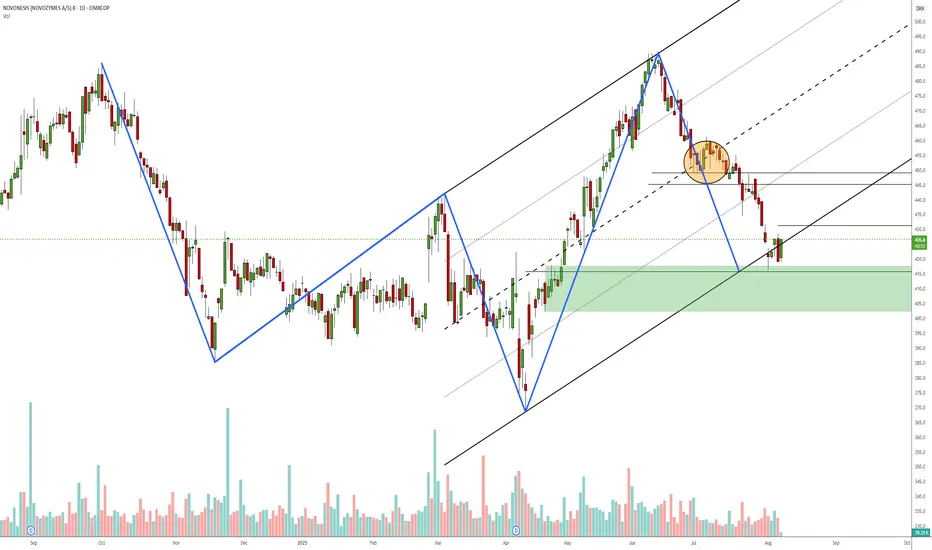
Novonesis daily reversal?Measured move / 3-point channel to test of failed symmetry zone. Might take 1/3 off around 445 depending on PA. I might add to the position if the bearish ab=cd at 431 fails and I'll be looking to take the loss if it drops below 400. Haven't used harmonic patterns for a long time, but this does rese
NovoNordisk, LT dirt cheap | GLP-1 a misunderstood growth marketNovo Nordisk stock has lost quite some weight since the release of Eli lilly's drug Zepbound and Mounjaro and since the rise of compounded, or generic copycat GLP-1 alternatives. The growth of the company has slown down a bit, but the overall GLP-1 market growth is still impressive and misunderstood
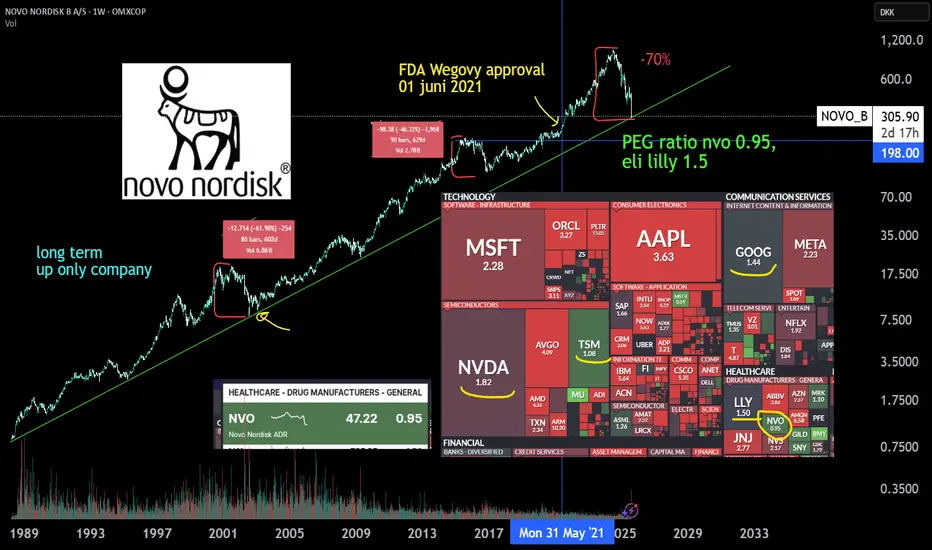
If you want to buy NOVO.....A follower asked for my opinion on this stock which he said many are shorting this and asks if he should be a contrarian instead.
I do not own this stock and has no intention to at this moment but just looking at the chart, here's my 2cents :
1) price has fallen by 70+% from the peak from June 202
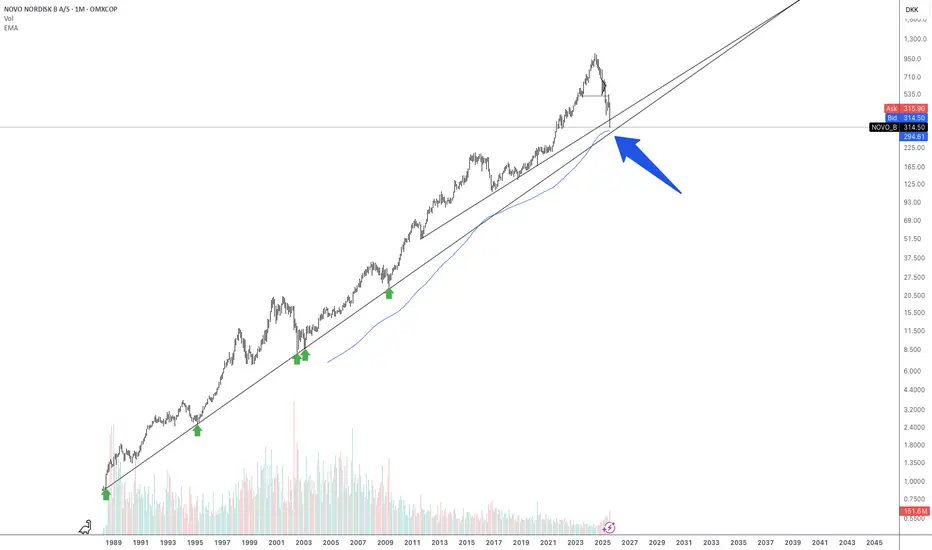
Novo Nordisk, generational buying opportunity? Novo Nordisk is currently experiencing one of the largest drawdowns in its history, primarily triggered by a downward revision of guidance for FY25 and FY26.
Focusing strictly on technical analysis:
For the first time, the monthly 200 EMA is serving as a key support level for Novo Nordisk -
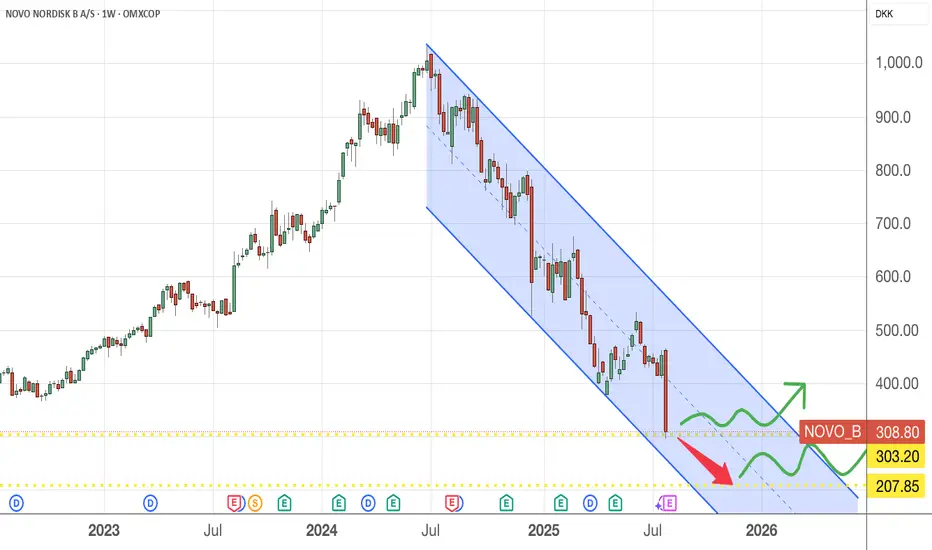
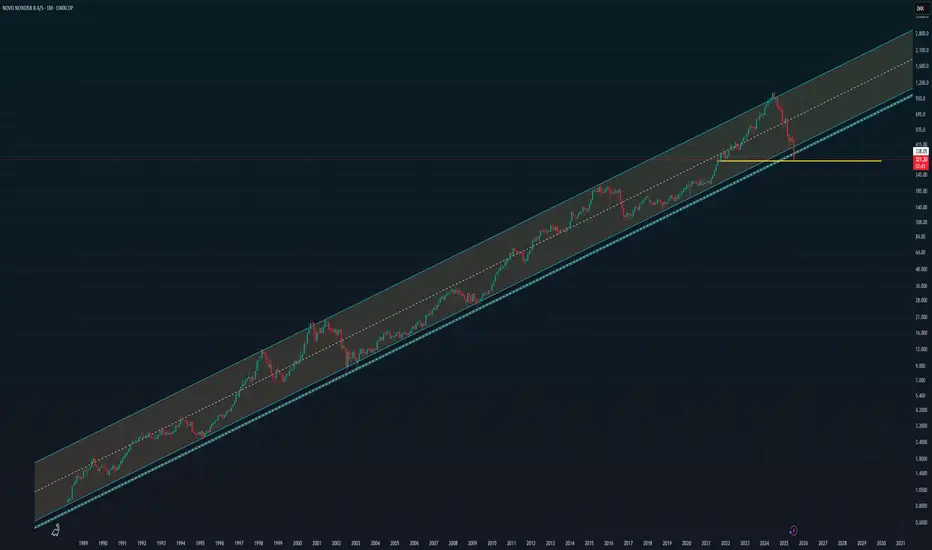
$NOVO_B updated channelNovo Nordisk has had a tough time over the past 13 months, with its stock falling significantly. The main reason is growing investor concern that the explosive growth in sales of Wegovy and Ozempic may be slowing down, especially as competition heats up — particularly from Eli Lilly. Just a few days
NOVO potential enter zoneThe stock is trading inside a major monthly “BUY ZONE” (DKK 280–325), which aligns with historical Fair Value Gaps (FVGs) from 2015–2018.
A Higher Low (HL) structure has formed, and as long as it holds, the long-term bullish structure remains valid.
Multiple FVGs have now been retested, suggesting


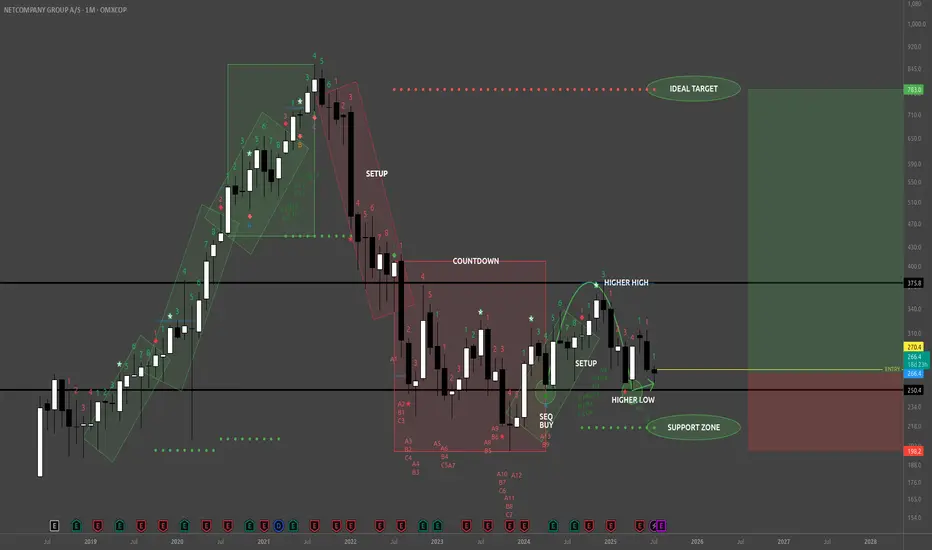
NETC - BuyReading the NETC Monthly chart from the left to right look at that remarkably strong bullish trend (green rotated rectangles) which spanned 3 consecutive TD 1-9 Setups. That's 9 strong months of uptrend culminating in the beginning of the bearish trend with a TD Sequential 13 Sell signal at the apex
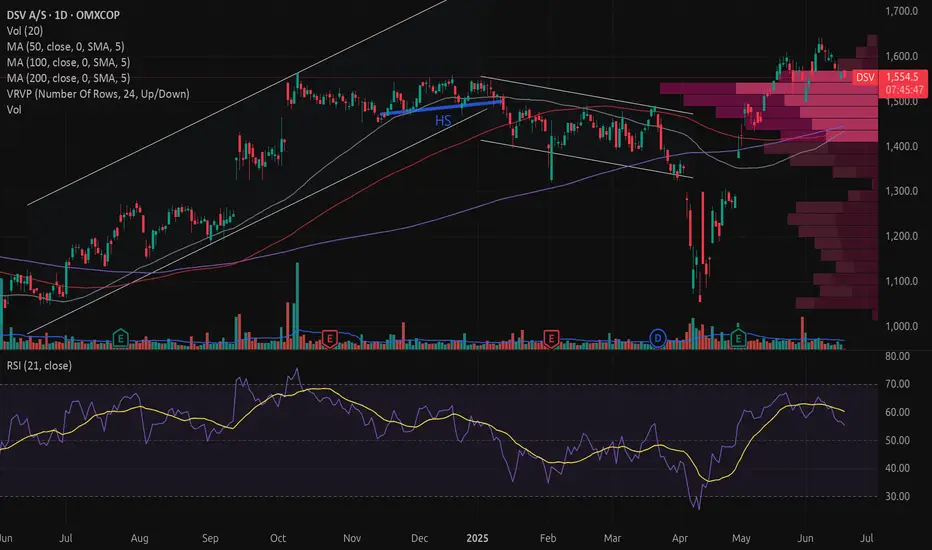
DSV – Potential reversal after break down from uptrend
DSV was in a rising trend but formed a small head-and-shoulders formation (HS), which led to a negative breakout. In the following three months, the price development can be interpreted either as a rectangular consolidation (REC) or a short-term downtrend. The price then dropped sharply to a pointe
See all popular ideas
Community trends
Stock collections
All stocksTop gainersBiggest losersLarge-capSmall-capLargest employersHigh-dividendHighest net incomeHighest cashHighest profit per employeeHighest revenue per employeeMost activeUnusual volumeMost volatileHigh betaBest performingHighest revenueMost expensivePenny stocksOverboughtOversoldAll-time highAll-time low52-week high52-week lowSee all
Sector 10 matches | Today | 1 week | 1 month | 6 months | Year to date | 1 year | 5 years | 10 years |
|---|---|---|---|---|---|---|---|---|
| Health Technology | ||||||||
| Finance | ||||||||
| Transportation | ||||||||
| Consumer Non-Durables | ||||||||
| Process Industries | ||||||||
| Producer Manufacturing | ||||||||
| Non-Energy Minerals | ||||||||
| Utilities | ||||||||
| Consumer Durables | ||||||||
| Commercial Services |