H+H International A/S | Chart & Forecast SummaryKey Indicators On Trade Set Up In General
1. Push Set Up
2. Range Set Up
3. Break & Retest Set Up
Notes On Session
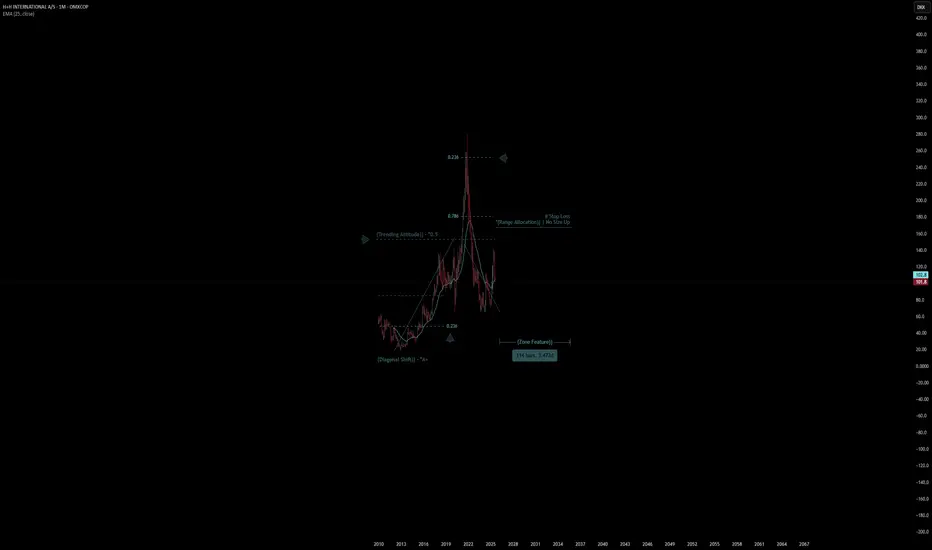
# H+H International A/S
- Double Formation
* (Trending Attitude)) - *0.5 - *Retest & Entry - *25EMA | Subdivision 1
* (Range Allocation)) | No Size Up - *Retest Area | Completed Survey
* 95bars, 2893d | Date Range Method - *(Downtrend Argument))
- Triple Formation
* (P1)) / (P2)) & (P3)) | Subdivision 2
* Monthly Time Frame | Trend Settings Condition | Subdivision 3
- (Hypothesis On Entry Bias)) | Regular Settings
* Stop Loss Feature Varies Regarding To Main Entry And Can Occur Unevenly
- Position On A 1.5RR
* Stop Loss At 180.00 DKK
* Entry At 125.00 DKK
* Take Profit At 45.00 DKK
* (Downtrend Argument)) & No Pattern Confirmation
- Continuation Pattern | Not Valid
- Reversal Pattern | Not Valid
* Ongoing Entry & (Neutral Area))
Active Sessions On Relevant Range & Elemented Probabilities;
European-Session(Upwards) - East Coast-Session(Downwards) - Asian-Session(Ranging)
Conclusion | Trade Plan Execution & Risk Management On Demand;
Overall Consensus | Sell
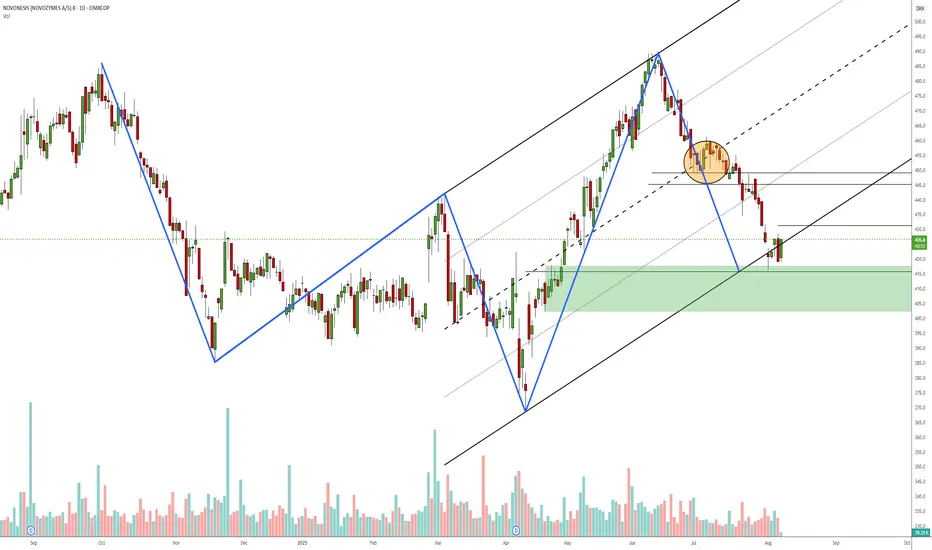
Novonesis daily reversal?Measured move / 3-point channel to test of failed symmetry zone. Might take 1/3 off around 445 depending on PA. I might add to the position if the bearish ab=cd at 431 fails and I'll be looking to take the loss if it drops below 400. Haven't used harmonic patterns for a long time, but this does resemble a 5-0 pattern if I'm not mistaken?
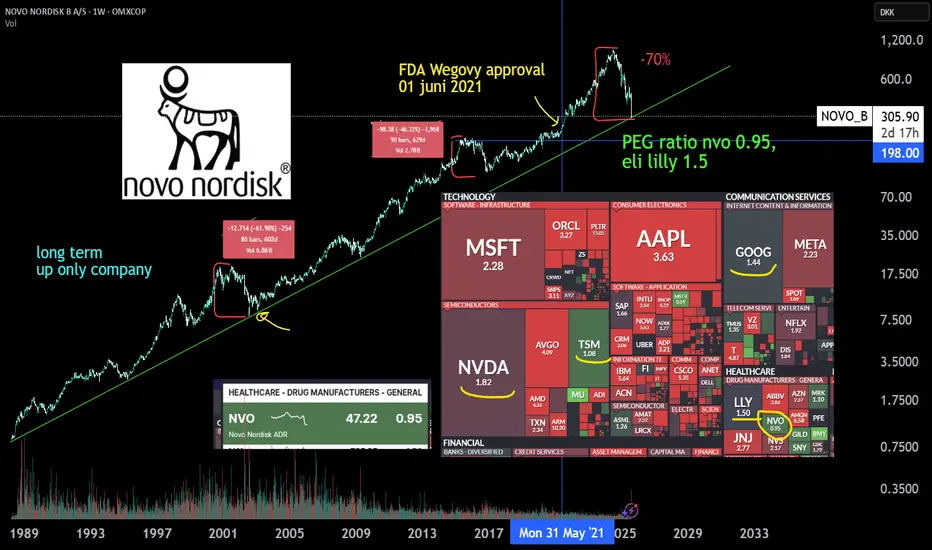
NovoNordisk, LT dirt cheap | GLP-1 a misunderstood growth marketNovo Nordisk stock has lost quite some weight since the release of Eli lilly's drug Zepbound and Mounjaro and since the rise of compounded, or generic copycat GLP-1 alternatives. The growth of the company has slown down a bit, but the overall GLP-1 market growth is still impressive and misunderstood. Both Lilly and NVO have become some of the cheapest PEG stocks in the markets and compettitors, of which most known, Hims en hers health also took a slice of growth of this market by telehealth GLP-1 descriptions.
The copycat descriptions could be dangerous due to unvalidated low quality GLP-1 or agonist GLP-1 substances. Therefore a lot of law suits have been initiated by NVO.
Where Oral Wegovy still has to be FDA approved withinin ~4, 7 months in USA, the company also has new medication approvals awaiting in the pipeline, medications like Cagrisema. (Phase 3 clinical trials, approval in late 2025 or early 2026)
Amycretin - a unimolecular long-acting GLP-1 and amylin receptor agonist.
Where investors have already praised Lilly for the better drug, GLP-1 demand is surging harder than production for both companies.
Where Wegovy and Ozempic are approved by The FDA to sell, many costs for the patients themselfs aren't covered by the health insurance yet. Wegovy or Zepbound isn't covered for mainstream when prescribed by your physician yet. it's only covered for severe obisty for example. Therefore penetration rates of the drug aren't very high yet and will get higher where it will be coverd for more people. Also due to the high cost many copycat GLP-1 agonist market have arisen.
There is some improvement in cost coverage for these types of medicine Which will boost the revenue due to prescribtion sales.
Next these facts, there are still new markets for GLP-1 to be approved like in india and Japan where worldwide demand is much greather than production capacity. Both Lilly and NVO are expanding fast. Many new production volume is created and Needed!, NVO is expanding production sites in brazil and china.
I'm exited for the earnings today. NVO has had many dumps before but has proven to be a up only company. The profits of the company have doubled from $7B to >$14B since Wegovy FDA approval. from the top shares have dumped 70% where there is still >10% growth. Since the FDA approval (june 2021), other markets excluded the share is just +40% up. The stock is much cheaper now with double the profits and revenue, and still >10% growth.
Let's see what happens with earnings. Good luck.
If you want to buy NOVO.....A follower asked for my opinion on this stock which he said many are shorting this and asks if he should be a contrarian instead.
I do not own this stock and has no intention to at this moment but just looking at the chart, here's my 2cents :
1) price has fallen by 70+% from the peak from June 2024 (more than 12 months of bearish moves)
2) price is still in the downward channel and no reversal pattern is in sight
3) How will Donald Trump's tariffs hit these pharma companies down the road remain a mystery. Prefer to let the dust settles first, ie. you may not catch at the lowest price but at least if the trend is up , you have participated in it.
4) Time Horizon - are you investing for long term ? If yes, then further fall in prices may be a good opportunity to average down.
5) Economic Moat - how intense is the competition in the obesity drugs market ? How are the other competitors doing ? Is Novo market shares being encroached ? if yes, what are its strategies to counter that ?
Reading some of the analysts' comments on this stock, it seems like short term prices may not recover as fast as many disappointed investors wanted. Further selling pressure may persists, creating more fear in the market. It may takes several years for the prices to recover to its glorious days so patience is really needed if you want to invest in it.
6) Substitutes - Are there better healthcare companies that you can choose to invest in compared to NOVO ? Consider your investing objectives, capital allocation, timeline, risk/reward, etc
No rush.....
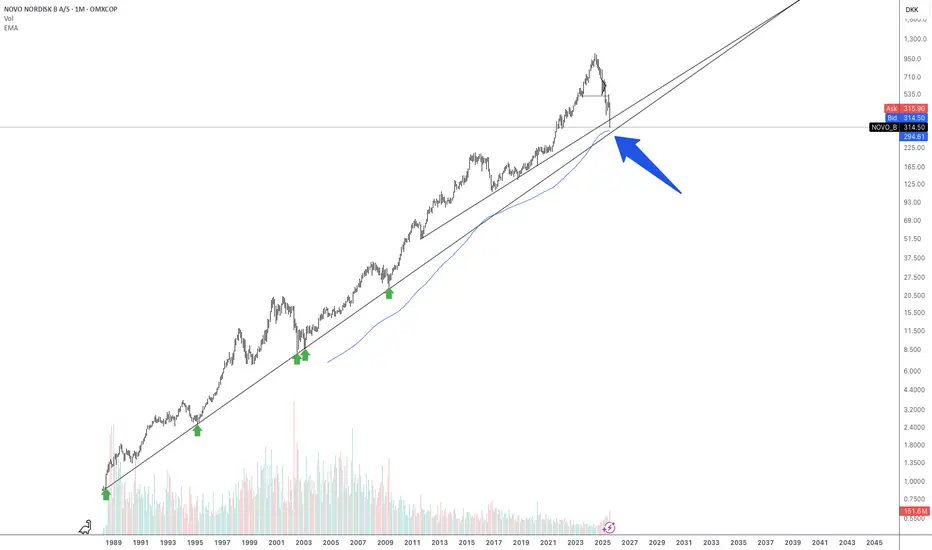
Novo Nordisk, generational buying opportunity? Novo Nordisk is currently experiencing one of the largest drawdowns in its history, primarily triggered by a downward revision of guidance for FY25 and FY26.
Focusing strictly on technical analysis:
For the first time, the monthly 200 EMA is serving as a key support level for Novo Nordisk - an area the stock has never approached in its previous history.
The long-term trendline, originating in 1989 and successfully tested three times since 1995, remains intact and is being approached once again.
Both support levels - the monthly 200 EMA and the long-term trendline from 1989 - are now converging in the same price area.
In addition, the latest twelve months (LTM) P/E has compressed to 13.8x, representing its lowest multiple in over two decades.
In the context of a highly valued broader market, Novo Nordisk is now trading at what can be considered a fair level from a purely technical perspective.
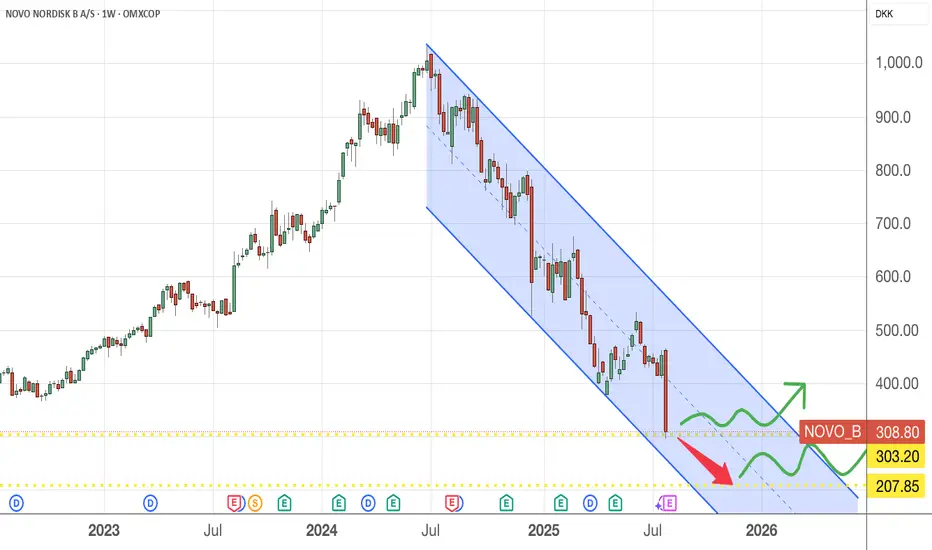
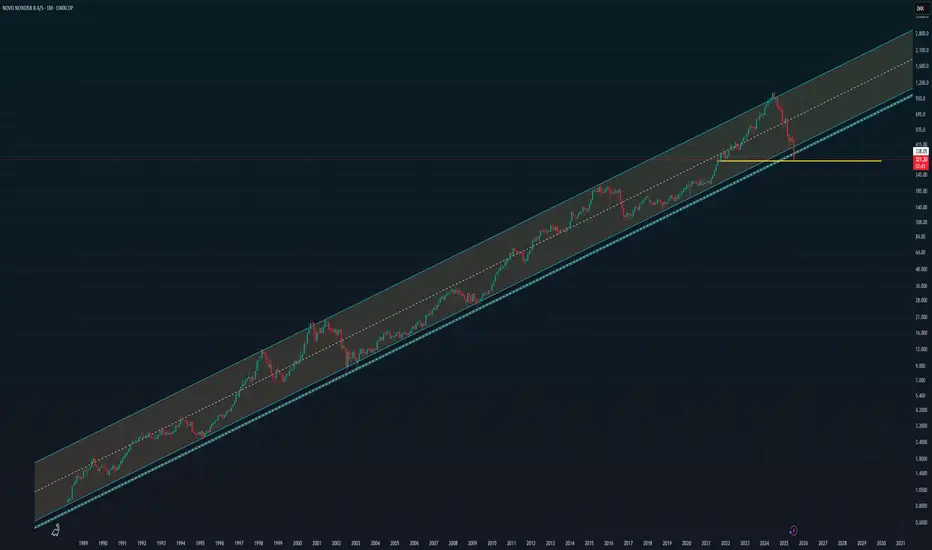
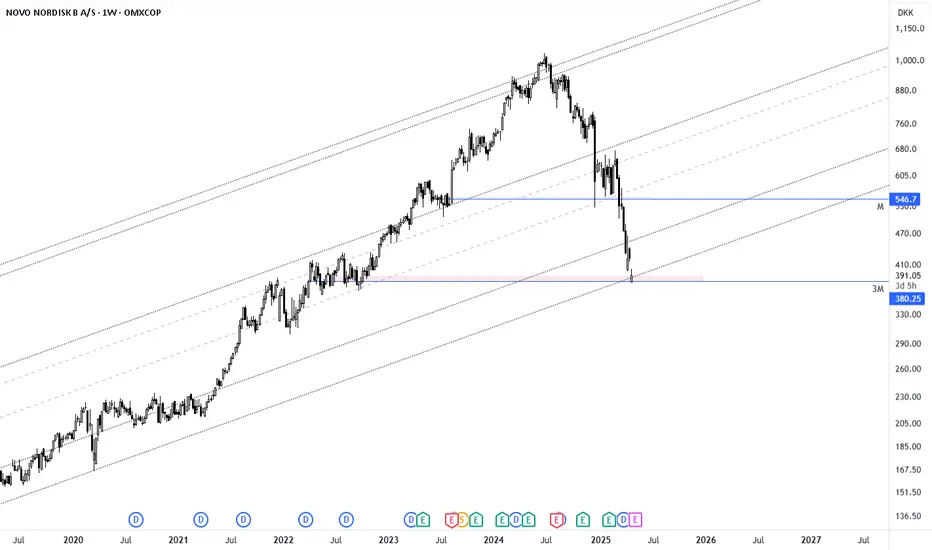
$NOVO_B updated channelNovo Nordisk has had a tough time over the past 13 months, with its stock falling significantly. The main reason is growing investor concern that the explosive growth in sales of Wegovy and Ozempic may be slowing down, especially as competition heats up — particularly from Eli Lilly. Just a few days ago, Novo cut its full-year growth forecast, which confirmed some of those market worries.
At the same time, they announced a leadership change. Current CEO Lars Fruergaard Jørgensen is stepping down, and from August 7, Mike Doustdar will take over. He’s been with Novo since 1992 and has led the company’s international operations with great success. He’s also completed executive education at Harvard, and he’s widely seen as a strong, action-oriented leader with global experience.
Looking at the chart the price has almost always swayed up and down within this tunnel. Occationally falling to the trendline bellow.
Now we are at the trendline below - Meaning we are at an absolute panic state. One og the biggest pharma companies in the world - who in a matter of 5 years will bring a weight loss pill to this world - is ready for a new start.
Still somewhat of a falling knife - so be careful. But keep an eye out for a speedy return upwards.
NYSE:LLY on the other hand has a bit of the same trend BUT… price has hit the top of the channel…
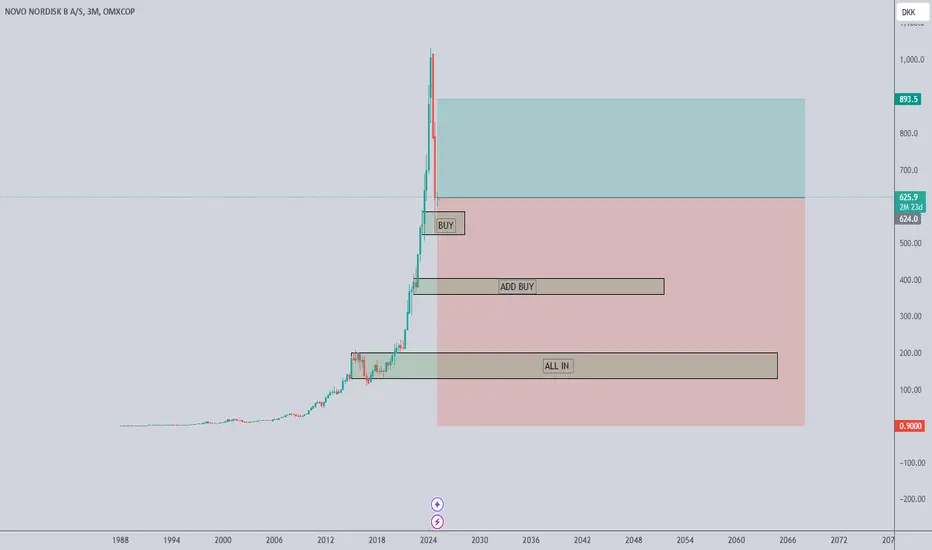
NOVO potential enter zoneThe stock is trading inside a major monthly “BUY ZONE” (DKK 280–325), which aligns with historical Fair Value Gaps (FVGs) from 2015–2018.
A Higher Low (HL) structure has formed, and as long as it holds, the long-term bullish structure remains valid.
Multiple FVGs have now been retested, suggesting a potential accumulation phase.


$NOVO_BNovo Nordisk has had a tough time over the past 13 months, with its stock falling significantly. The main reason is growing investor concern that the explosive growth in sales of Wegovy and Ozempic may be slowing down, especially as competition heats up — particularly from Eli Lilly. Just a few days ago, Novo cut its full-year growth forecast, which confirmed some of those market worries.
At the same time, they announced a leadership change. Current CEO Lars Fruergaard Jørgensen is stepping down, and from August 7, Mike Doustdar will take over. He’s been with Novo since 1992 and has led the company’s international operations with great success. He’s also completed executive education at Harvard, and he’s widely seen as a strong, action-oriented leader with global experience.
Looking at the chart the price has almost always swayed up and down within this tunnel. Occationally falling to the trendline bellow.
Now we are at the trendline below - Meaning we are at an absolute panic state. One og the biggest pharma companies in the world - who in a matter of 5 years will bring a weight loss pill to this world - is ready for a new start.
Still somewhat of a falling knife - so be careful. But keep an eye out for a speedy return upwards.

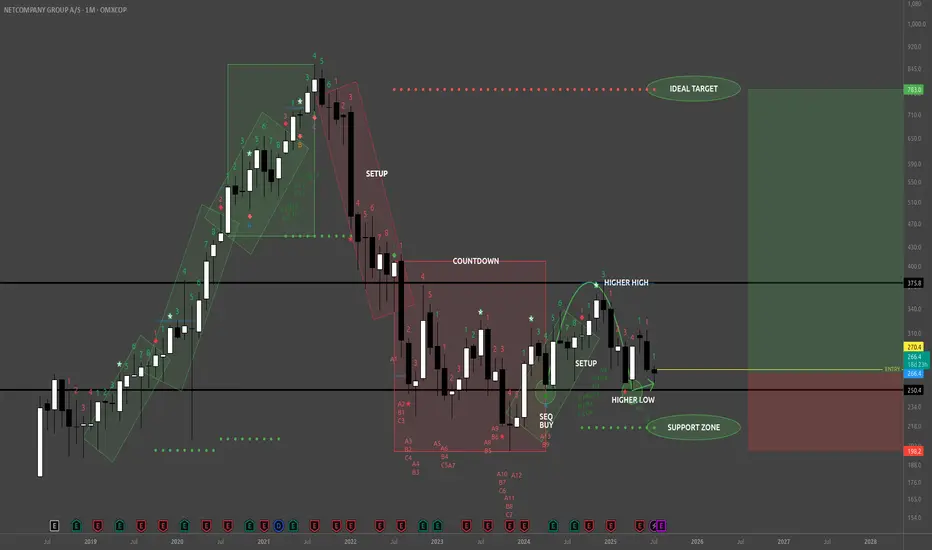
NETC - BuyReading the NETC Monthly chart from the left to right look at that remarkably strong bullish trend (green rotated rectangles) which spanned 3 consecutive TD 1-9 Setups. That's 9 strong months of uptrend culminating in the beginning of the bearish trend with a TD Sequential 13 Sell signal at the apex, a Bearish Engulfing Pattern, and a large Doji immediately preceding the TD 1-9 Setup (red rotated rectangle) which exhausted the downward momentum, and dissipated the downward momentum with the TD Sequential 13 Buy signal (first green circle).
From the TD 13 Buy signal (first green circle) buyers created a higher high, followed by 4 consecutive red TD counts, whose bearish implications were disrupted by the strong Bull Sash pattern. I really like this spot for opening a long position. One caveat is that the Weekly TD Buy Setup is on 7/9 so the next two weeks could bring the price lower, potentially even tapping the TDST support zone, but whether that happens or not look left on the chart everywhere from my entry price and below. This is all wholesale pricing territory!
TDST up at 783 is a nice upside target just shy of the ATH traders will be gunning for.
Now on fundamentals here's where things are really nice. NETC just bought themselves the Danish IT banking company SDC (for 1 Billion DKK) which serves about 100 Nordic banks. That's going to be bringing in sticky, recurring revenues in a critical financial sector. NETC revenues are also not materially tied to the U.S., and doesn't rely on American consumer sentiment, regulatory policy, or supply chains.
Whether price falls from here or not I'm holding on to my shares until this pays off big. Maybe this is a trade for your trading temperament too.
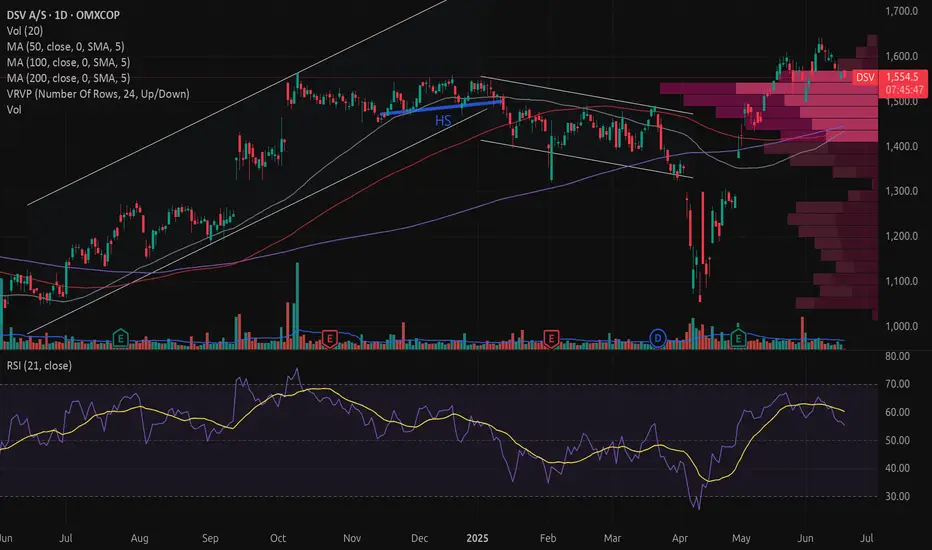
DSV – Potential reversal after break down from uptrend
DSV was in a rising trend but formed a small head-and-shoulders formation (HS), which led to a negative breakout. In the following three months, the price development can be interpreted either as a rectangular consolidation (REC) or a short-term downtrend. The price then dropped sharply to a pointed V-shaped bottom on April 9, followed by a strong rebound. Volume increases and falls in a V-shape – the development resembles a final rally, although such a rally typically follows a longer calm uptrend or downtrend.
The price has now established itself higher, with rounded tops and pointed bottoms. Volume balance has been negative since the HS formation, with increased volume at the bottom. Price momentum indicators are, however, positive.
The price is above a green cloud in the Ichimoku.
The stock is considered technically slightly positive for the next one to six months.
From a fundamental perspective, analysts are generally very positive about DSV. The company is regarded as highly competitive compared to industry peers. DSV is one of the largest global logistics operators, but rising import duties are expected to limit the volume of goods to be transported.
The company is highly scalable, as it owns few of the trucks, ships, and planes it uses itself.
Recently, there have been critical articles in the Danish newspaper Børsen, highlighting a tough management culture at DSV.
Disclaimer: I hold a position in DSV.
Note: Always do your own research and evaluation before buying or selling stocks.
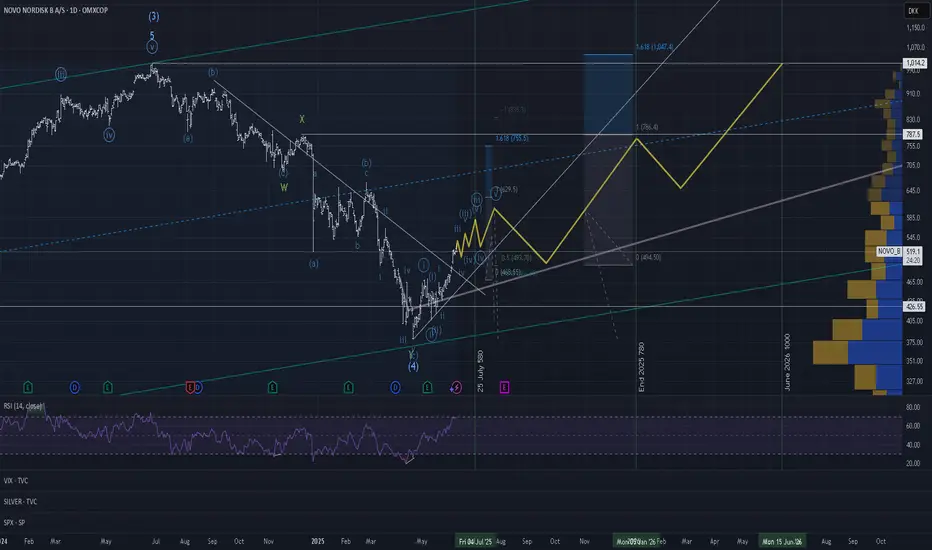
NOVO expected to reach ATH during 2026Based on EW count and general knowledge about the company, it is expected that Novo will get back to the top (approx x2 from here) during 2026. Lets see
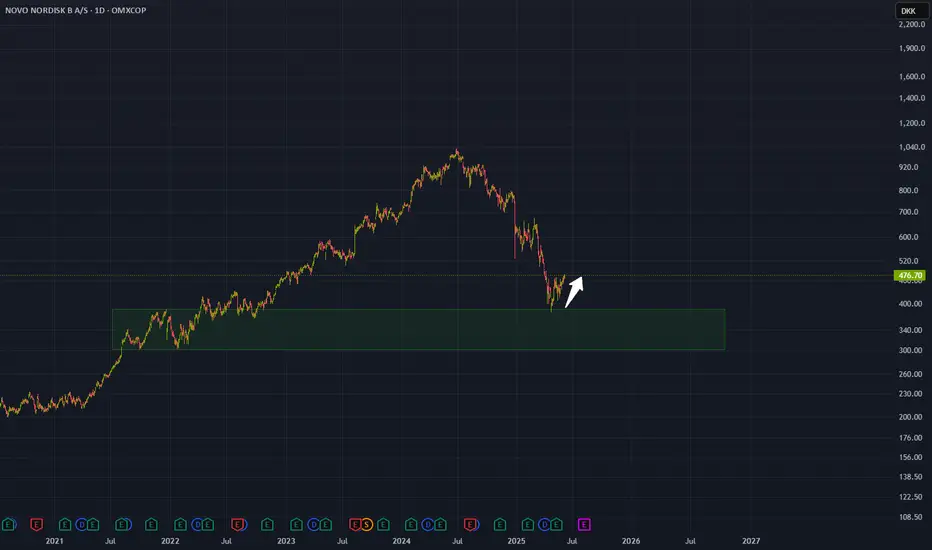
Novo Nordisk: Massive buying opportunityNovo has been struggling big time, december and march hit especially hard.
American institutions have held large positions in Novo, and this was felt when they had to sell off due to risk management with the looming tariffs.
However, the sheer devaluation & importance of their export, is going to create a massive wave following a risk-on environment, which i firmly believe is coming.
One of the few large EU based firms worth investing heavy in.
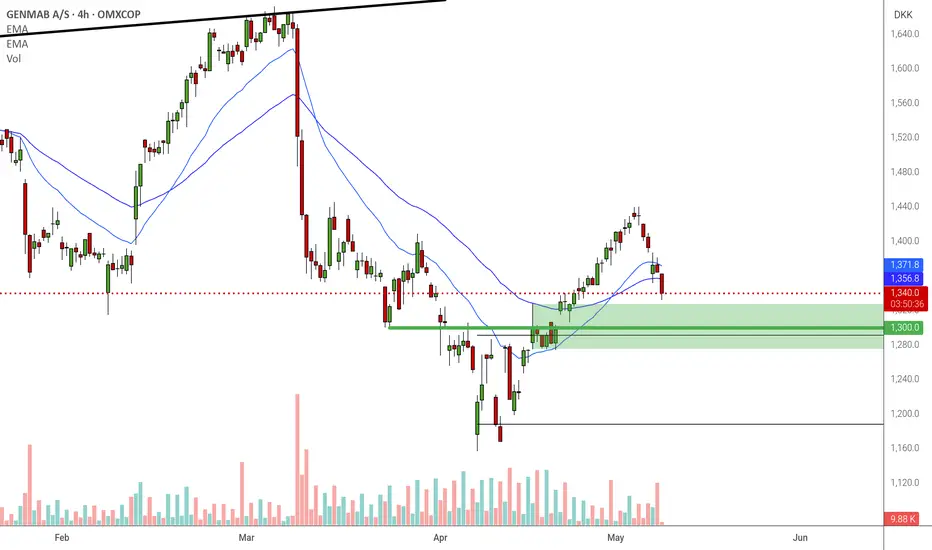
Genmab 4h longZone + 1st measured move PB.
Could potentially go all the way up to the expanding triangle top?
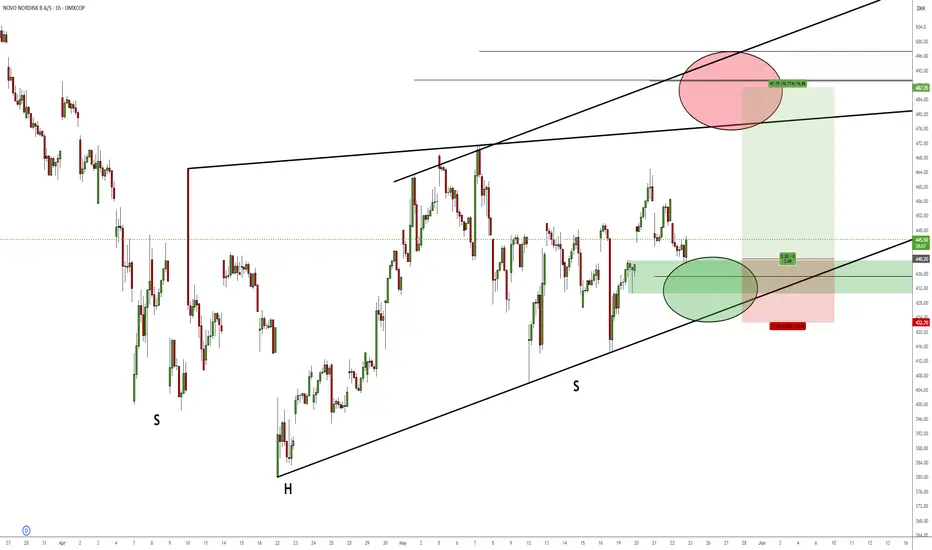
Novo 1h longShould get up and at least break the neckline from the bigger SHS/IHS.
Stop below zone or lower trendline.
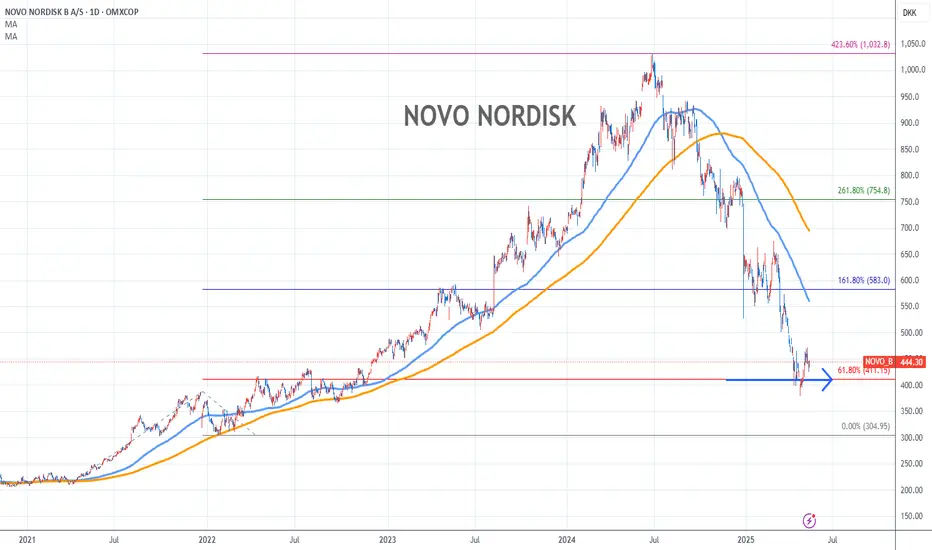
Novo Nordisk Stock Chart Fibonacci Analysis 050925Trading Idea
1) Find a FIBO slingshot
2) Check FIBO 61.80% level
3) Entry Point > 411/61.80%
Chart time frame: D
A) 15 min(1W-3M)
B) 1 hr(3M-6M)
C) 4 hr(6M-1year)
D) 1 day(1-3years)
Stock progress: A
A) Keep rising over 61.80% resistance
B) 61.80% resistance
C) 61.80% support
D) Hit the bottom
E) Hit the top
Stocks rise as they rise from support and fall from resistance. Our goal is to find a low support point and enter. It can be referred to as buying at the pullback point. The pullback point can be found with a Fibonacci extension of 61.80%. This is a step to find entry level. 1) Find a triangle (Fibonacci Speed Fan Line) that connects the high (resistance) and low (support) points of the stock in progress, where it is continuously expressed as a Slingshot, 2) and create a Fibonacci extension level for the first rising wave from the start point of slingshot pattern.
When the current price goes over 61.80% level , that can be a good entry point, especially if the SMA 100 and 200 curves are gathered together at 61.80%, it is a very good entry point.
As a great help, tradingview provides these Fibonacci speed fan lines and extension levels with ease. So if you use the Fibonacci fan line, the extension level, and the SMA 100/200 curve well, you can find an entry point for the stock market. At least you have to enter at this low point to avoid trading failure, and if you are skilled at entering this low point, with fibonacci6180 technique, your reading skill to chart will be greatly improved.
If you want to do day trading, please set the time frame to 5 minutes or 15 minutes, and you will see many of the low point of rising stocks.
If want to prefer long term range trading, you can set the time frame to 1 hr or 1 day.
Novo Nordisk's The recent drop in Novo Nordisk's stock price is attributed to several factors. A key issue is the company’s struggle to meet the surging demand for its weight-loss drugs, such as Wegovy. Although demand remains strong, investors are concerned about Novo Nordisk's ability to scale up production and deliveries, which is creating downward pressure on the stock.
Additionally, some recent financial results failed to meet Wall Street expectations. Despite revenue growth in key product categories, overall revenues in some reports came in below forecasts. This underperformance has contributed to a negative investor sentiment.
However, analysts emphasize that Novo Nordisk's core products remain in high demand, and the company has significant long-term growth potential if it addresses its supply chain and production challenges
NVO absolutely sweet levelThis downturn is attributed to disappointing clinical trial results for some of its drugs and concerns over potential tariffs affecting Denmark. Additionally, competition from Eli Lilly's successful weight-loss drug trials has impacted investor confidence.
Despite these challenges, analysts note that Novo Nordisk maintains strong fundamentals and a positive long-term outlook, particularly in its core areas of diabetes and obesity treatments.
Looking kind of LongAfter a really red day for Maersk it reached the main lower trendline and right away bounced back up.
I will first see if the price respects the lower main trend and the be looking for a good Long position for the coming days until it reaches the upper trendline on the lower timeline.
So far so good.. share you thoughts!

Maersk keeps following trend-line, potential short position.Right after the latest Ex-day for dividends it breached the lower trend-line, but worked its way back to it. Yesterday it hit the roof of the upper trend-line and MACD switched to bearish.
I will be looking for a short position and expecting a low price around 11200 DK.
Share your thoughts, maybe I am missing something big?

Short-term idea for upcoming days after Ex-day of DevidendsI will be looking for the passing of the short-term trendline for a short-position tomorrow on Ex-day. My MACD-signal has flipped and yesterday ended right before a potential breakout or Head and Shoulders.
Downward trend were confirmed March 14th and has been respected three times already. If continued we could expect price down to 11500 DKK.
This is my first printed "idea" on TradingView and in general, take this with a pinch of salt.
Please share your thoughts and counter-ideas if any!

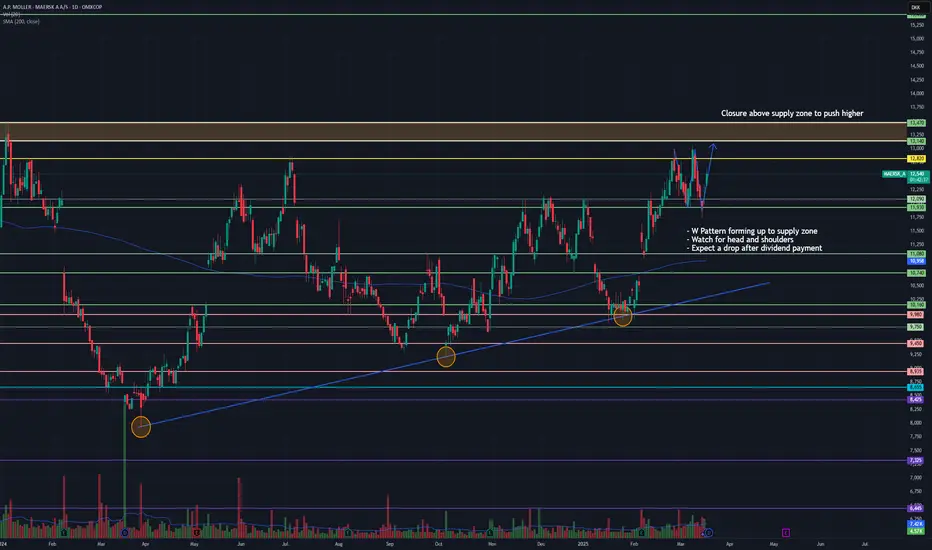
A.P. Møller – Mærsk A/S Bullish Sentiment OMXCOP:MAERSK_A is approaching a major supply zone around 12,800–13,200 DKK, which has previously acted as strong resistance.
The stock has been forming higher lows, respecting a long-term ascending trendline, indicating overall bullish structure unless that trendline is broken. In the short term, a W-pattern is forming, indicating bullish momentum towards the supply zone. However, there is a risk of forming a Head and Shoulders pattern, which would be bearish if confirmed. It is also important to note that after the dividend payment, a price drop is expected, possibly due to the adjustment of share price post-dividend distribution.
The company continues to beat earnings and increased their dividend payout. Recent news suggests a strong partnership with DP World to expand maritime services in Brazil, which could enhance long-term revenue stability.
Bullish Scenario: A break and close above 13,200 DKK with strong volume would confirm further upside potential.
Bearish Scenario: If resistance holds and a Head & Shoulders pattern forms, expect a drop toward 10,950 DKK or lower after dividend payments.
BAVARIAN NORDIC BAVA LARGE ASCENDING TRIANGLE FORMATIONHello Traders,
Here is my chart idea for Bavarian Nordic. This idea is solely based on me looking at the chart formation and no research has been done into the companies financials, potential upcoming vaccines or anything like that.
The price has been going sideways inside a large ascending triangle for about 22 years now and price movement still looks to be corrective waves not impulsive waves. It looks like the price wants to come down to the bottom trendline and bounce from there. This would also print a low, oversold value on the monthly RSI.
On the weekly chart it looks like the price has just broke down from a head and shoulders.
Lets see what happens.
