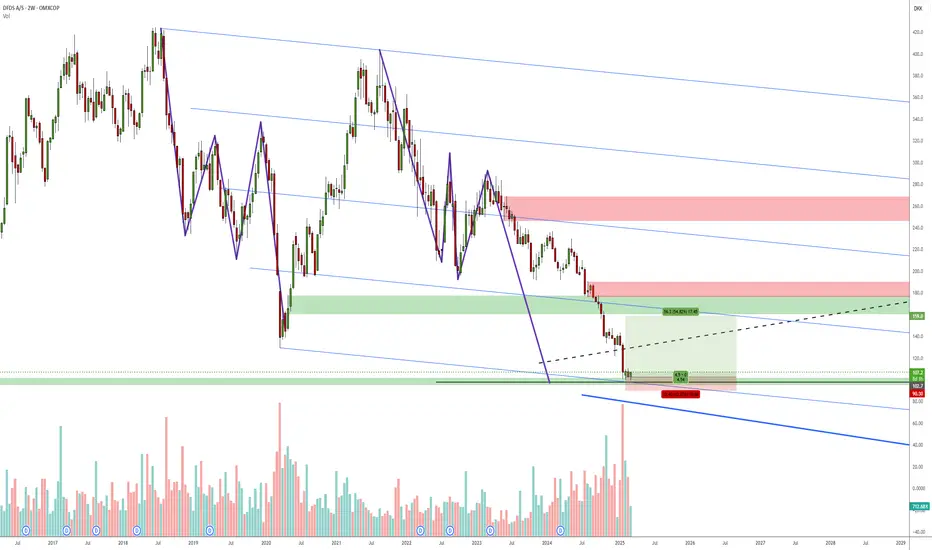
DFDS bearish target hit -> bottom?As shown on an older chart, this was the target for the down trend.. Symmetry + ab=cd reached at channel low and a zone. 54% to the first upside target! Let's go.
SL might be too optimistic, but I'm willing to try a few times.
Would be f'ing epic :D
/edit.. There's a minor first target at gap close at 130
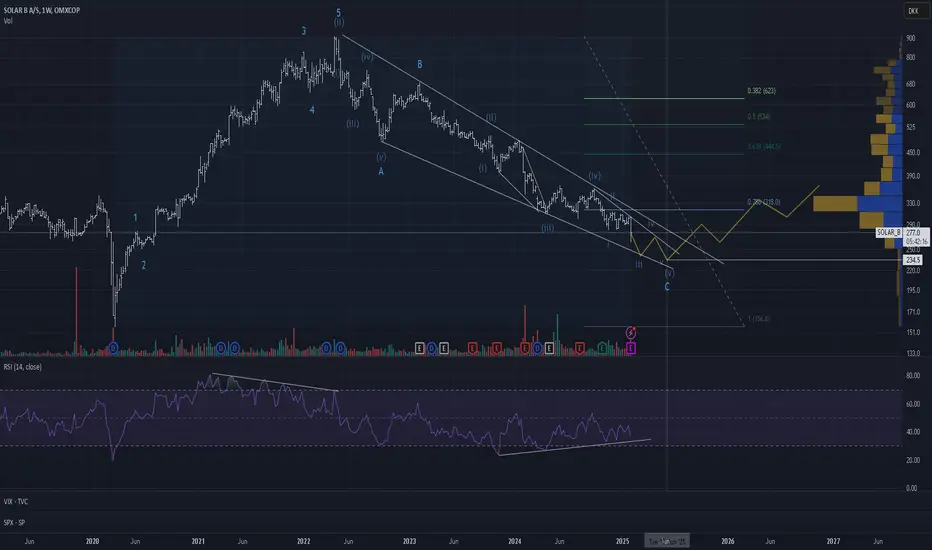
Solar.eu searching for the bottomAnalyzing RSI divergence, EW Solar.eu seems to be nearing the bottom. Healthy economy. The stock is expected to bottom at around 250 this summer. Then it should be good buy
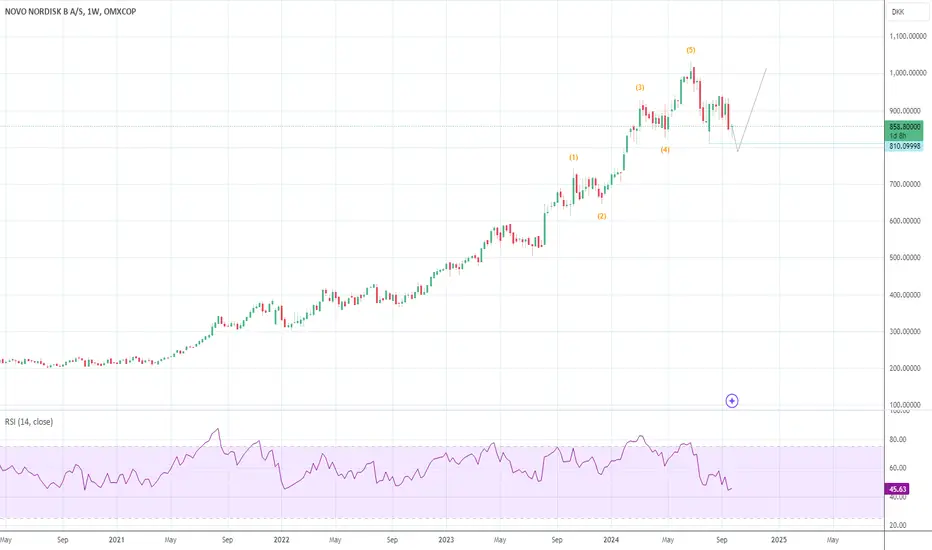
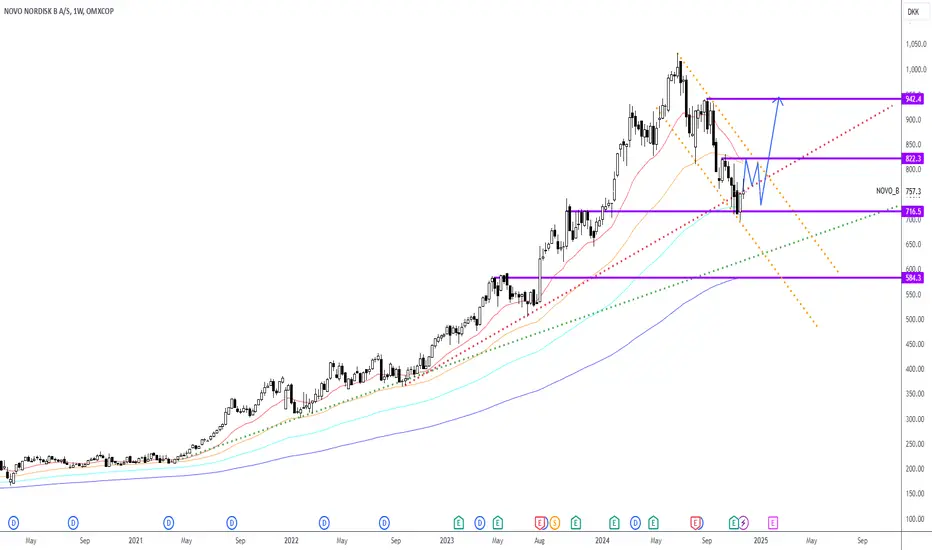
Novo is going to 480. Wait for it!OMXCOP:NOVO_B Is declining to 480. I think that will be a good price to buy. It has a lot of bad news ahead. But this bad news is not that bad. So see you at 480!
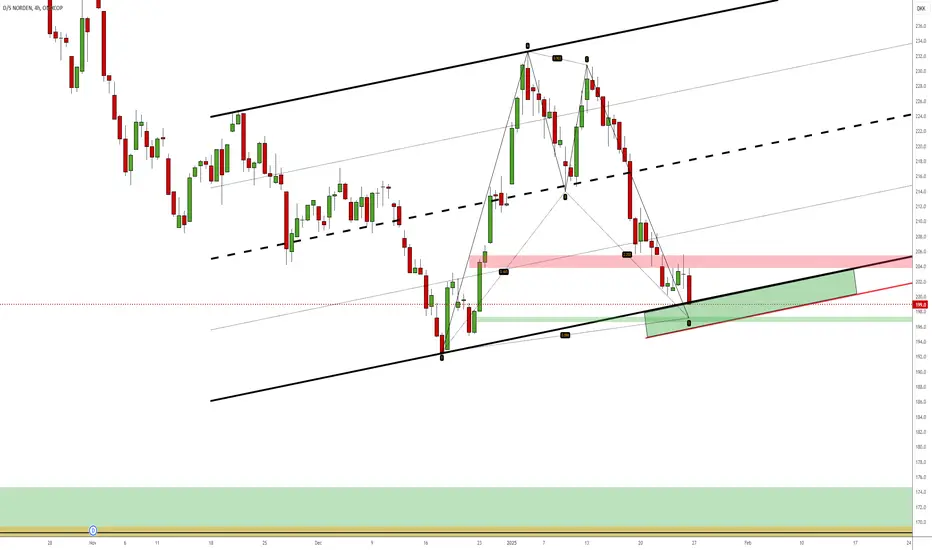
Last chance for DNORD at this lvl - 4hI have nothing below, so if this doesn't hold I'd suggest it'll continue to at least 175 DKK. I don't trade harmonic patterns any more and haven't got a clue on their win rate these days, but it is a nice bat pattern too ;)
Haven't got too much trust in this lvl, but I thought I'd share it since there's a decent drop to the next area of interest.
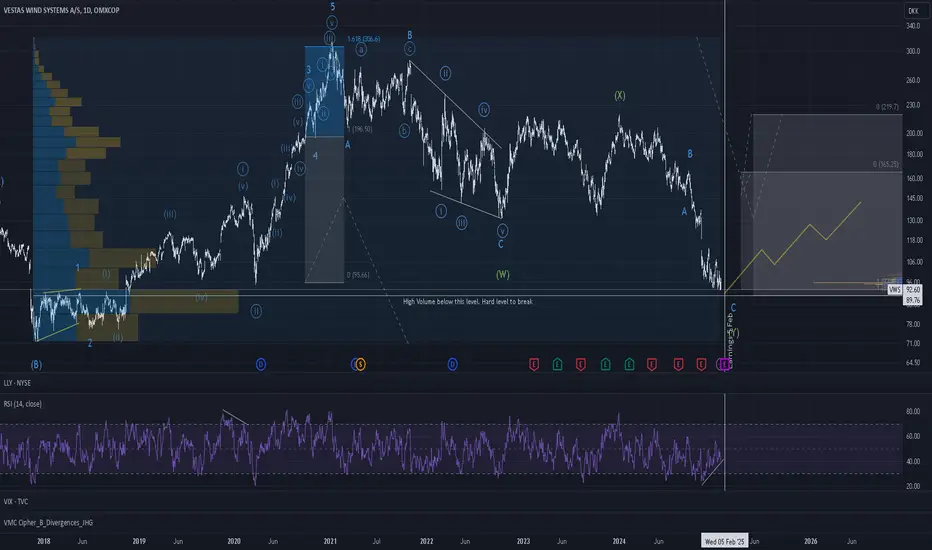
Vestas turning bullish Given strong divergence on RSI, correlation on wave extensions, high volume below and EW count the target for the earnings date 5. feb is about 90.
From there Vestas is expected to turn bullish.
Beware that current P/E is about 250
There is some correlation to the Ørsted count
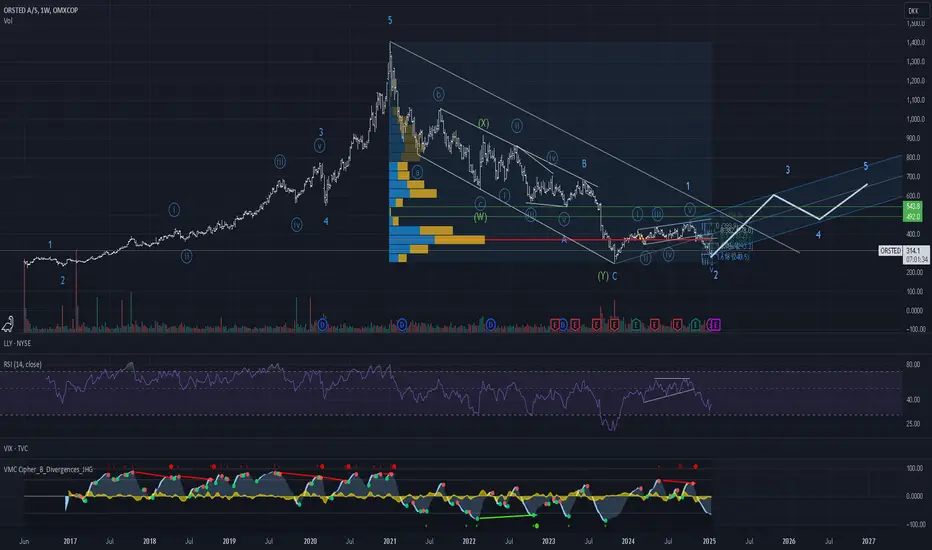
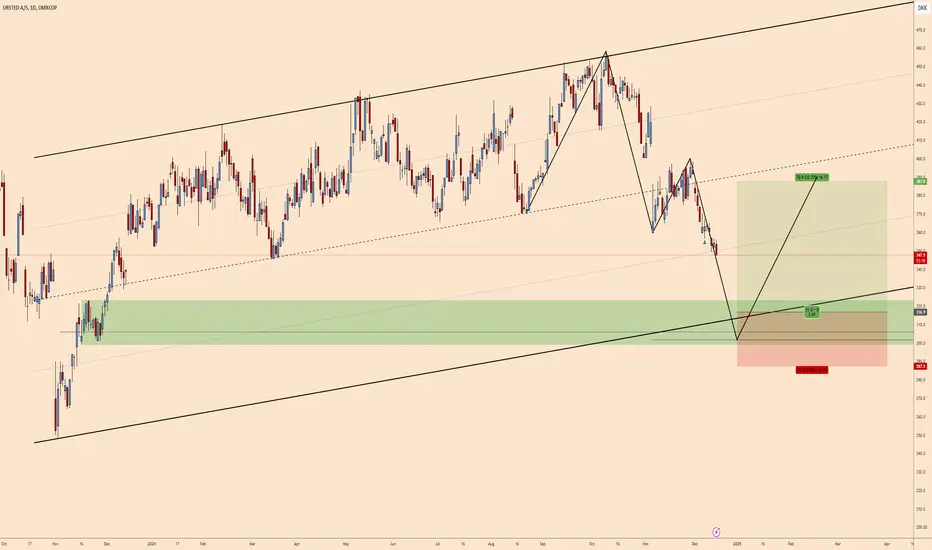
Ørsted expected to be bullish from hereIt seems that Ørsted has completed the correction and now will start a bullish move during from here. There is missing volume at 500 and it is expected that this area will be reached during 2025. Earnings coming up soon.
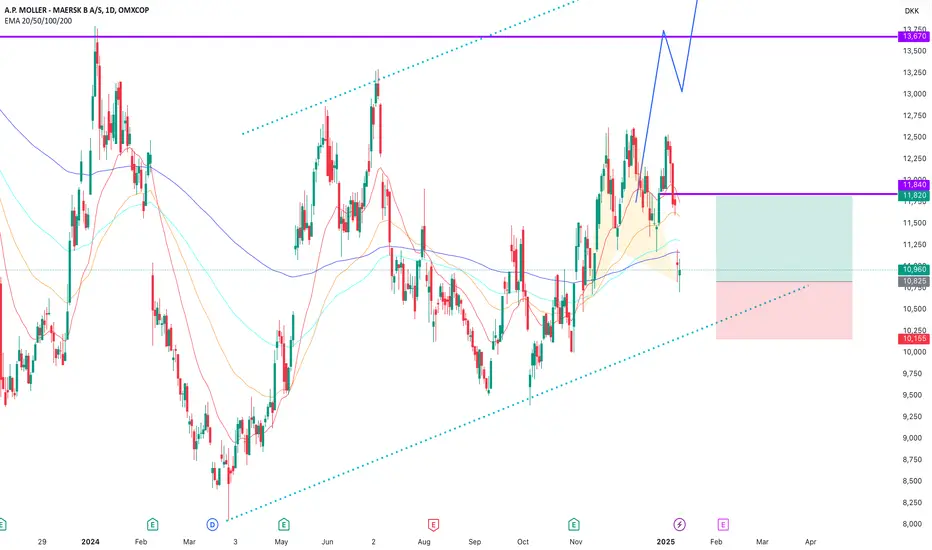
MAERSK - End of roadIn the short term, very high selling pressure.
In the long term, it looks like there is a plenty of space upward.
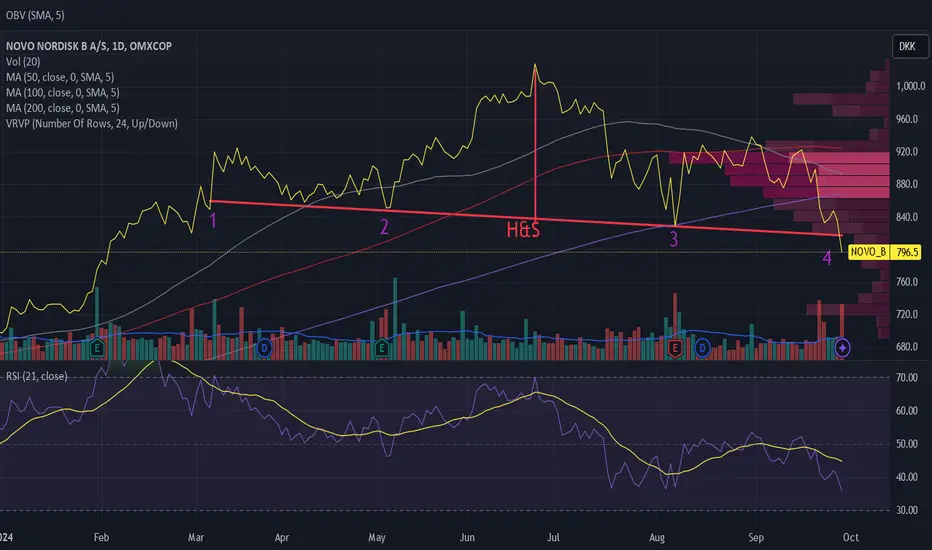
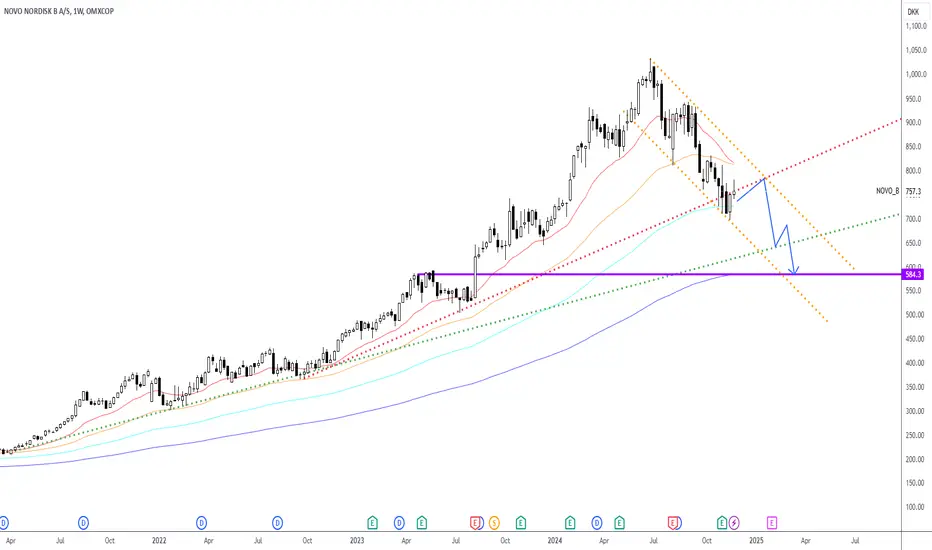
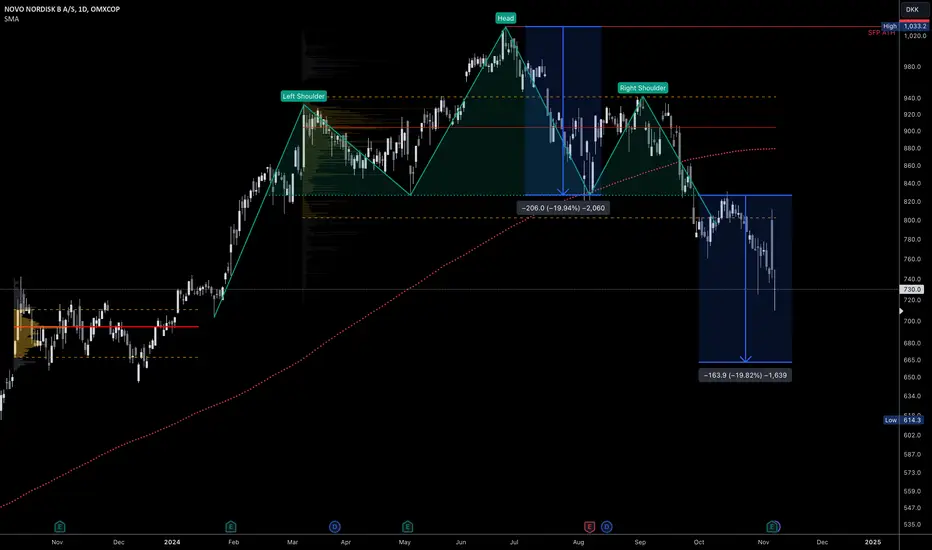
NOVO has developed an H&S formationAs others have also mentioned on Trading View, NOVO has developed an H&S formation.
The formation is to some extent supported by volume.
Volume should be large when forming the left shoulder 1, as well as when forming the head 2, and when the price goes down at the right shoulder 4, but when forming the right shoulder the volume should be low 3. It is not.
Since May, the volume balance has been negative, i.e. high volume at the price bottom and low volume at the price peak.
At 794, there will be a significant break of 3%, especially if it is supported by high volume.
There is no significant break yet.
The object is heading towards 629.
An H&S formation is a reversal formation. NOVO has been in a bullish trend, according to MA. However, the price is now below SMA 200.
The price momentum indicators go from sell to buy within a month on Trading View.
The price is well below a red cloud in Ichimocu.
It is not possible to say now whether we will have a significant break down or whether the price will recover. The forecast will depend on this.
Fundamentally, analysts are predominantly positive about the stock.
Many companies would like to enter the obesity market, but there are far from good results in a phase 1 study to a finished drug, if it becomes a drug at all.
Disclaimer: I have a relatively large position in the stock, which I bought when the shares plunged during the covid19 epidemic. I have sold 1/4 share when the price had tripled, so I am thinking of sitting still now even in the face of the technical picture - I am long.
In the past, price has fluctuated between two pivot lines at times. Then I have swing traded NOVO.
NB: Remember you must do your own research and assessment before buying and selling.
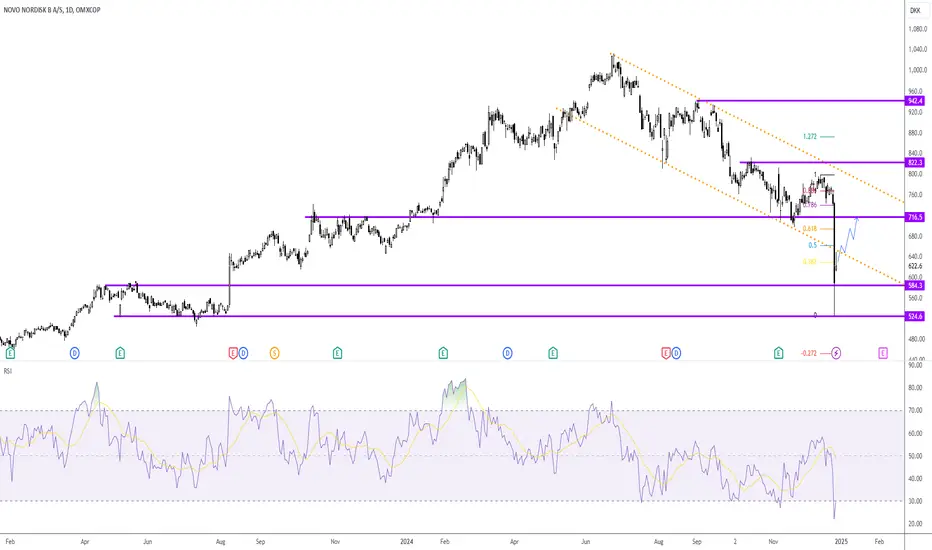
NOVO - Short term targetSupport Resistance
Weekly support works
Wave
We expect a potential correction aligning with Fibonacci levels
RSI - No reversal signal yet
Daily - Oversold
Weekly - Oversold
MACD - No reversal signal yet
Daily - Sell histograms is growing
Weekly - Sell histograms is growing
Opening price 625
Take profit 1 660
Take Profit 2 692
Stop loss 584
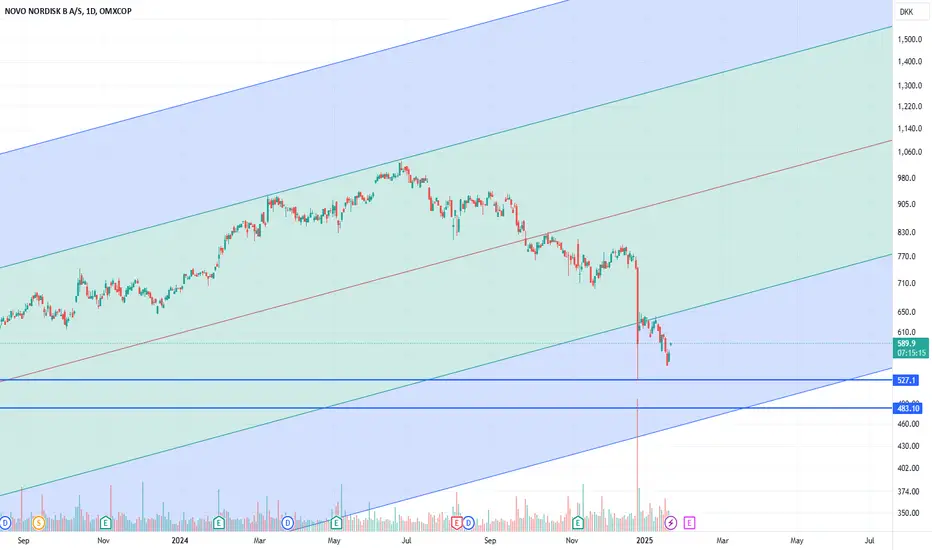
Novo Nordisk hit my target this week and I have started to buy The head and shoulders pattern successfully played out, with OMXCOP:NOVO_B reaching my full target at 670.
Check out my original post:
The stock experienced a significant drop, falling as much as 27% on the Friday before Christmas. This was triggered by test results for their obesity drug, CagriSema, which showed patient weight loss of 22.7% - below the anticipated 25%.
I believe this reaction is an overcorrection and have taken advantage of this rare opportunity to purchase OMXCOP:NOVO_B , first at 680 and again at 600. I now plan to hold patiently, expecting Novo Nordisk to reach new all-time highs in the coming years.
Novo completely oversold🐂 Trade Idea: Long - NOVO
🔥 Account Risk: 20.00%
📈 Recommended Product: Stock
🔍 Entry: +/- 750.00
🐿 DCA: No
😫 Stop-Loss: 675.00
🎯 Take-Profit #1: 1,000.00 (50%)
🎯 Trail Rest: Yes
🚨🚨🚨 Important: Don’t forget to always wait for strong confirmation once possible entry zone is reached. Trade ideas don’t work all the time no matter how good they look. Do not get a victim of FOMO, there is always another trade idea waiting. 🚨🚨🚨
If you like what you see don’t forget to leave a comment 💬 or smash that like ❤️ button!
—
Novo Nordisk is completely oversold (in fear of RFK) and so is the rest of the Pharma sector as well. Nevertheless, Novo is still printing money and trial results for a new product should come in end 24 or beginning 25 for the oral version of the weight loss drug. The fear over political decisions in the US should be used to buy the Pharma sector. For me, it is Novo and Regeneron.
—
Disclaimer & Disclosures pursuant to §34b WpHG
The trades shown here related to stocks, cryptos, commodities, ETFs and funds are always subject to risks. All texts as well as the notes and information do not constitute investment advice or recommendations. They have been taken from publicly available sources to the best of our knowledge and belief. All information provided (all thoughts, forecasts, comments, hints, advice, stop loss, take profit, etc.) are for educational and private entertainment purposes only.
Nevertheless, no liability can be assumed for the correctness in each individual case. Should visitors to this site adopt the content provided as their own or follow any advice given, they act on their own responsibility.
Orsted daily bottomLook for signs of reversal between 300-325. AB=CD to possible channel bottom/doubling of earlier channel and zone.
Multi year breakoutLeading financial bank with multi year breakout. You can clearly see VCP pattern.
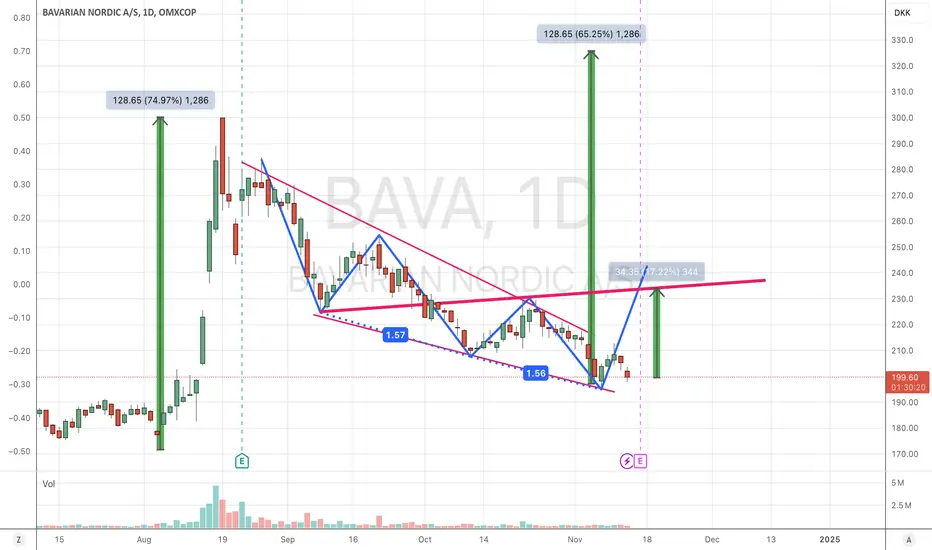
BAVA: finally a breakoutAccording to analysts the average Target is 319 whereas the max Target us 373. Happy trading Folks
MAERSK UptrendTREND
According to the wave structure, it is still in the downtrend
However, head and shoulders formation is a powerful reversal indicator.
It also formed a blue channel , now targeting the upper band
Moving Averages
20-day (Red) crosses 50-day (Orange) from down to up (powerful indicator supporting uptrend)
100-day (Turquoise) is below the current price (so supports uptrend)
200-day (Blue) is right below the current price (it becomes support now)
SUMMARY
Based on this analysis, a price action following the blue arrow is highly probable.

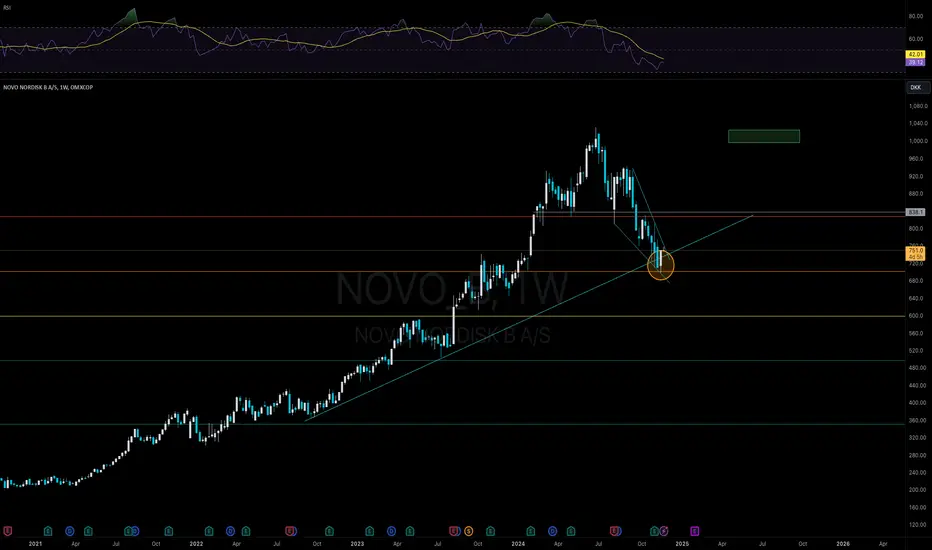
NOVO Up TrendTREND
We may be at the end of the correction, namely the 3 ABC waves within the downward (orange) channel.
It may form a reversal formation with the blue harmonic pattern.
At the same time, the TOBO formation will also be formed.
MA
In this case, the 100-day (turquoise) will have worked as support.
The last 100-day was seen in 2021.
Thus, the upward trend can continue without breaking the 20-day to 50-day.
NOVO Down TrendTREND
The red trend line from 2022 has been broken. It may be doing a pullback for confirmation.
It continues its movement within the orange channel that started in 2024. It may be the 3rd of the 5-wave.
The green trend line from 2021 is the first target before the purple main support.
The purple support formed in 2023 is the strongest level. It is also Fibo 0.618.
MA
20-day (Red), 50-day (Orange) is cutting down from the top.
100-day (Turquoise) has been working as support since November.
200-day (Blue) intersects with the weekly main support (Purple).
SUMMARY
It is in a downtrend in the weekly and a typical reversal pattern is not seen.
It may continue its movement in the direction of the blue arrow.
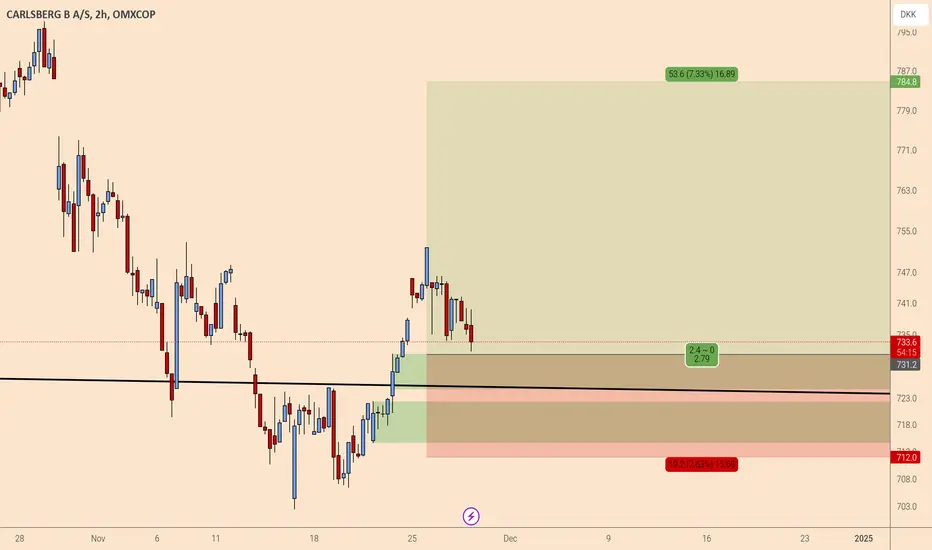
Carlsberg 2h first PB?IHS at weekly channel low. AB=CD/possible first pullback to zones and channel low. Take it at least to gap close.
New Zealand dollar eyes RBNZ rate announcementThe New Zealand dollar is in positive territory on Tuesday, after a four-day losing streak. In the European session, NZD/USD is trading at 0.5850, up 0.09% on the day. Earlier, the New Zealand dollar fell as low as 0.5797, its lowest level since Nov. 1.
The Reserve Bank of New Zealand makes its rate announcement on Wednesday and the markets have priced in a jumbo rate cut of a 50 basis point for a second straight meeting. This would bring the cash rate to 4.25%, its lowest level since November 2022.
The RBNZ has done a good job of lowering inflation, which fell to 2.2% in the second quarter. This is the first time in over three years that inflation is within the target band of between 1 and 3 percent. Still, elevated rates have taken a heavy toll on the economy, as GDP declined 0.2% in the second quarter and likely fell in Q3 as well, which would mark a recession. The central bank’s aggressive rate-cutting is aimed at providing the economy with a much-needed boost.
The New Zealand dollar stands to be the big loser from an oversized rate cut. The currency plunged around 1% after the 50-bp chop in October and we could see another sharp drop on Wednesday if the central bank cuts again by 50 basis points.
The Federal Reserve releases the minutes of the November meeting later today. At the meeting, the Fed lowered rates by 25 basis points. Investors will be looking for insights about what the Fed may have planned for the Dec. 18 meeting. A few weeks ago, a second straight 25-bp cut appeared likely but with the US economy remaining strong, the Fed may opt to pause. Interest-rate future markets are currently pricing in a cut at 59% and a pause at 41%, according to the CME’s Fed Watch.
NZD/USD is testing resistance at 0.5857. Above, there is resistance at 0.5898
There is support at 0.5793 and 0.5752
BAVA: bullish 3 drives18 % Upside potential with little risk since earnings are coming out on friday
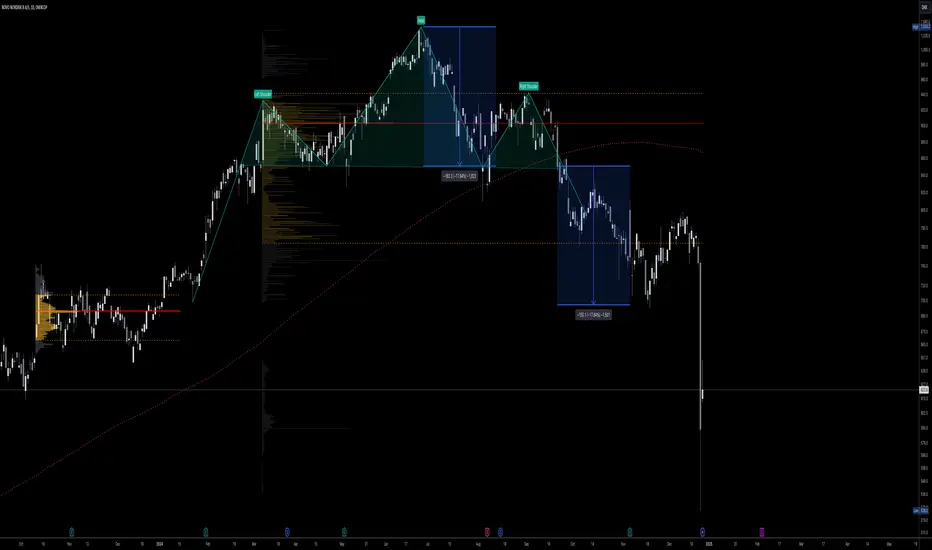
Revising the head and shoulders pattern on NOVOSince my previous analysis on Novo Nordisk OMXCOP:NOVO_B , the price has nearly reached the original target of 700.
However, I have made slight adjustments to the head and shoulders pattern, which has consequently led to a revised target at the value area low of the range from late 2023 at around 670.
At this point, I would not consider this an ideal time to initiate a short position on OMXCOP:NOVO_B . Instead, it appears to be more of a profit-taking opportunity for those who entered short positions near the levels indicated in my earlier post.
You can buy it here.. Its fineOMXCOP:VWS
Recent pullback is a fine buying opportunity.
Maybe we bottomed and break the downtrend now,
Maybe we have a leg lower to ~120 - a chance to back up the truck.
In any case this one will AT LEAST double in value over the next 3 years.
Europe will make a lot of windmills in the next 3 years, it is vital for the future of European energy independence, so if you believe there is a future - then this is a good company to build a position in this winter.
Cheers.
