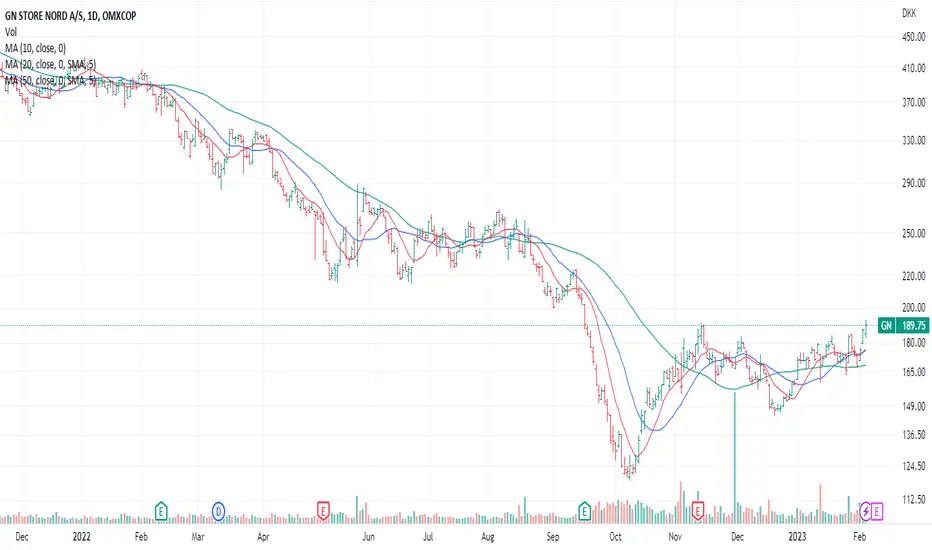
Mærsk in stage 4 - wait for transition to stage 1In stage 4 - the stage you don't want to own the stock.
Wait for stage 1 and consolidation before stage 2.

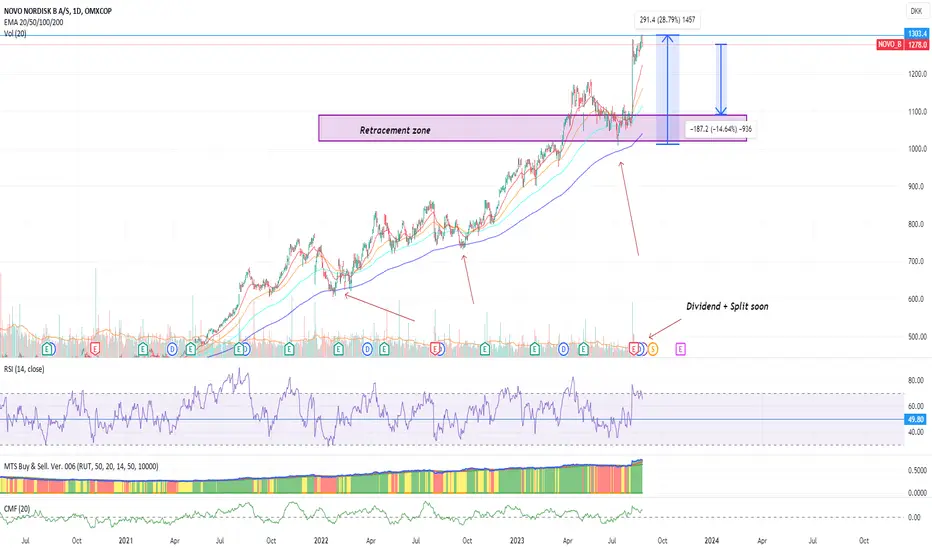
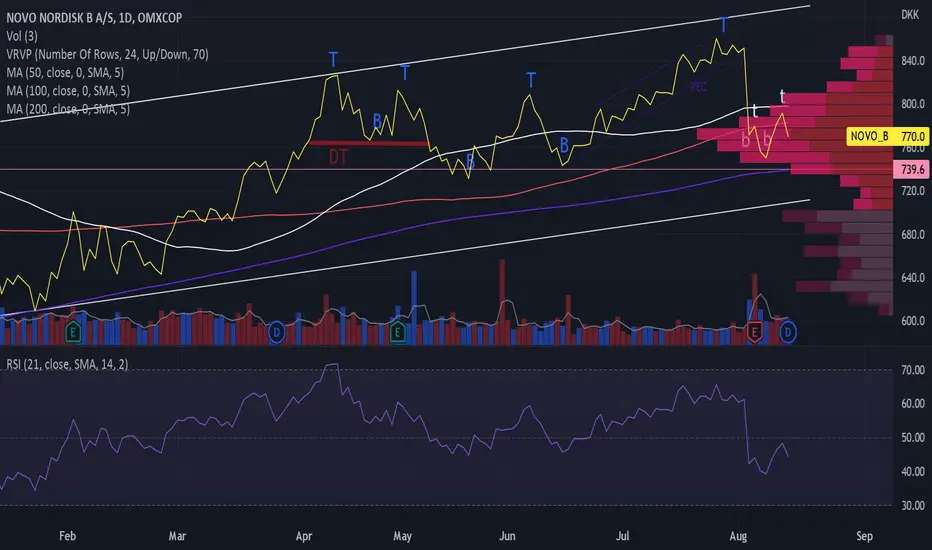
Novo Nordisk - Short term retracement for new momentumRSI over 70.
I think it's time for a retracement - possible -15%.
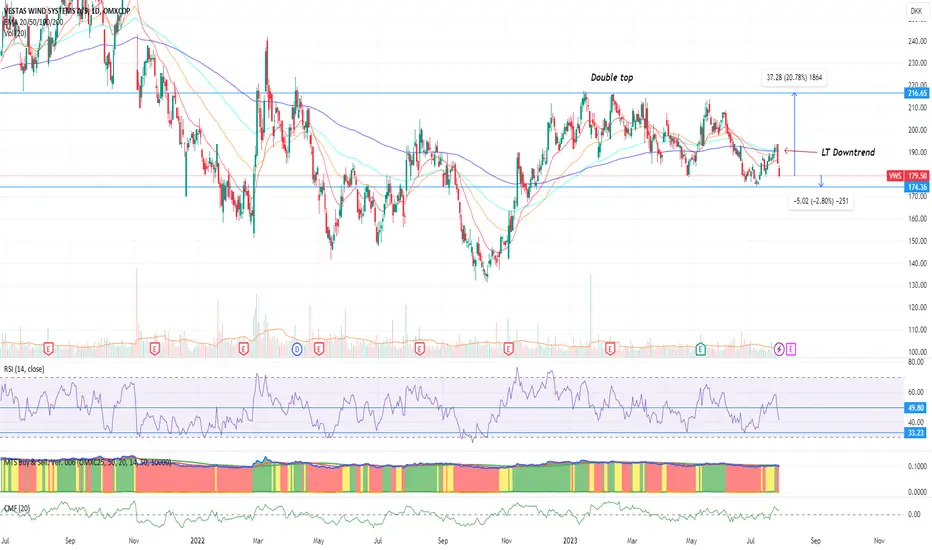
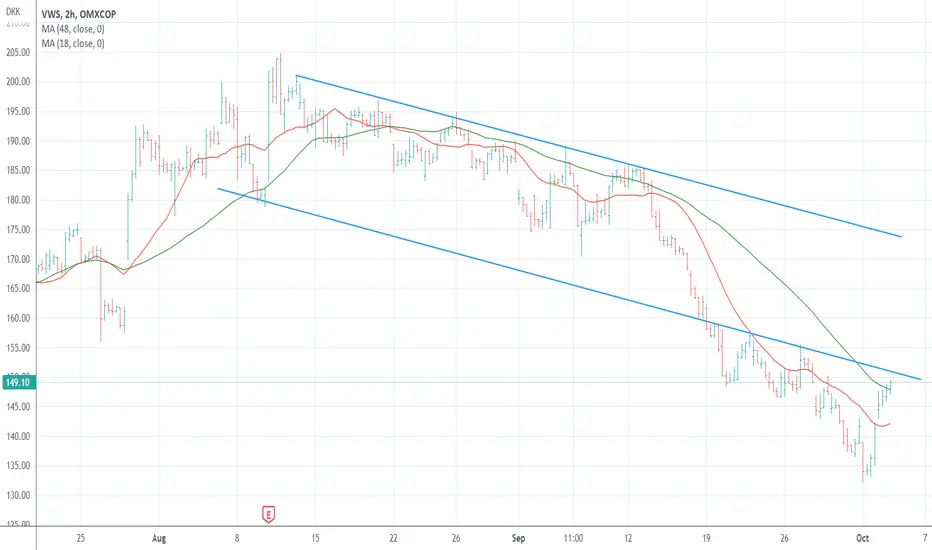
Vestas - Wait for breakdown or move back up - Consolidation zoneUps and downs. Mostly down for the danish company.
-3% until last bottom. More upside, but wait for confirmation. RSI moving fast towards 30.
Corrected stock with shakout , Cup completion and VCPOMXCOP:MAERSK_B is now corrected more than 50%. The chart shows a shakeout, along with cup completion. This is an ideal scenario for breakout.

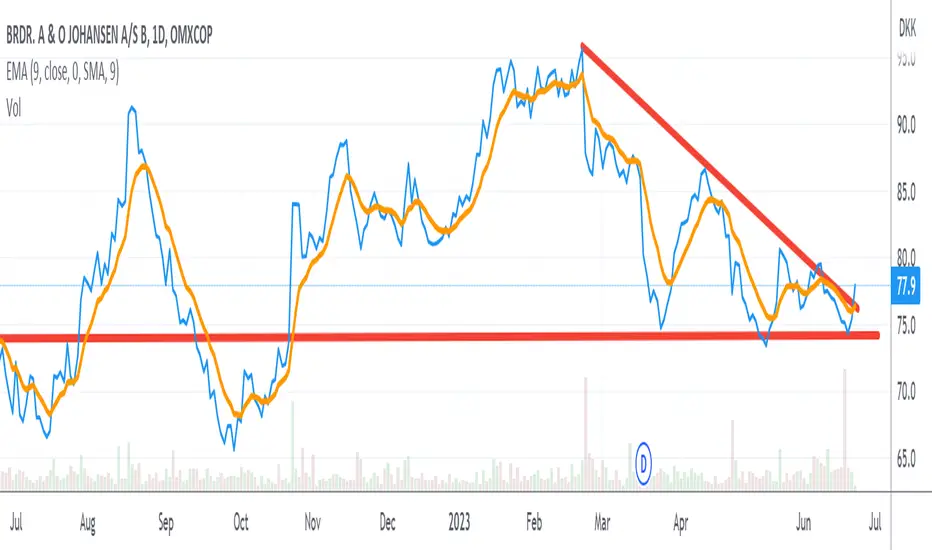
AO TrendLooks like the support is at 74 DKK.
And we have broken the down-trend, so know time for an up-trend?
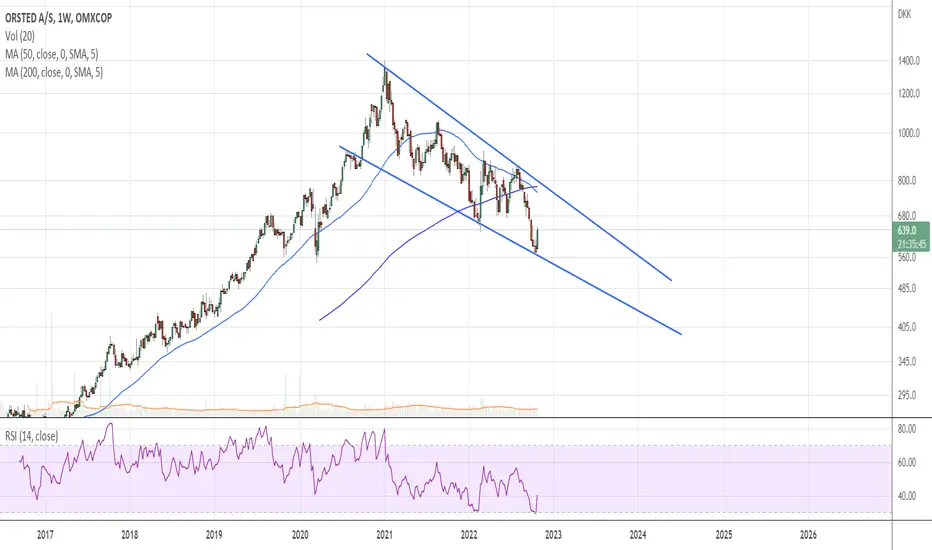
Orsted - short term long opportunityIntermediate downtrend continuation, short term uptrend - looking for prices between 700 - 720 DKK.
Vestas Vestas Green Energy have had a beating the last couple of years, bottom seems to be in.
Now some consolidation after a strong move, If it goes through the upper channel I have set my target.

Novo is still in an ascending trendMy post is primarily a technical analysis. It is important you understand a technical analysis is a forecast and has a probability, and not a statement that it will be absolutely certain.
Fundamental analysts (25) have on Trading View a price target of 1020. There is a wide spread, but most are positive about the stock.
Novo is still in an ascending trend as evidenced by the price movements and the moving averages.
The price has broken through the resistance at 966, where there is support now.
There are two REC, where the big one has an object about 1050 and the small an object about 1030.
There is a poor correlation between price peaks and volume peaks. This weakens the trend.
RSI just over 50. RSI and OBV do not go up as the price from the beginning of February.
From mid-February, the price has divergences to the stochastic oscillator %D.
The sum of oscillators and moving averages is from one day to a month on purchase.
Considering the stock technically positive for a medium length of time, one to 6 months.
Disclaimer: I hold a position in the stock.
Remember you need do your own research and assessment before buying and selling.
Sources: Trading View

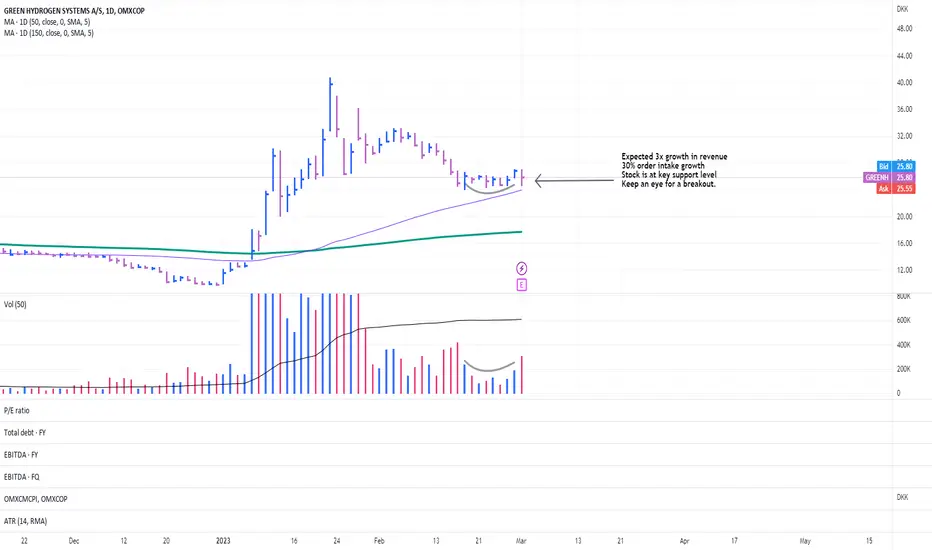
Keep an eye for breakoutPositive: The company is has a fast growing revenue and 30% increase in order intake. The stock has slowed down near key support level i.e. 50 SMA
Negative : No sign of EBIT improvement just yet.
Possible chance of breakout. Set your alerts
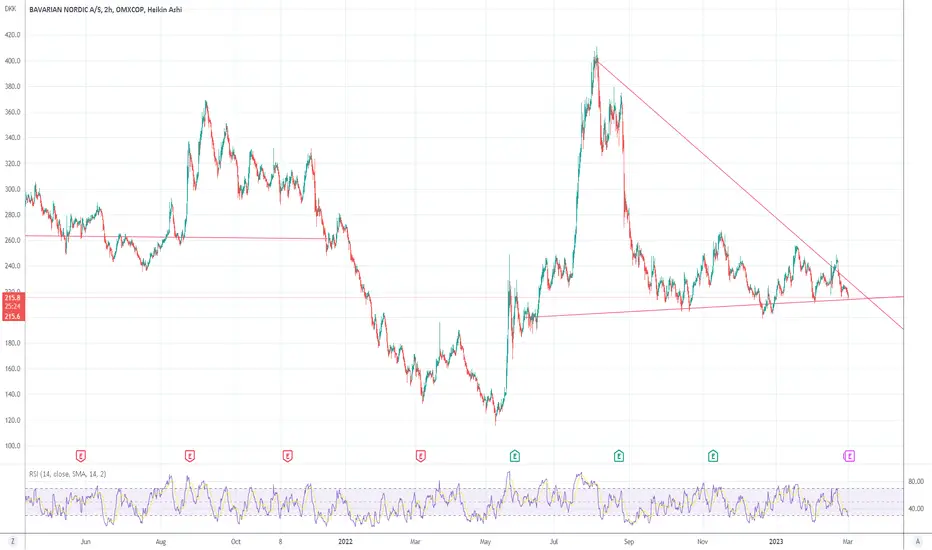
critical point herelet us se what happens here. The company has finansed it's pipelines and have also good thing in pipeline beside the selling of its vaccines.
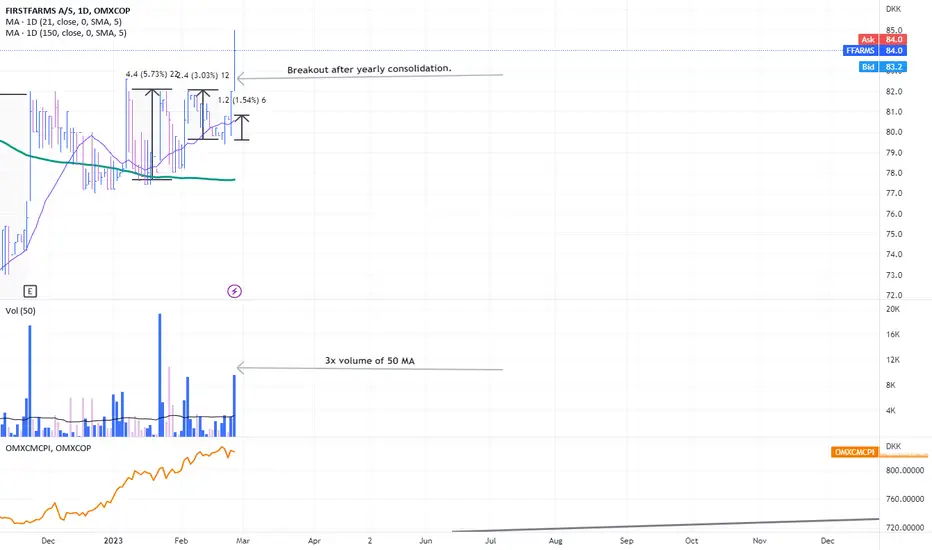
Breakout after yearly consolidationObservation: The stock usually breaks out after yearly consolidation. The stock is in own universe and uncorrelated with market moves.
Positive : The company has revised its revenue guidance twice.
Negative: Very low liquidity stock
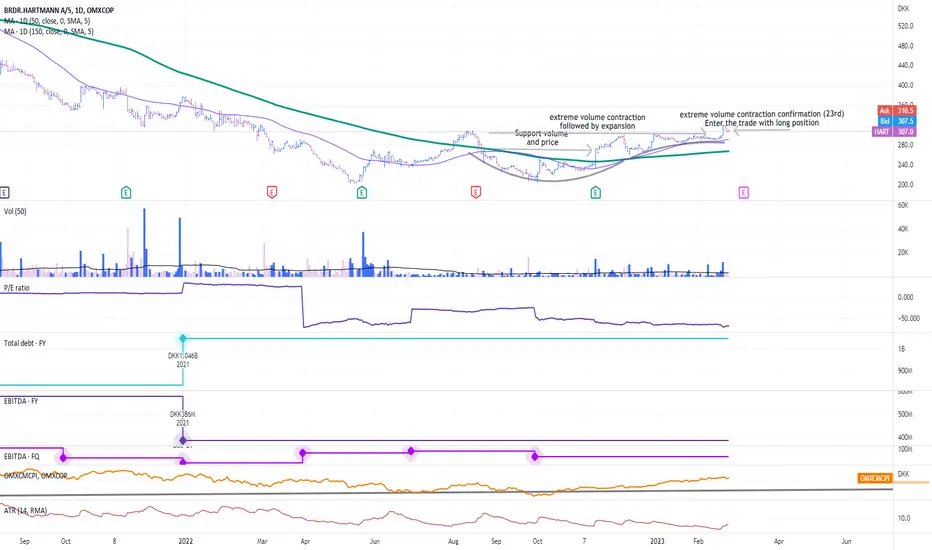
Clear VCP with confirmation volumesVCP pattern observed with confirmation of volumes.
Enter with long position.
VCP on SHAPEClear VCP pattern observed with improvement in fundamentals. Growth stock with 2022 to be a breakout year in revenue. Watch closely.
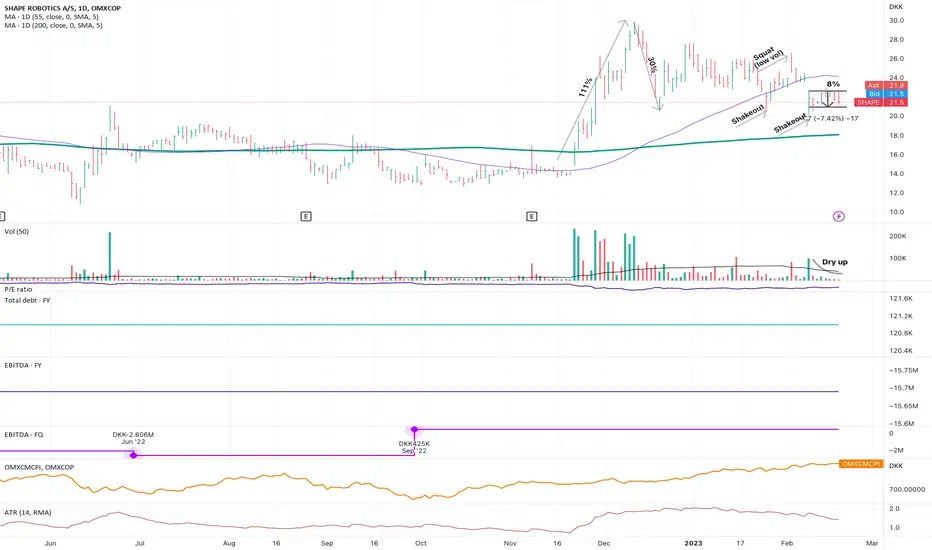
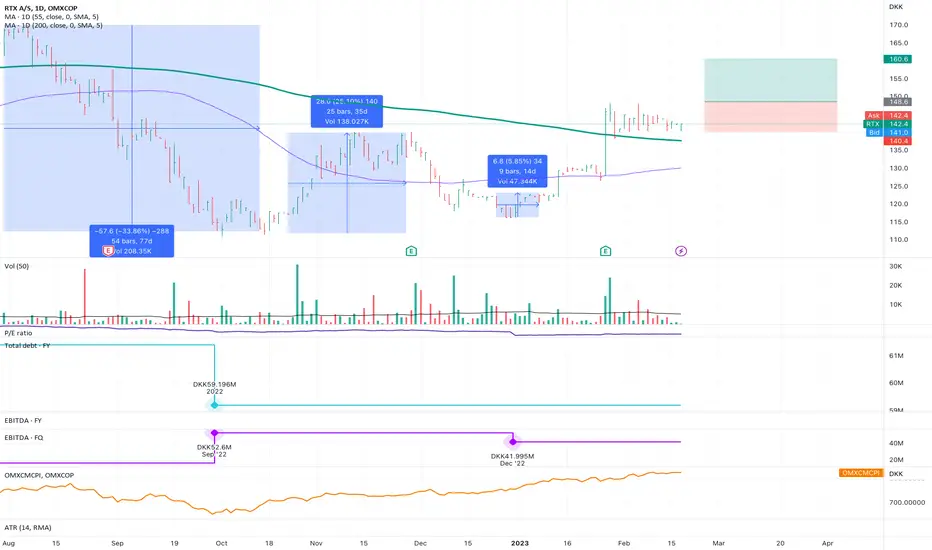
Improved technical and fundamentalsThe stock is in its own universe i.e. un correlated with market.
Fundamentally the company has manageable debt, sufficient EBIT, decent PE and bright future.
Technically it shows the end of downtrend, confirmation of the same and VCP.
It is highly illiquid, hence aim to quickly get in and get out.
Possibility to go long if it takes out high from the latest big-bullish candle.
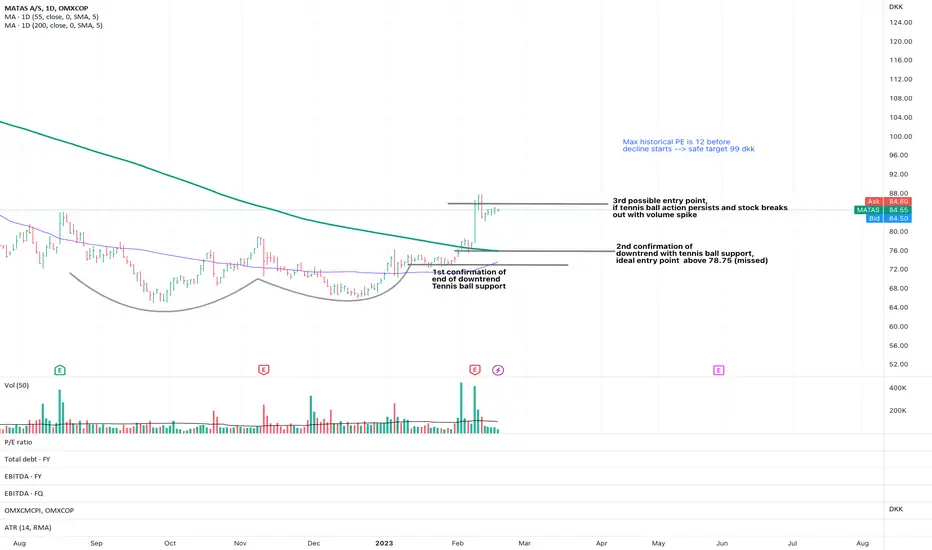
Breakout from cup completionComing off the bear market rally the stock has corrected 50% while the broad market corrected 29%.
End of downtrend confirmation.
Possibility to go long if tennis ball action persists during pull back.
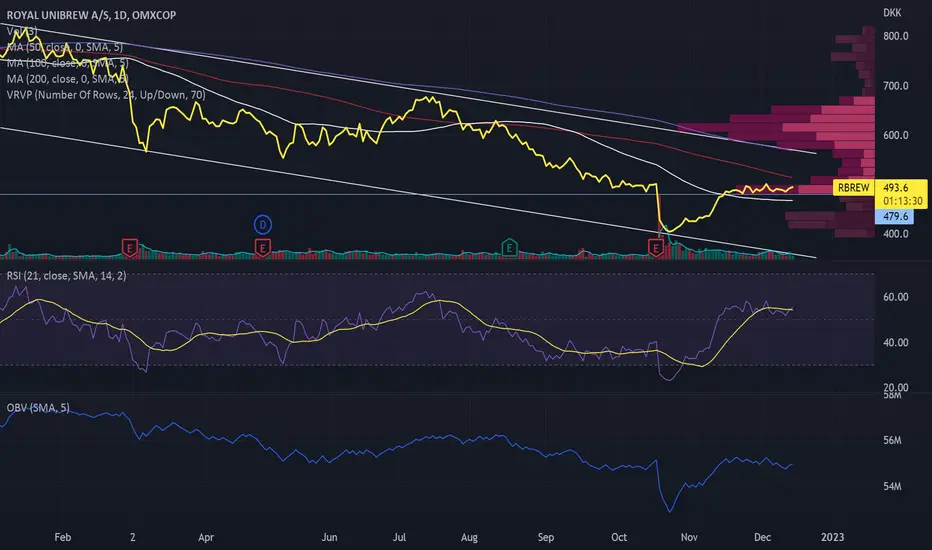
Royal Unibrew The stock is in a declining trend channel. It appears scroll. of the long moving averages and charts.
Looking back, there will be a support around 480 (5 year chart).
RSI 21 and OBV have gone up and then flattened out somewhat when you look at the last 40 days.
The last week some hammer candlestick pointing down.
MA and oscillators stand one month on neutral.
The price has been in a flat development for a little month and a clear movement up or down from here will give direction at least in the short term.
Consider the stock technically weak negative in the medium term.
This is a technical analysis, but fundamental analysts are preferably positive about the stock.
Remember you need do your own research and assessment before buying and selling.
Disclaimer: I hold a position in the stock.
Sources: Trading View
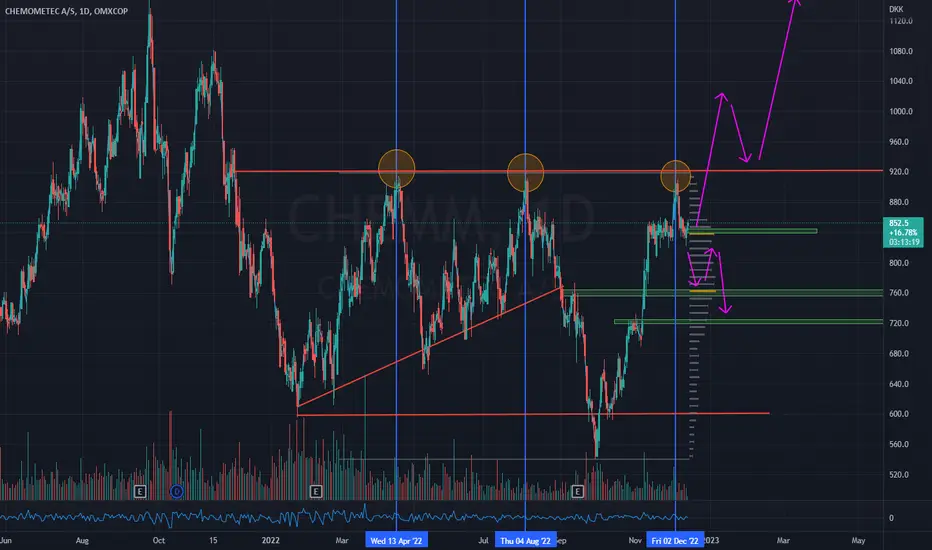
CHEMM - potential setupsSome thoughts about two potential setups. I'm most likely to believe in a bearish move on the shorter timeframe. But who knows?
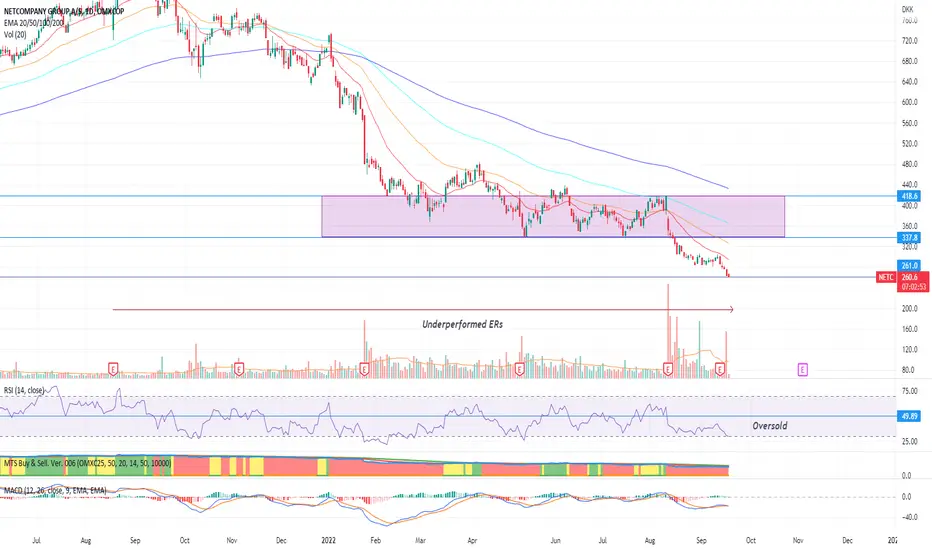
Netcompany breakdown RSI oversold.
Sellers in line to get out.
Breakdown of consolidation zone.
No support left.
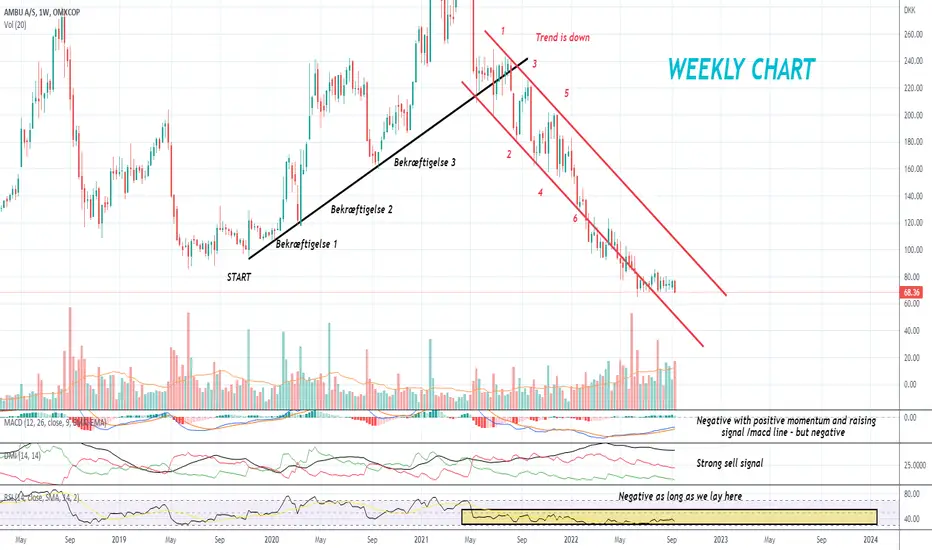
AMBU still going sown.Just wanted to make a fast update, but like 98 % of the rest of the market we are
in an downtrend.
They positive can be that its starting or started to look good on some signal on the lower timeframes, but the last couple of days have ruied that.
So as i see it , its still just a hold IF your holding or and wait if you want in, but we all trade deff , so remember your own reseach.
A defensive stock in a rising trend
Measured by value, Novo Nordisk is Northern Europe's largest business and headquartered in Bagsværd, Denmark.
It's a defensive stock that's done well. It is considered a bit of a weakness that they have the majority of their income on few products, but on the other hand they are good at what they are doing. There are some medicine companies that have spread too much and have had to give up some of what they have been doing.
This link provides a very good insight into the issue around Q2. It's in Danish.
app.marketingplatform.com
Price target: Trading View a year 860. Handelsbanken SE 3 years 925. Danske Bank 900.
This chart is YTD, but the trend lines are drawn after a longer chart 1Y.
Novo Nordisk is on a rising trend as evidenced by MA.
Volume supports the trend as price top respond to volume top and price bottom respond to volume bottom. On volume balance OVB rising 22 days back.
There was a dive after Q2 on August 4th, but the next day there are more people buying in than selling out on the first day.
RSI 21 slightly below 50.
Oscillators and MA stand on sell one day, neutral a week and buy a month.
Considers the stock technically positive for medium long time.
Disclaimer: I have a position in the stock.
Remember you need do your own research and assessment before buying and selling.
Sources: Trading View.
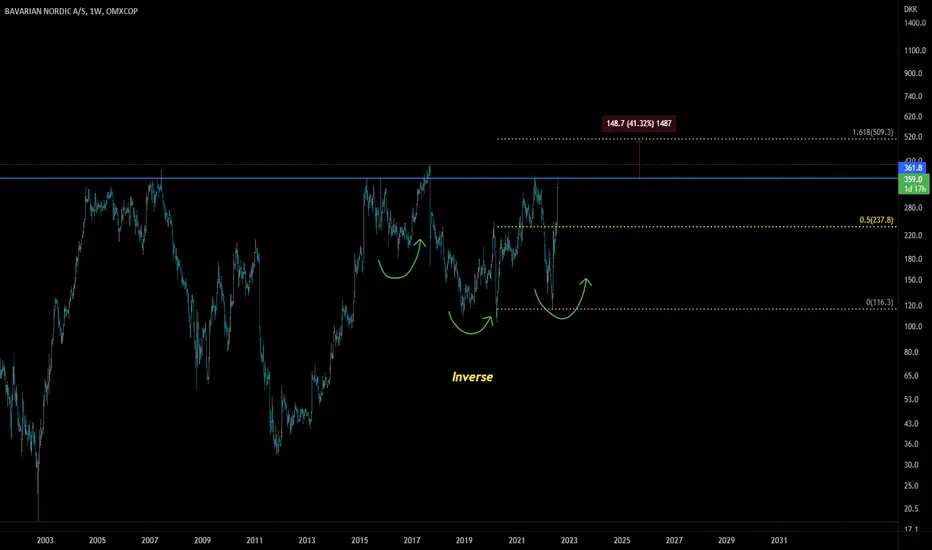
BAVA: Monkey Pox Pharma Inverse on Bullish NewsThis accompany has just opened a contract with US and EU markets for 800k dose for Monkey POX in the US. Inverse printing. When Moderna received a contract for COIVD is 4x'd. I cant see why this wouldn't at least pump another 40% to the 1.618