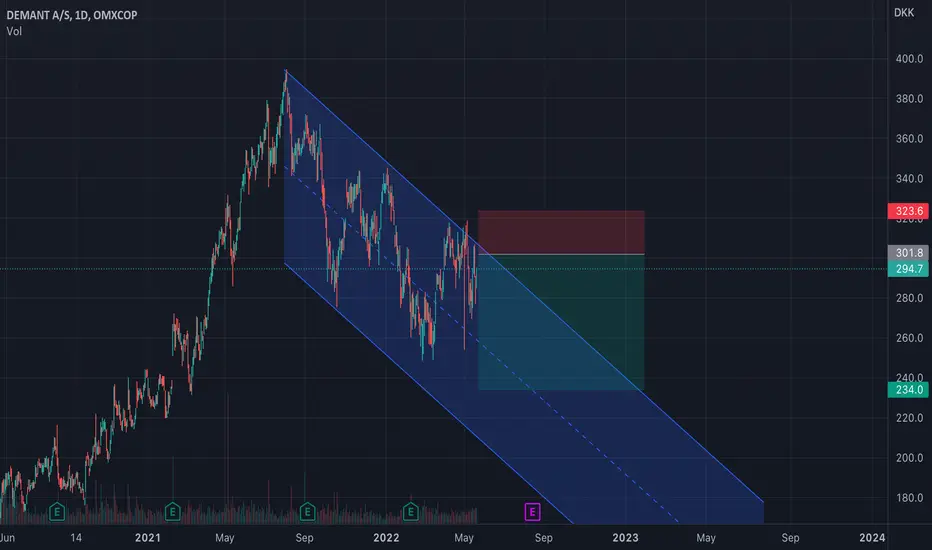
Short $DEMANT from 301,8Testing the top of channel. Hoping for reversal and establishment of new lower low.
SL: 323,6
TP: 234
R/R: 3,06
Pandemic 2.0This is not financial advice and any information that you take and act upon is at your sole discretion.
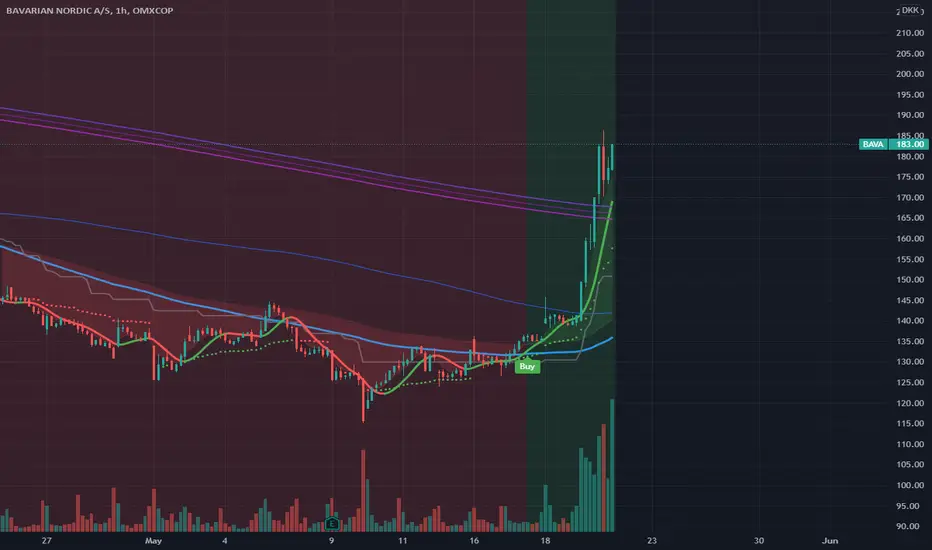
History doesn't repeat itself, but if often rhymes. If the saying holds true then Bavarian Nordic (BAVA) stands to see a great increase in it's stock price.
Listen to the video for a rundown of the fundamental analysis.
This is not financial advice and any information that you take and act upon is at your sole discretion.

Bought here last week at 520 somethingJust broke the downtrend an they have a nice revenue i think we will see 800-884 in like 3-6 month :) Gl
BAVA MonkeyPox VaccineHere we go again...?
"The spread of monkeypox boosted the shares of Bavarian Nordic A/S, which says it’s the only company to make a vaccine approved for the viral infection.
The Danish company gained as much as 26% in Copenhagen trading on Thursday after saying it had secured a contract to supply its smallpox shot -- which is also cleared against monkeypox -- to an undisclosed European country.
Monkeypox, a virus that is endemic in some forested parts of central and west Africa, has been found in a handful of cases in the UK, Spain and Portugal in recent days and in one person in the US. The World Health Organization said Wednesday it was monitoring a situation that 'is evolving rapidly.' "
www.bloomberg.com
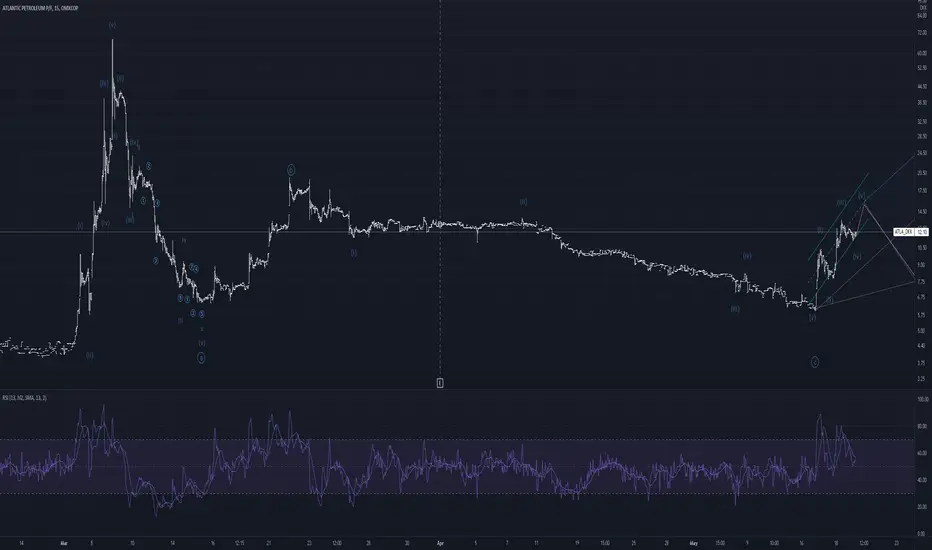
ATLA_DKK possibly bullishCorrection from the top over and a bull run is starting. This time probably with a more steady incline and a significant wave 2 pull back coming soon
(Atlantic Petroleum P/F)
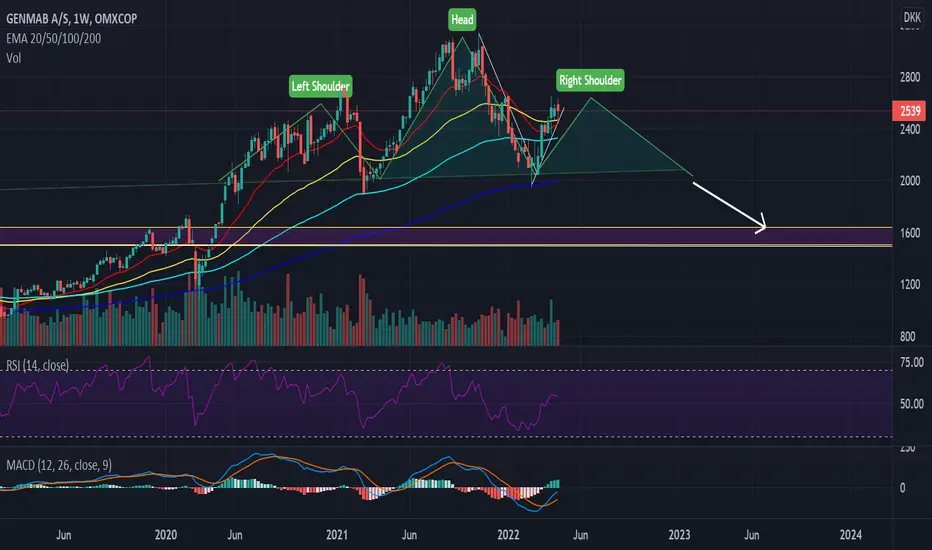
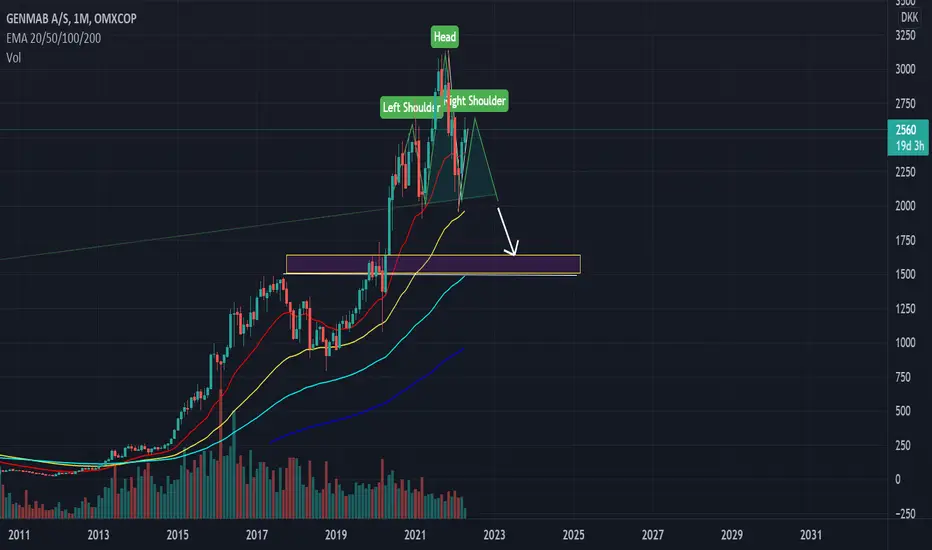
Genmab is a era done ?I have sold all of my genmab shares i started to buy at the start of corona, 5 year tmeframe i think we see a head an shoulder formation an hoping to buy again 15-1600 kr :)
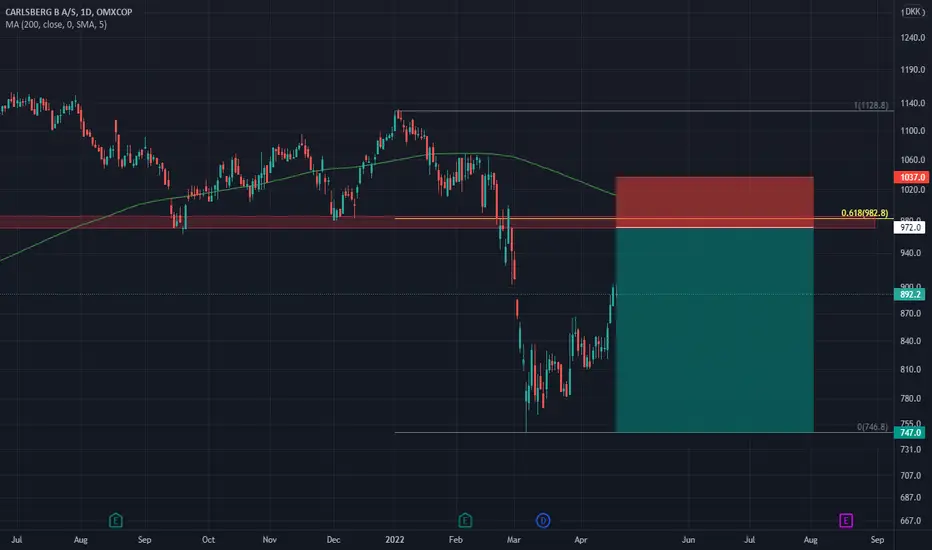
Carlsberg Hangover Incoming? Carlsberg
Short Term - We look to Sell at 972 (stop at 1037)
Preferred trade is to sell into rallies. We have a 61.8% Fibonacci pullback level of 984 from 1131 to 747. 200 1day MA is at 1012. Previous resistance located at 980.
Our profit targets will be 747 and 712
Resistance: 900 / 980 / 1100
Support: 800 / 750 / 700
Disclaimer – Saxo Bank Group. Please be reminded – you alone are responsible for your trading – both gains and losses. There is a very high degree of risk involved in trading. The technical analysis, like any and all indicators, strategies, columns, articles and other features accessible on/though this site (including those from Signal Centre) are for informational purposes only and should not be construed as investment advice by you. Such technical analysis are believed to be obtained from sources believed to be reliable, but not warrant their respective completeness or accuracy, or warrant any results from the use of the information. Your use of the technical analysis, as would also your use of any and all mentioned indicators, strategies, columns, articles and all other features, is entirely at your own risk and it is your sole responsibility to evaluate the accuracy, completeness and usefulness (including suitability) of the information. You should assess the risk of any trade with your financial adviser and make your own independent decision(s) regarding any tradable products which may be the subject matter of the technical analysis or any of the said indicators, strategies, columns, articles and all other features.
Please also be reminded that if despite the above, any of the said technical analysis (or any of the said indicators, strategies, columns, articles and other features accessible on/through this site) is found to be advisory or a recommendation; and not merely informational in nature, the same is in any event provided with the intention of being for general circulation and availability only. As such it is not intended to and does not form part of any offer or recommendation directed at you specifically, or have any regard to the investment objectives, financial situation or needs of yourself or any other specific person. Before committing to a trade or investment therefore, please seek advice from a financial or other professional adviser regarding the suitability of the product for you and (where available) read the relevant product offer/description documents, including the risk disclosures. If you do not wish to seek such financial advice, please still exercise your mind and consider carefully whether the product is suitable for you because you alone remain responsible for your trading – both gains and losses.
in the stockIn the stock , can see i nice cup an handle but it looks like a dark cloud cover ? im not a pro so what do you think up or down ? bought it at like 50 kr im not selling
in the stockHello again, i bought this stock last year at like 1500 kr, but unf. i see a Head an should forming in think it will fall a little back, of course i hope im wrong an go up from here :) An not selling holding at least 5-20 years :)
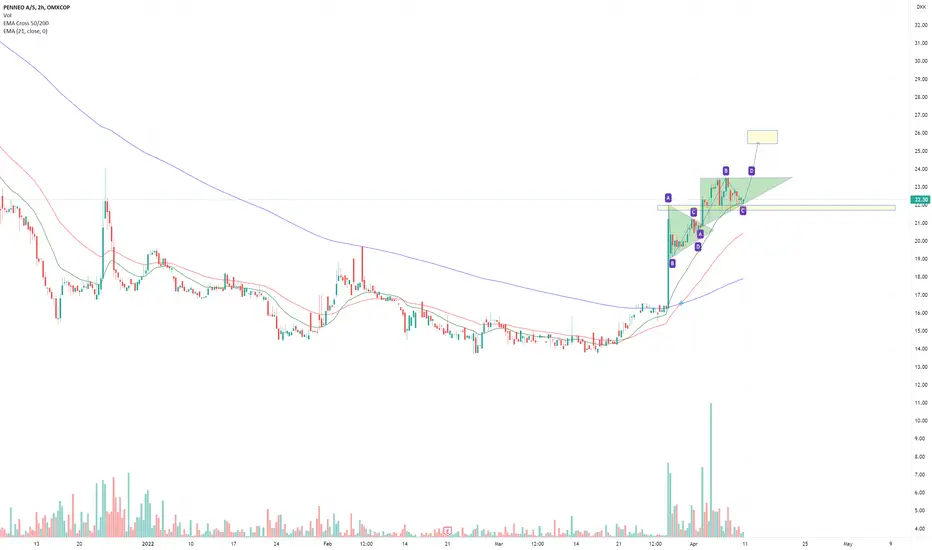
PENNEO AS is showing bullish momentumThe Danish SaaS company Penneo AS provide services for digital signing similar to DocuSign. Furthermore, they also provide services to ensure KYC and AML compliance. Small compared to DocuSign, but for sure a competitor with a large potential.
The stock price have shown bullish momentum in the smaller time frames. In the near future a stock price of DKK 25-26 is within reach providing a gain around 15% based on previous close.
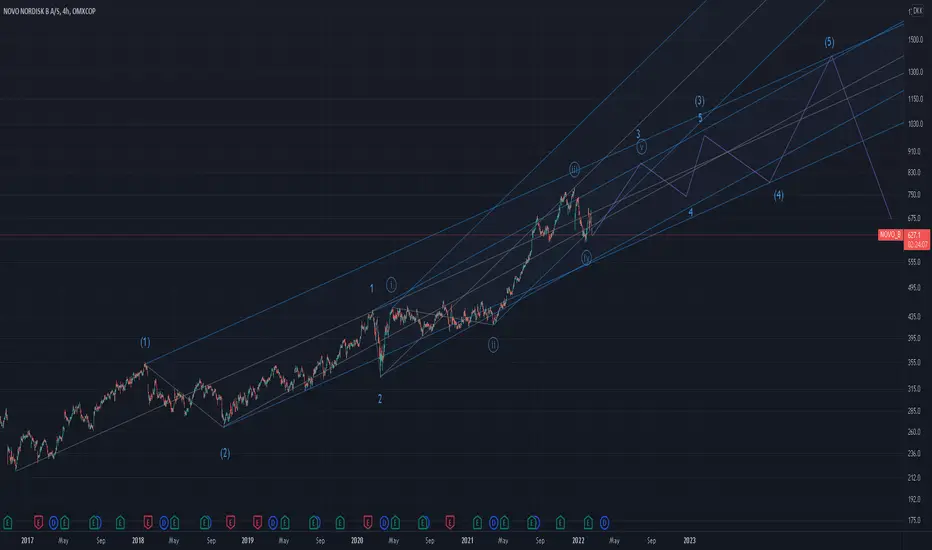
NOVO short target 600It seems NOVO is ending x in a corrective xyz of (4)
Target 600 during april 2022 before further upside during the rest of the year

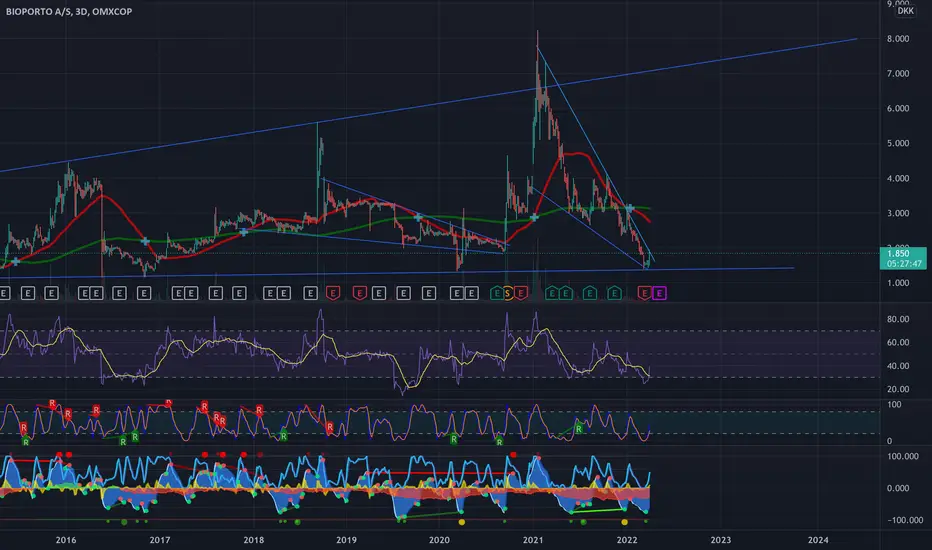
Ready for a pump :-)Bioporto looks like its coiling up to a pump to the upside, are you positioned? :-)
I dont know anything, trust yourselves.
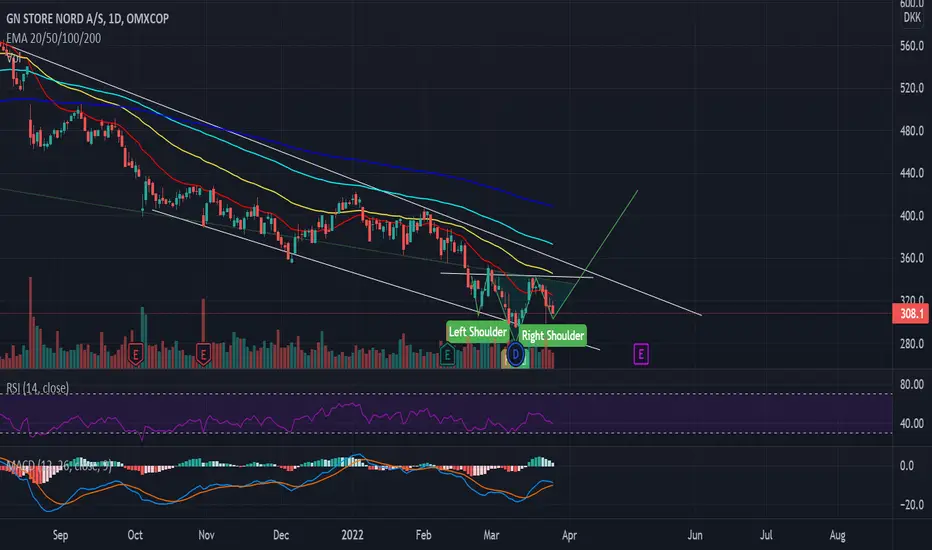
Gn store nord not in thisIm not in this yet but thinking of buying this asap with a beutiful inv. h&s we have a gap at 500 kr ish
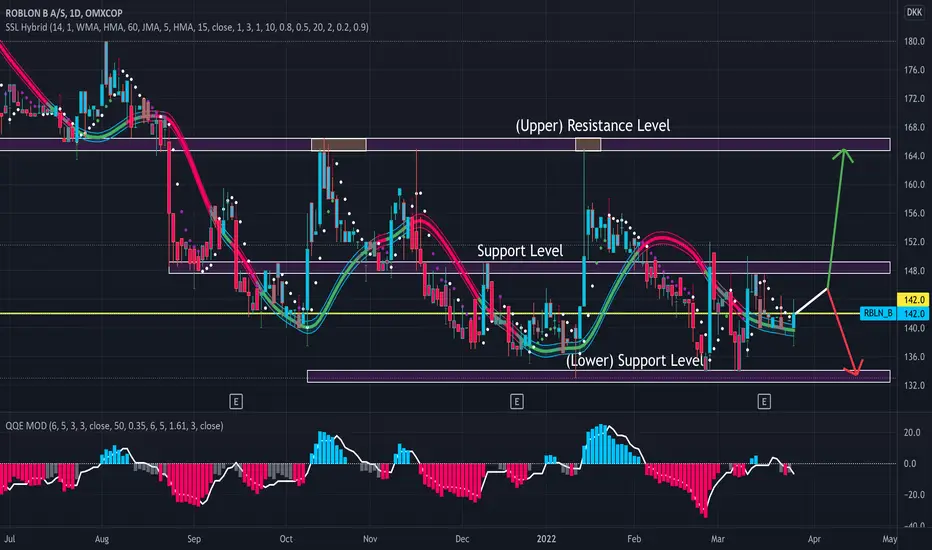
Roblons time to fly during the next weeks.It looks like it's Roblons time to fly during the next weeks.
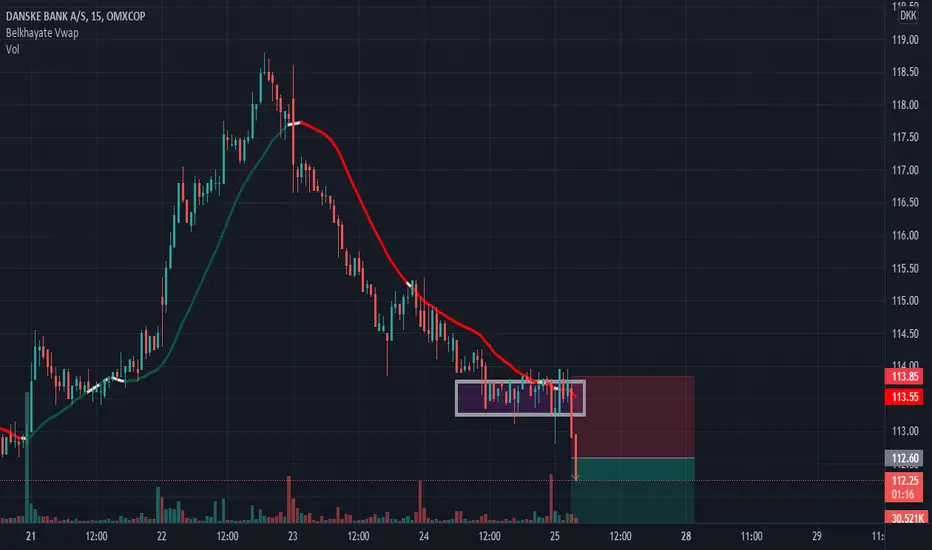
REVERSAL TREND ON DANSKEOn DANSKE as we remark sellers are there. We initially predicted an uptrend but we see that the sellers are resistant. DOWNTREND... THANKS
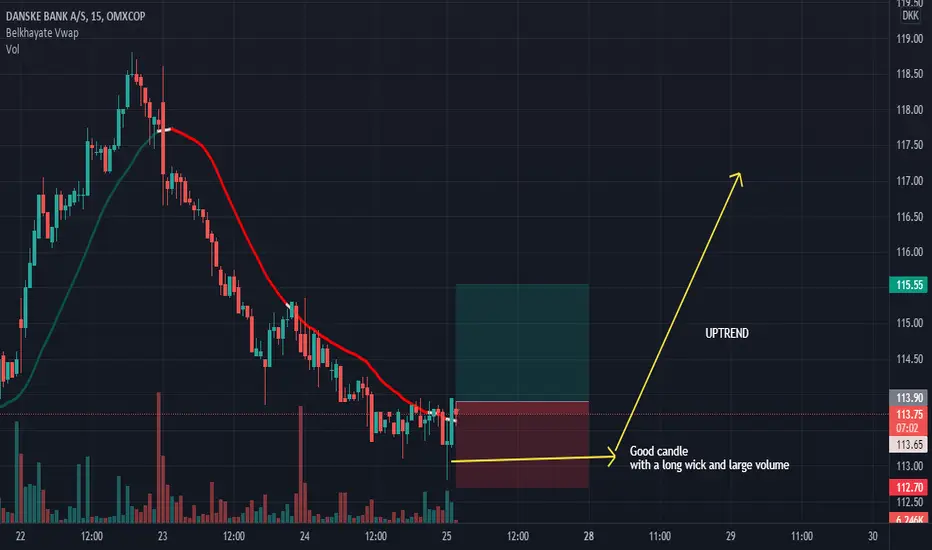
ANALYSIS ON DANSKE/ BUYGood morning !! On DANSKE we have a big probability to buy. If you see on the chart we have a cande with a long wick and large volume that confirm our buy.
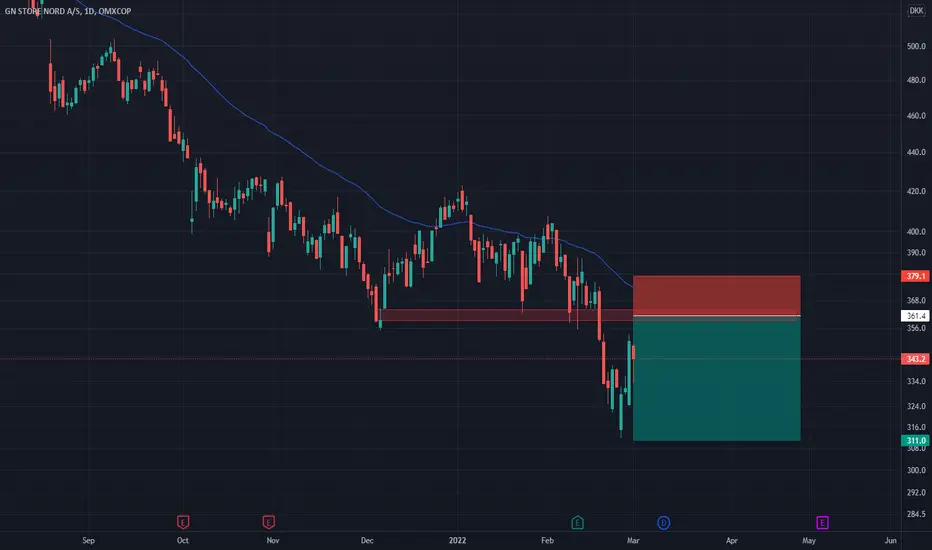
GN: Further Downside in Store? GN Store Nord - Short Term - We look to Sell at 361.40 (stop at 379.10)
The primary trend remains bearish. Previous support, now becomes resistance at 360.00. 50 1day EMA is at 373.00. Preferred trade is to sell into rallies. Expect trading to remain mixed and volatile.
Our profit targets will be 311.00 and 304.50
Resistance: 360.00 / 380.00 / 420.00
Support: 310.00 / 300.00 / 290.00
Disclaimer – Saxo Bank Group. Please be reminded – you alone are responsible for your trading – both gains and losses. There is a very high degree of risk involved in trading. The technical analysis, like any and all indicators, strategies, columns, articles and other features accessible on/though this site (including those from Signal Centre) are for informational purposes only and should not be construed as investment advice by you. Such technical analysis are believed to be obtained from sources believed to be reliable, but not warrant their respective completeness or accuracy, or warrant any results from the use of the information. Your use of the technical analysis, as would also your use of any and all mentioned indicators, strategies, columns, articles and all other features, is entirely at your own risk and it is your sole responsibility to evaluate the accuracy, completeness and usefulness (including suitability) of the information. You should assess the risk of any trade with your financial adviser and make your own independent decision(s) regarding any tradable products which may be the subject matter of the technical analysis or any of the said indicators, strategies, columns, articles and all other features.
Please also be reminded that if despite the above, any of the said technical analysis (or any of the said indicators, strategies, columns, articles and other features accessible on/through this site) is found to be advisory or a recommendation; and not merely informational in nature, the same is in any event provided with the intention of being for general circulation and availability only. As such it is not intended to and does not form part of any offer or recommendation directed at you specifically, or have any regard to the investment objectives, financial situation or needs of yourself or any other specific person. Before committing to a trade or investment therefore, please seek advice from a financial or other professional adviser regarding the suitability of the product for you and (where available) read the relevant product offer/description documents, including the risk disclosures. If you do not wish to seek such financial advice, please still exercise your mind and consider carefully whether the product is suitable for you because you alone remain responsible for your trading – both gains and losses.
#VESTASWINDSYSTEMS #VWSWith the world being starved of #oil and #naturalgas, this will only accelerate the need for #greenenergy. #WindEnergy set to rocket in coming years…. #Vestas services tonnes of wind farms across the world. Make sure you take profits at these levels…

Novo Nordics about to finalize wave (3) with a wave 5Is seems NOVO is about to finish a minor wave 2 now to continue higher with an impulse to 5
There should be a long way to go still and targets between 1000 and 1400 are in reach
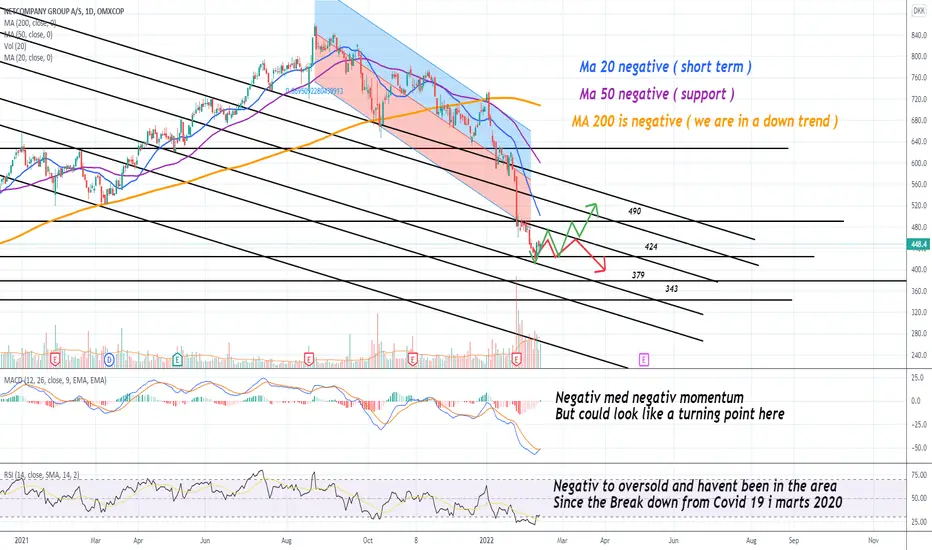
Netcompany A/S is falling but where is it gonna go ? As shown on the chart , we are deffently in a bear market on this one no douth about that.
But where is it gonna go next.
As the chart shown, we are on the 420-440 course and if that line dont hold we can see 377 but again the indicatores are very negative all aroundt and maybe even to much so and pull back or small gain to 490-520 is not out of the way befor it can continue down ( or start an new uptrend there )
BUT we have to follow the trend to see where it wanna go so we can TRY to find the bottum and then you say what is the bottum , well thats up to your way of traning when you should go in a trade, we are very defferent on how we all trade , some use support lines orther use MA lines and som priceaction and some wait for the hole trend to be positive befor jumping in , so again its up to each one of us, when we THINK its time ..
All i can is to show you the big picture and hope it helps you get a better entry point for your trading.
Good luck.
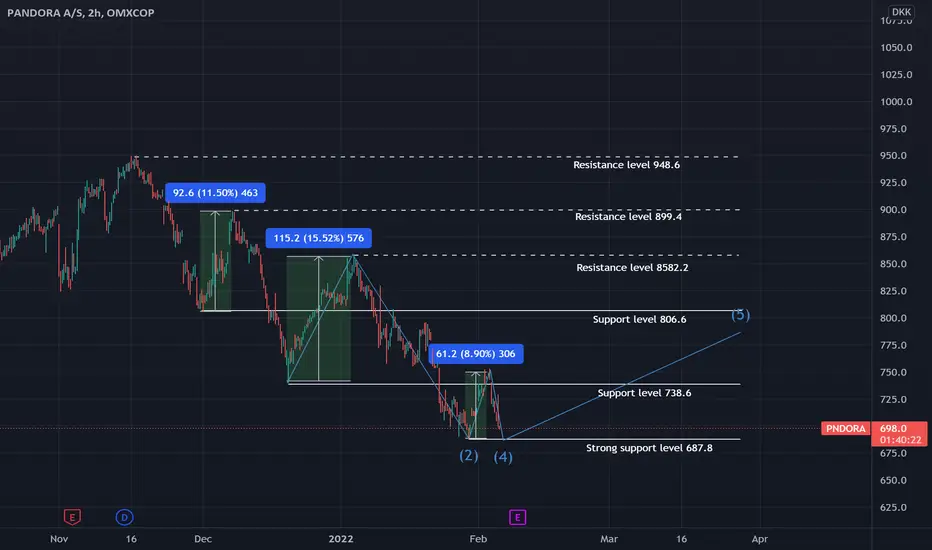
Pandora Bullish Technical AnalysisPandora is at a low point right now. It has a strong support under and some good support-points over. If Pandore gets a good support it will start a bullish trend. When is reaches the support it could go fast and go up a lot. Pandora will follow the OMX C25 Index and go up over the next few months.
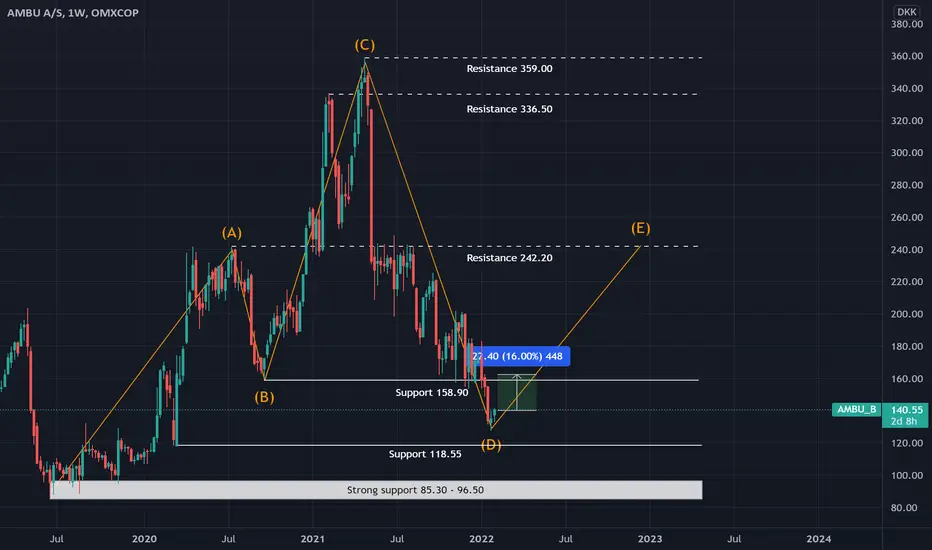
AMBU Technical Analysis AMBU is very low right now and it seems like it could go very high with the OMX C25 Index . It is at the lowest for almost 2 years and with the interest rates going down it could lift the shares a lot. There is a very strong support level under it and a good resistance goal.