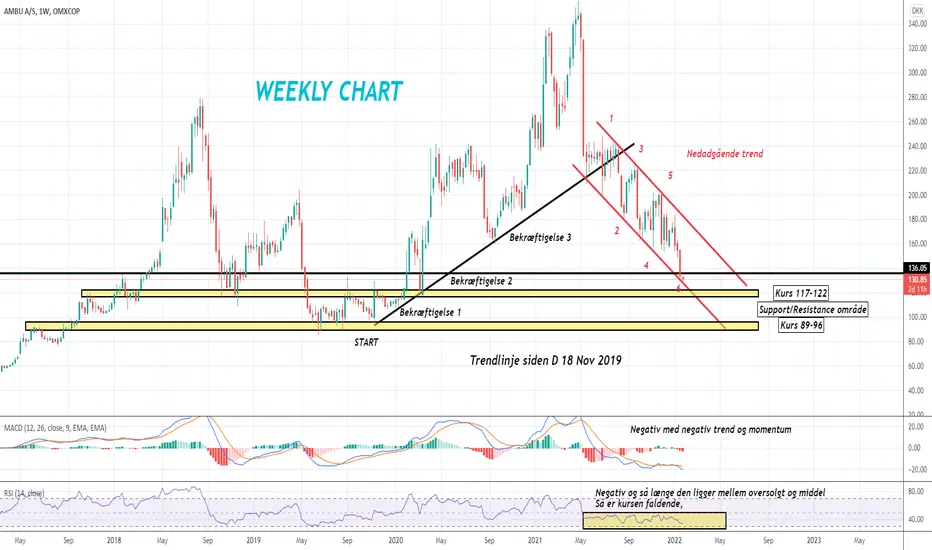
AUBU close to support area! where to next? 👇☝️Just an picture og the stock AMBU and how i see it and where i might be heading.
remember to do your own analysis and never trade out from others.
Stay humble
Marttin
wait for reversal 19.500-20.500Currently started a retracement. Waiting for supply zone between 19.500-20.500.

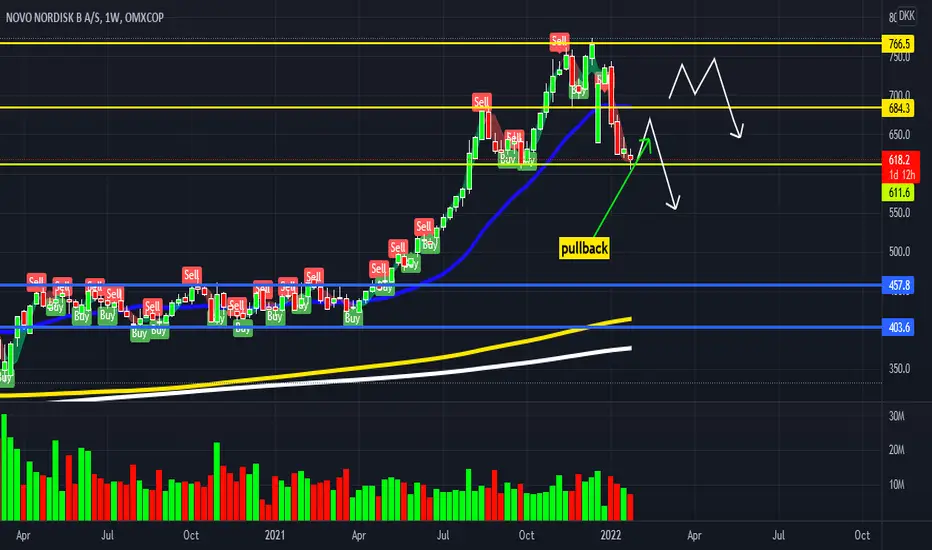
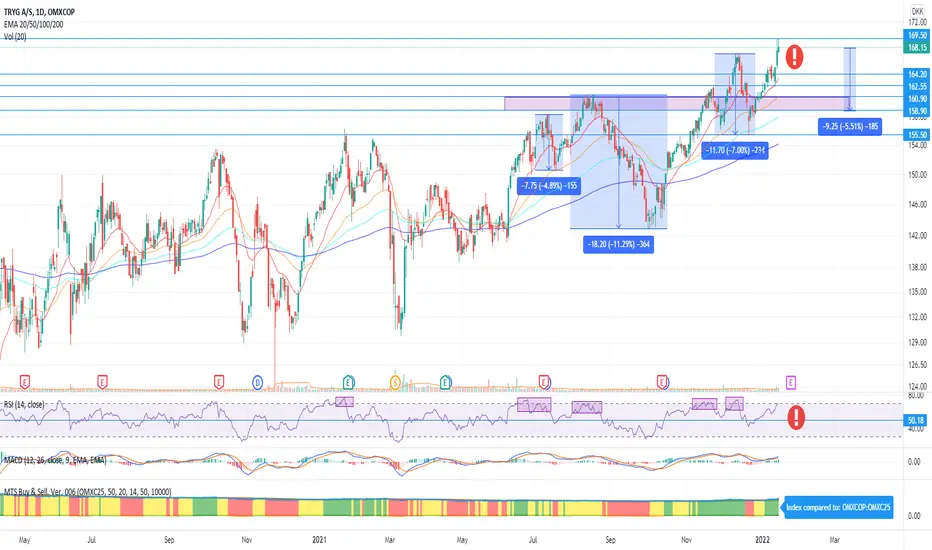
Possible pullback soon?Failed twice to break 169,35. Might face a minor retracement before a new reversal near 158-160.
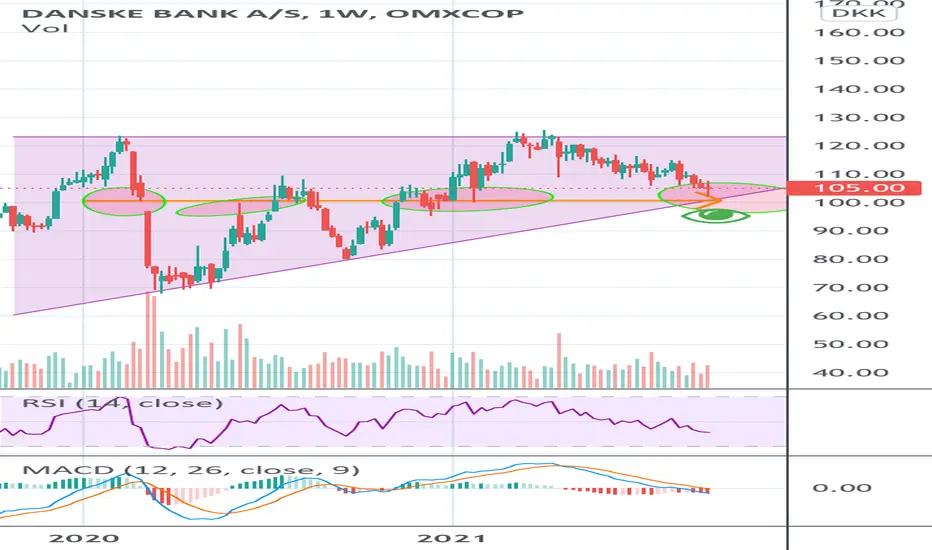
Classic flat top with a 22% potentialDanske Bank looks to be moving nice in a flat top pattern, now consolidating. I’d like to set my buy orders on 101-102 for a potentionally safer investment. Take a look at the eclipses highlighted in green. Strong interest here at this level. A break below is probably bearish. Good luck and hope you find my analysis interesting. Reminder, these are my trades alone, just sharing, invest on your own risk.
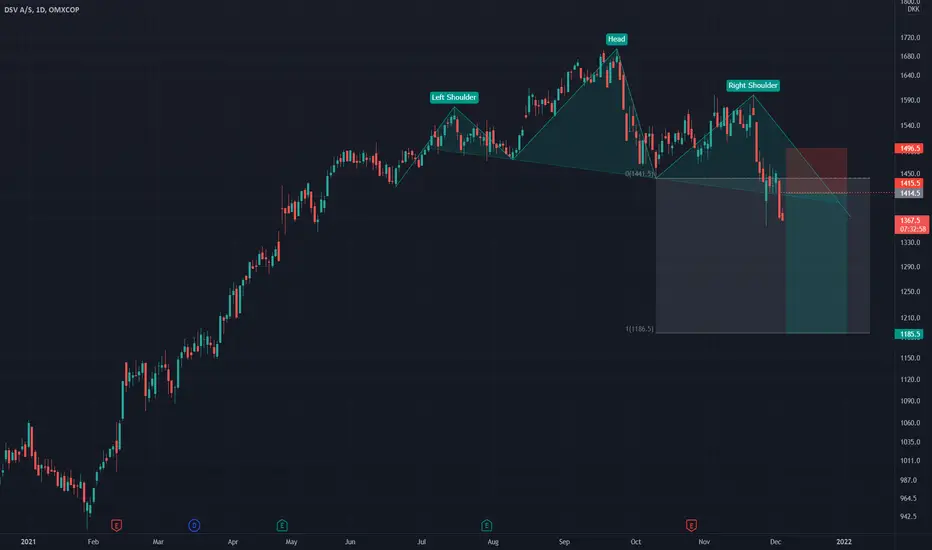
DSV: Head and Shoulders top completeDSV - Intraday - We look to Sell at 1415 (stop at 1496.5)
Broken out of the Head and Shoulders formation to the downside. There is scope for mild buying at the open but gains should be limited. A mild correction has been posted from yesterdays low, this is seen as a retest of the breakout level. Further downside is expected although we prefer to set shorts at our bespoke resistance levels at 1415, resulting in improved risk/reward. Expect trading to remain mixed and volatile.
Our profit targets will be 1185 and 1100
Resistance: 1415 / 1507 / 1560
Support: 1357 / 1346 / 1300
Disclaimer – Saxo Bank Group. Please be reminded – you alone are responsible for your trading – both gains and losses. There is a very high degree of risk involved in trading. The technical analysis, like any and all indicators, strategies, columns, articles and other features accessible on/though this site (including those from Signal Centre) are for informational purposes only and should not be construed as investment advice by you. Such technical analysis are believed to be obtained from sources believed to be reliable, but not warrant their respective completeness or accuracy, or warrant any results from the use of the information. Your use of the technical analysis, as would also your use of any and all mentioned indicators, strategies, columns, articles and all other features, is entirely at your own risk and it is your sole responsibility to evaluate the accuracy, completeness and usefulness (including suitability) of the information. You should assess the risk of any trade with your financial adviser and make your own independent decision(s) regarding any tradable products which may be the subject matter of the technical analysis or any of the said indicators, strategies, columns, articles and all other features.
Please also be reminded that if despite the above, any of the said technical analysis (or any of the said indicators, strategies, columns, articles and other features accessible on/through this site) is found to be advisory or a recommendation; and not merely informational in nature, the same is in any event provided with the intention of being for general circulation and availability only. As such it is not intended to and does not form part of any offer or recommendation directed at you specifically, or have any regard to the investment objectives, financial situation or needs of yourself or any other specific person. Before committing to a trade or investment therefore, please seek advice from a financial or other professional adviser regarding the suitability of the product for you and (where available) read the relevant product offer/description documents, including the risk disclosures. If you do not wish to seek such financial advice, please still exercise your mind and consider carefully whether the product is suitable for you because you alone remain responsible for your trading – both gains and losses.
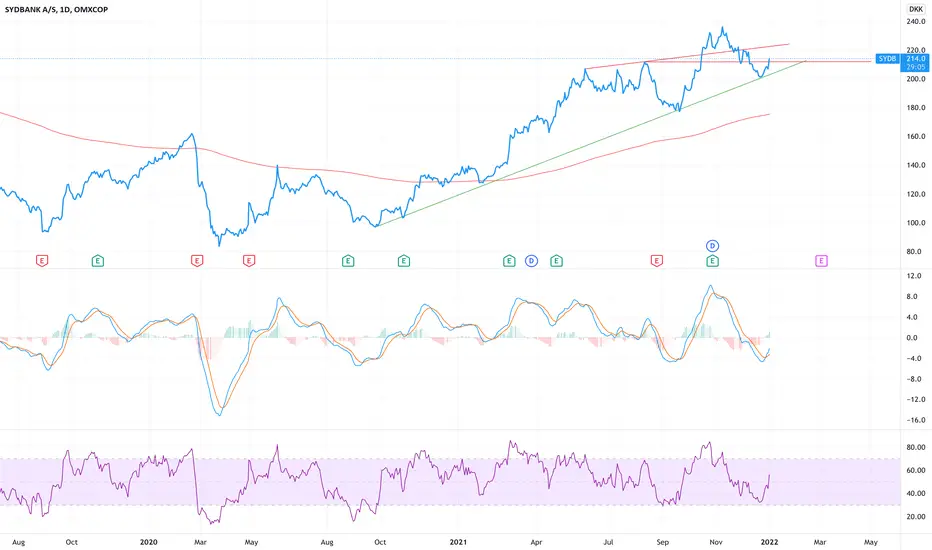
SydbankThe Sydbank stock appears to have reach the bottom of its show term downtrend in its long term uptrend, making it an attractive time to either buy into the stock or supplement current position. This argument is backed upped by several technical indicators, such as MacD indicating increasing volume in trade giving the stock momentum to break up through existing lines of resistance. We can also conclude that the stock is currently backed by buyers and not sellers, by looking at the position of the RSI indicator. Also bank stocks are at the moment very attractive considering increase rates of inflation on the consumer market, making the risk of increased interest rates greater than earlier seen.
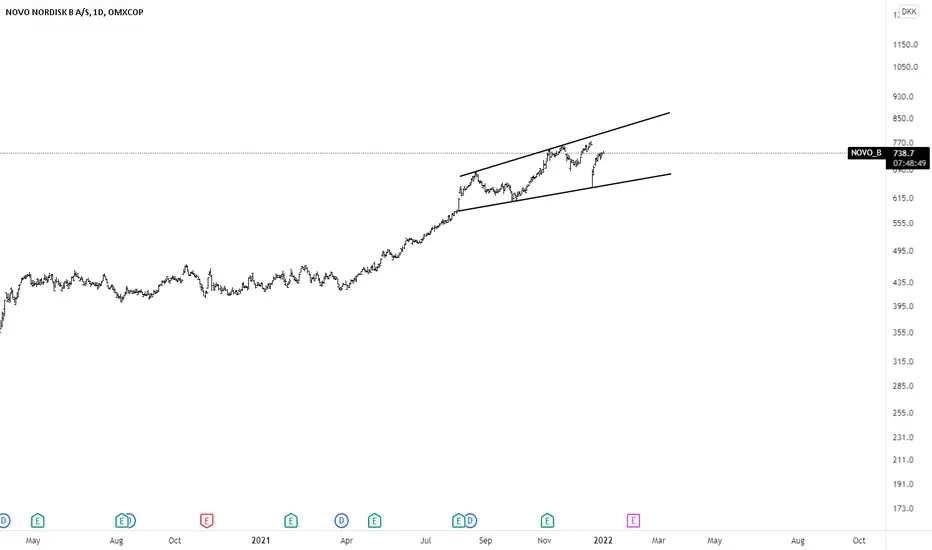
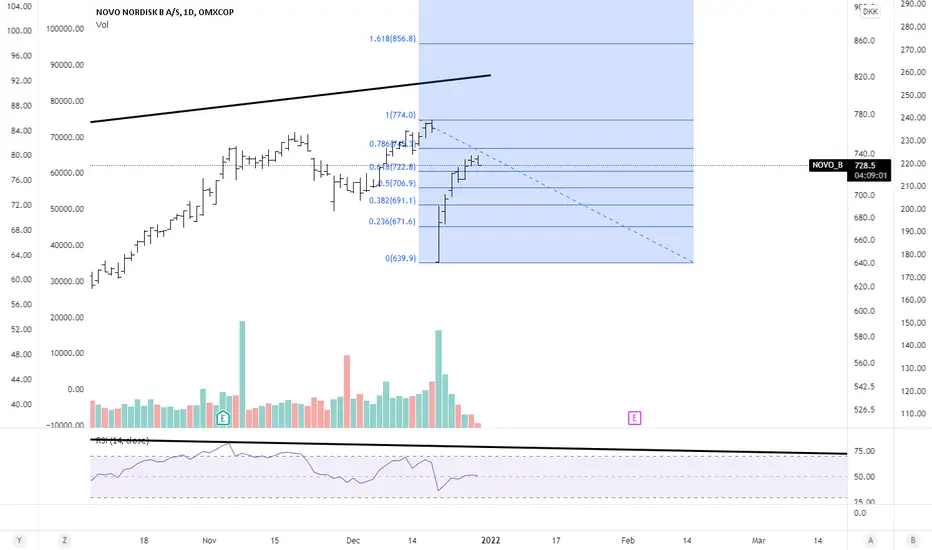
$NOVO #Novonordisk$NOVO #Novonordisk in the golden pocket. We should see some consolidation and would like to see if 700DKK hold.
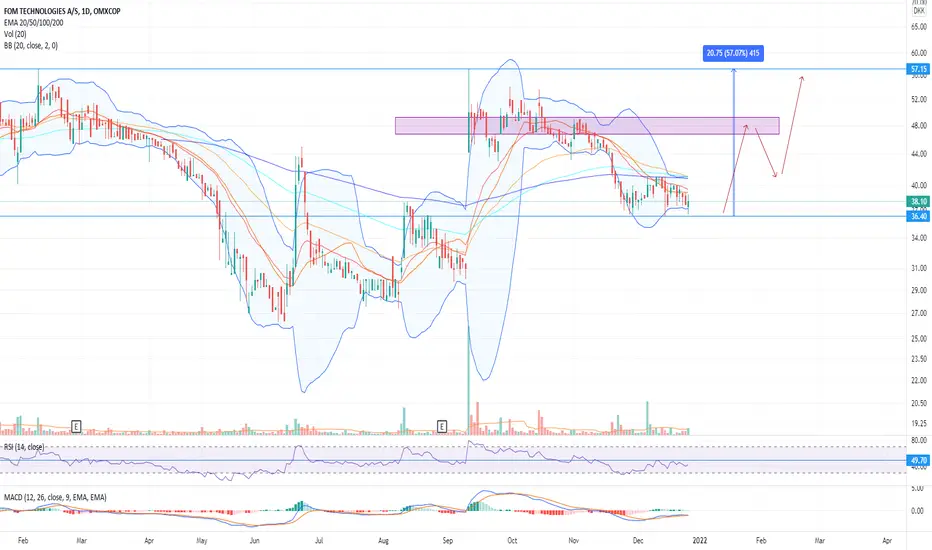
FOM near bottomFOM small cap stock.
Near bottom 36,40. Next run to 46-49, then a small retracement from resistance zone, before 60+.
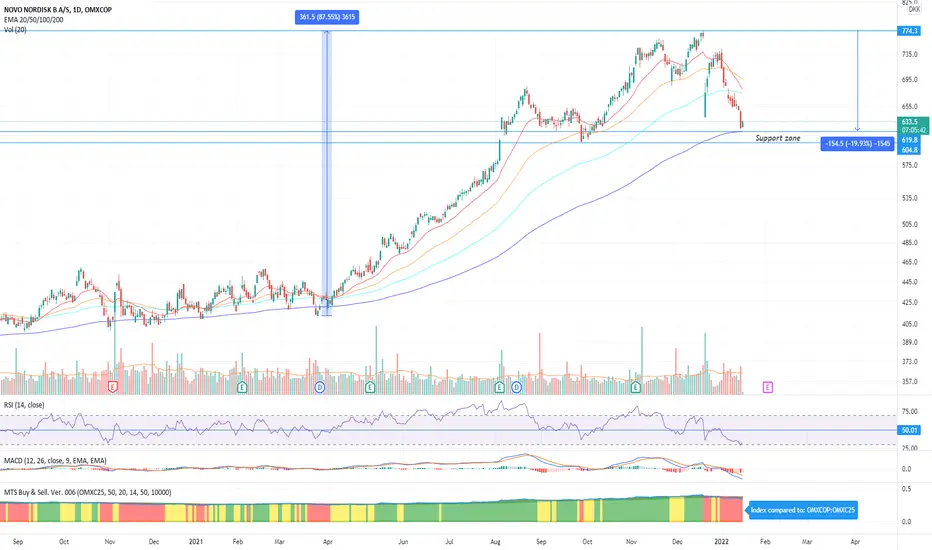
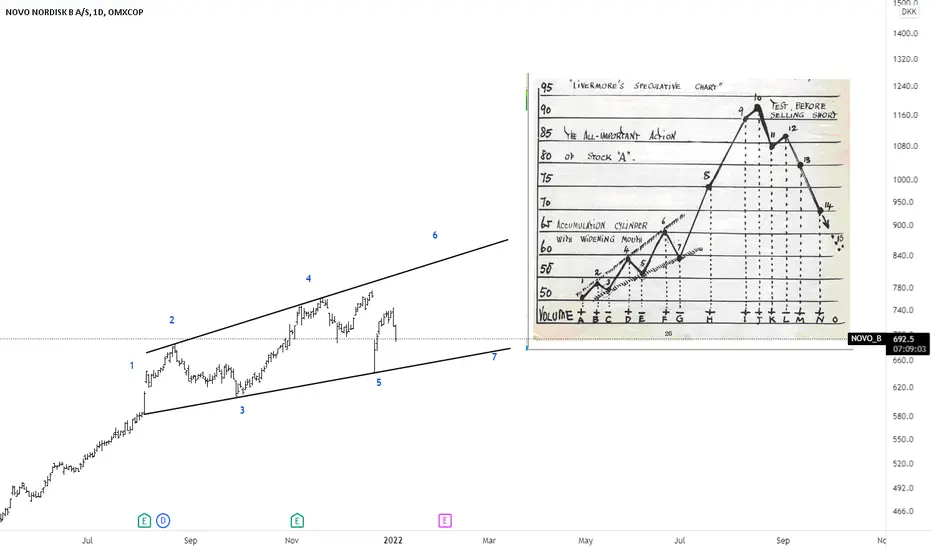
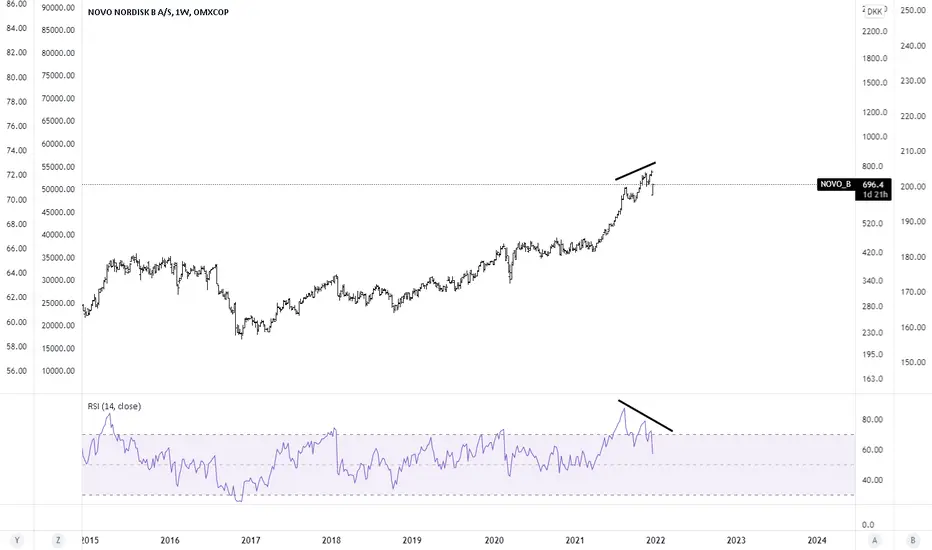
NOVO NORDISKBIG BEARISH DIVERGENCE IN THIS STOCK, The fall was led by SUPPLY CHAIN ISSUES on one of best selling product lines "Wegovy", but the product it self is not the challange.
I BELIEVE THE FALL WAS MORE BASED ON TECHNICALS THAN FUNDAMENTALS. AS THIS STOCK RARELY SEES ANY BIG DROP LIKE IT DID, THE DRAWDOWN ON THE DAILY WAS ALMOST 17% AND CLOSED THE DAY AT -11% WHICH IS MAKING A COMEBACK.
buyers take the hand If the trend break chanel with the volume you must buy by the up and sell by the down
SIMCORP A/S | UNDERVALUED | MARGIN OF SAFETY 47%Hello investors! It has been a while since I posted my latest investing idea/opprotunity.
I have been researching SIMCORP A/S for a while now.
For my intrinsic value I used a formula from "RULE 1 Investing" by Phil Town.
I have calculated 3 differend intrinsic values for 3 differend scenarios.
Optimistic: 1999,61 kr
Neutral: 1282,01 kr
Pesimistic: 837,64 kr
Actual value at the moment: 678,40 kr
This gives us a margin of safety of the neutral scenario of 47 %.
I would recommend to put STOP LOSS and TAKE PROFIT in the areas shown, but maybe consider the stock to be a long term buy, given the undervaluation, that you do not see often these days.
This makes SIMCORP A/S seem like a nice buy. In 2020 the stock value and company revenue has dropped by a lot, but looking into 2021 data gives me a strong confidence, that the stock should grow in the future.
I would like You to give any kind of feedback on my idea and maybe point out any flaws within the company, that can lead to stock price drop.
I wish you all successful investing!

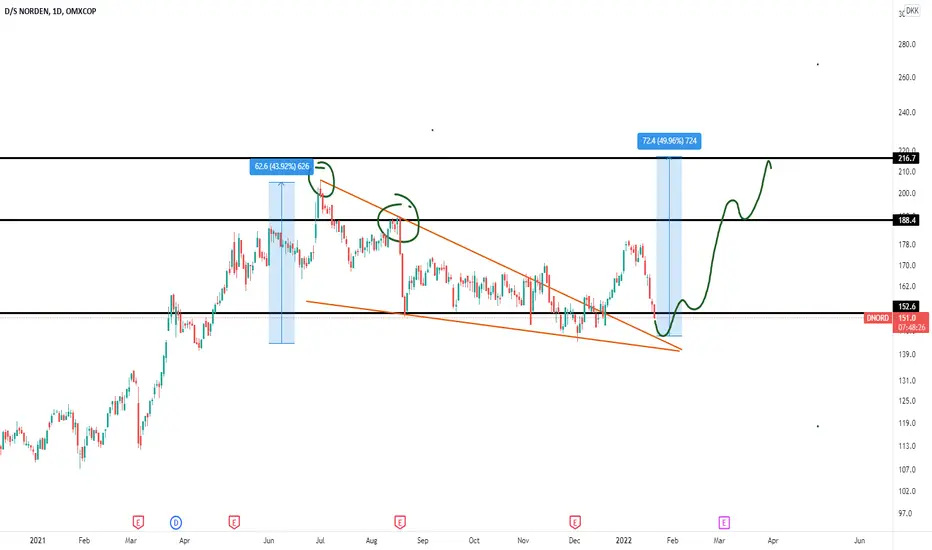
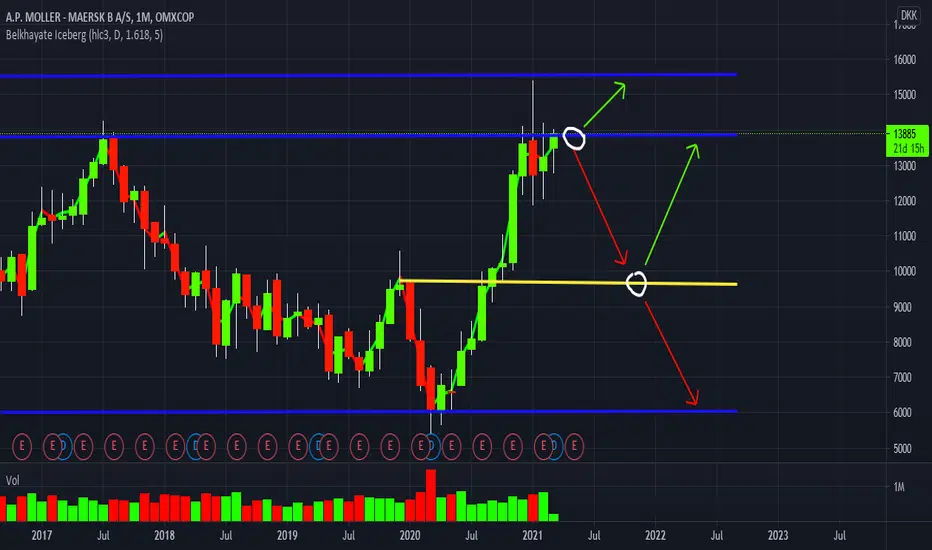
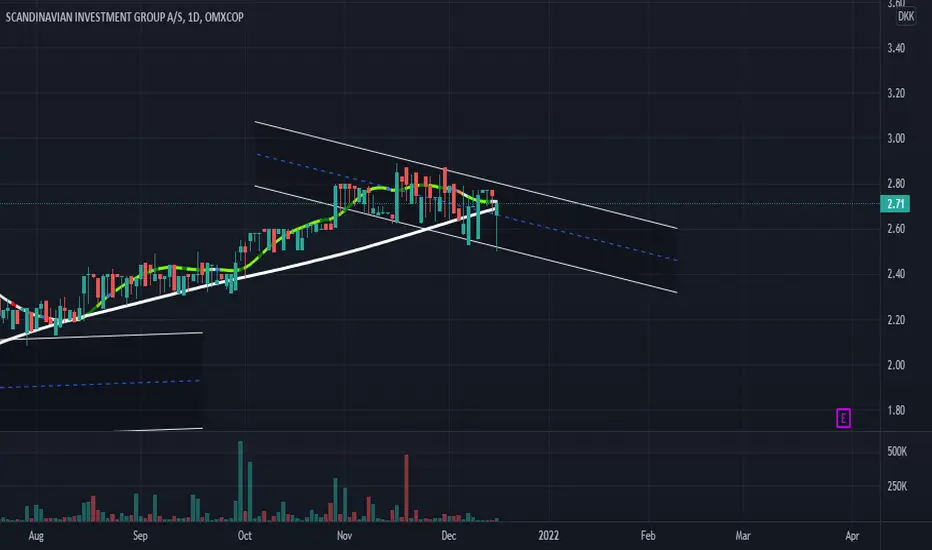
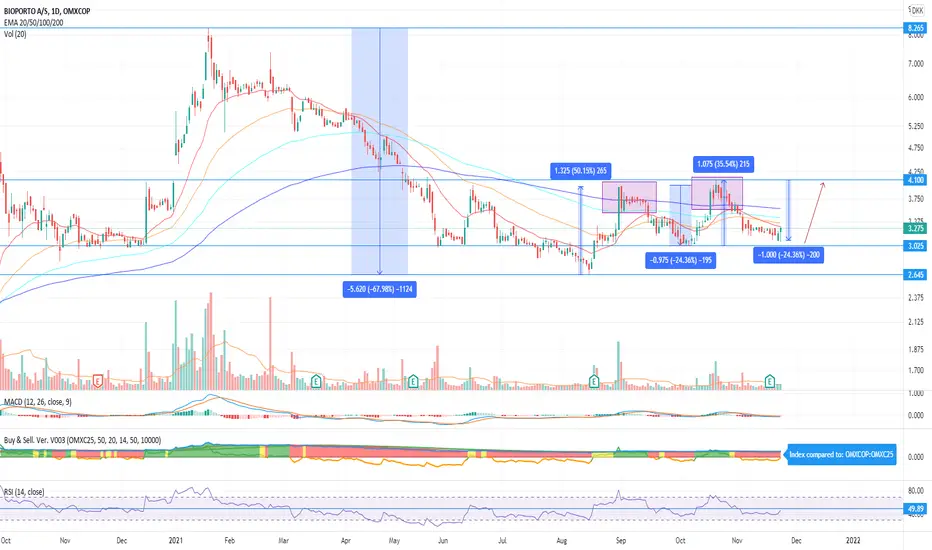
Possible reversal and swingA though year for the stock, but a new reversal might show. Last two times the price increased 35-50% followed by a -24,36% decrease. Seems like a great swing, with a SL at 3, and profit-take around +25%.
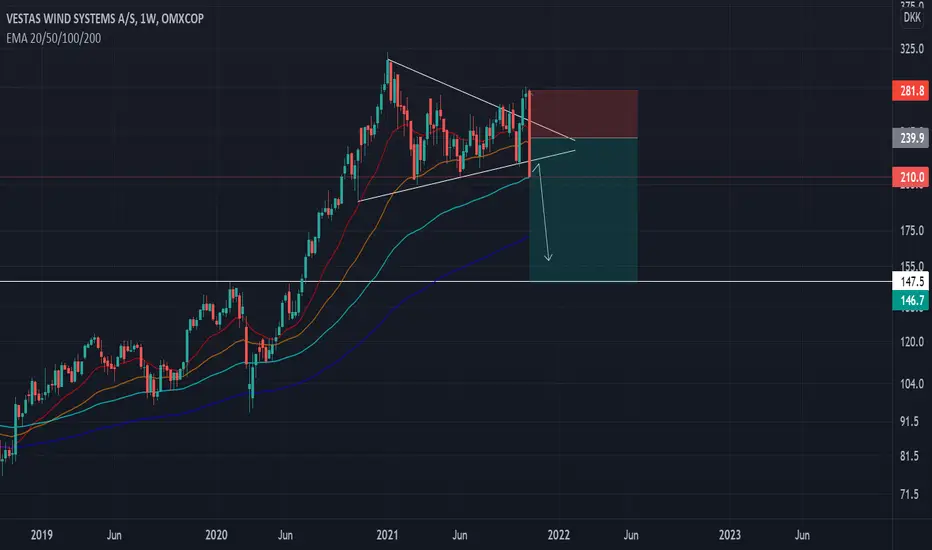
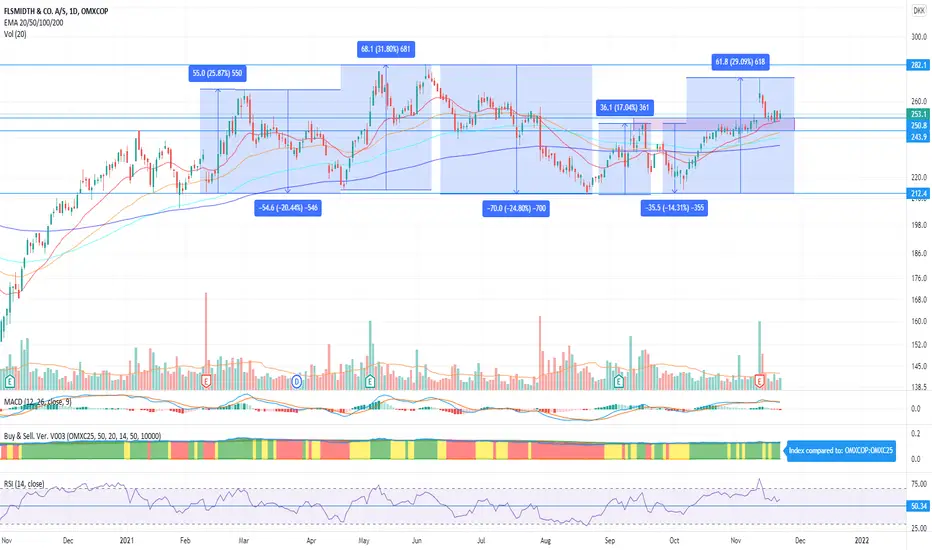
Consolidation between 212 - 282- wait for breakoutConsolidation between 212 - 282. Wait for a possible breakout above 282, to enter.
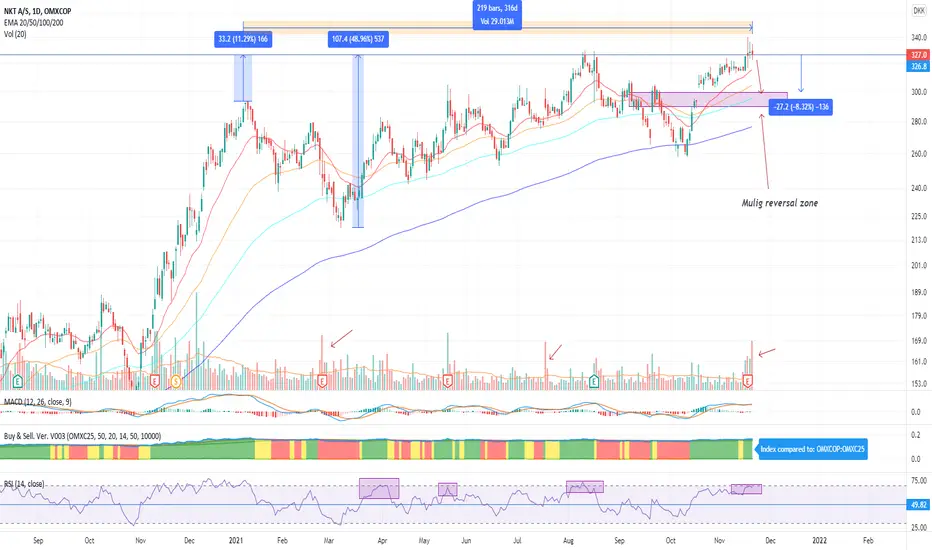
NKT - Breakout or pullbackNKT consolidated over 320 days with 11% from top end 2020 until now. Now going against a double top and possible facing a new pullback.
VWS (Vestas) to 170 then to 360VWS seems to be correcting in wave 4 to reach 170 in a zigzag (ABC)
Then an impulse up to complete wave 5 in feb 2022 it seems

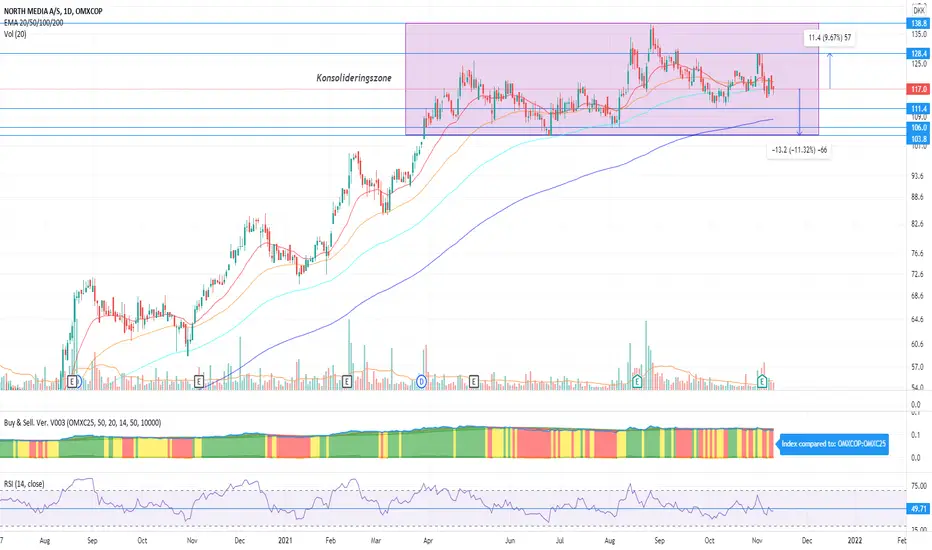
Wait for up or downswingMomentum and volume decrease.
Solid support between last two lows, and EMA200. Low risk, but be aware of the consolidation.
Not in the stock. I have never bought this stock before but i think i will maybe buy this if the 150 area holds, i dont short so im not gonna go in here but dont see it goes up from here :)