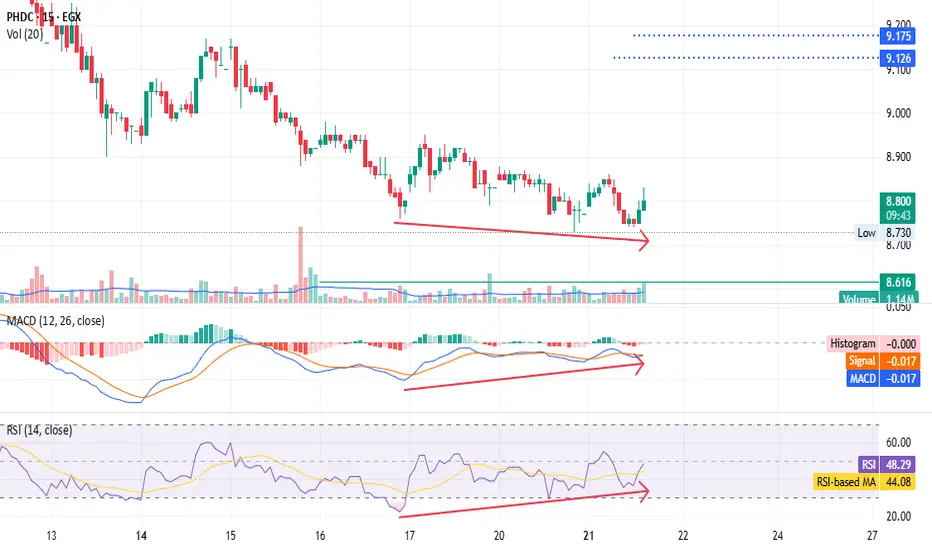
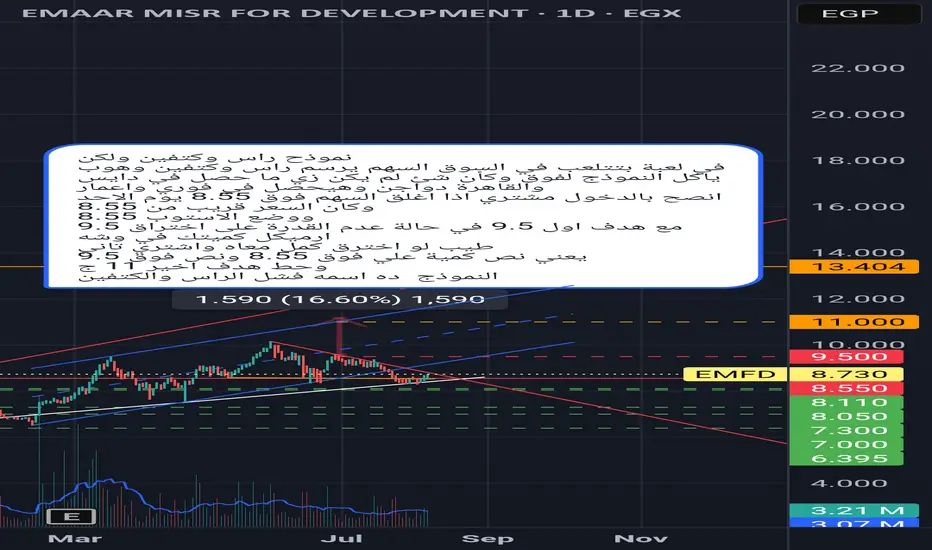
PHDC - don't give them away for free - only for shareholders EGX:PHDC - 15m timeframe
Hold your shares; don't give them away for free.
MACD and RSI show positive divergences.
Set a stop loss at 8.74.
Targets: 9.14 and 9.50.
*Not investment advice—just my chart analysis. Consult your account manager before investing. Good luck.*
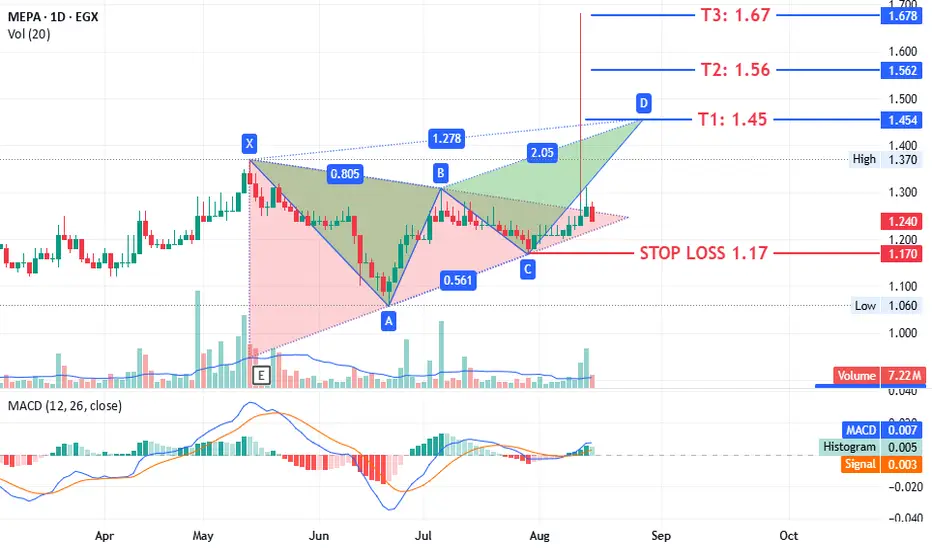
MEPA - real action - risky but may achieved new levels EGX:MEPA timeframe 1 day
formatted a triangle pattern and may going to format a bearish pattern
so what we have here is , may a chance for new trend spicily all index ( EGX30 and EGX70 ) achieved higher heigh.
anywhere we don't invest by emotions or expectations , just reflect to stock and market actions
Current entry level: 1.25 (price closed at 1.24).
Stop loss: 1.17 (last bottom, potential loss: 7%).
First target: 1.45 (hard resistance, potential profit: 15%).
Second target: 1.56 (very hard resistance, potential profit: 23%).
Third target: 1.67 (triangle target, potential profit: 33%).
Its not an advice for investing only my vision according to the data on chart
Please consult your account manager before investing
Thanks and good luck
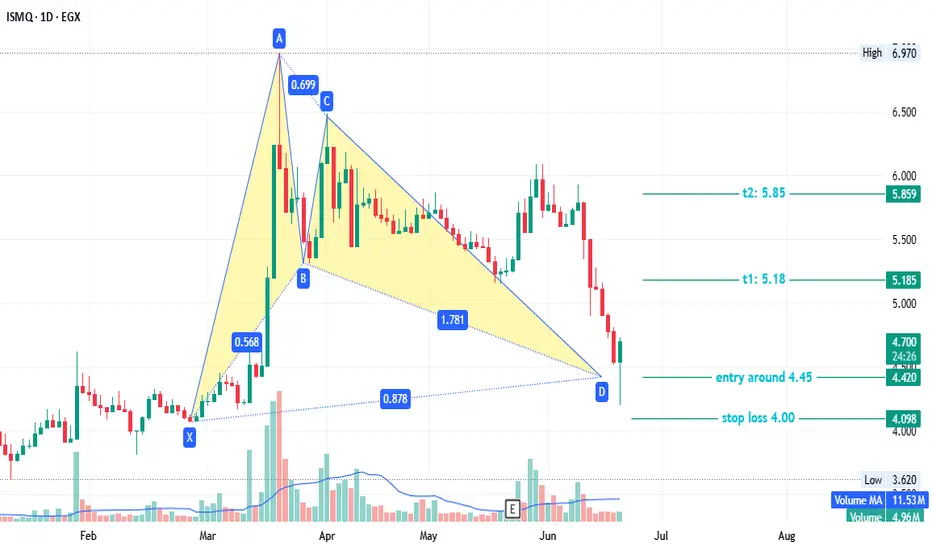
ISMQ - interested EGX:ISMQ timeframe 1 day
Created Bullish Gartley pattern, so we can see action price in this point .
Entry level around 4.45
Stop loss 4.00
First target at 5.18
Second target 5.85
NOTE : this data according to timeframe 1 day.
Its not an advice for investing only my vision according to the data on chart
Please consult your account manager before investing
Thanks and good luck
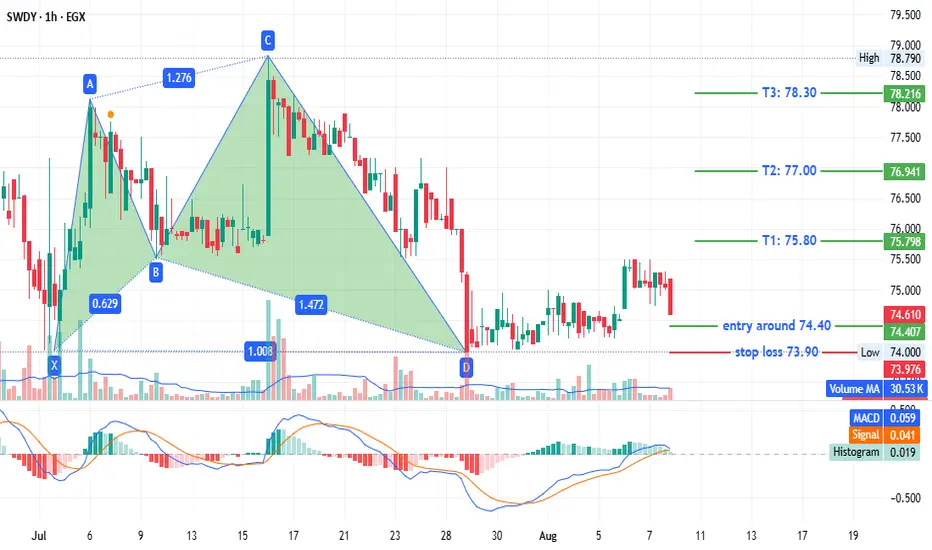
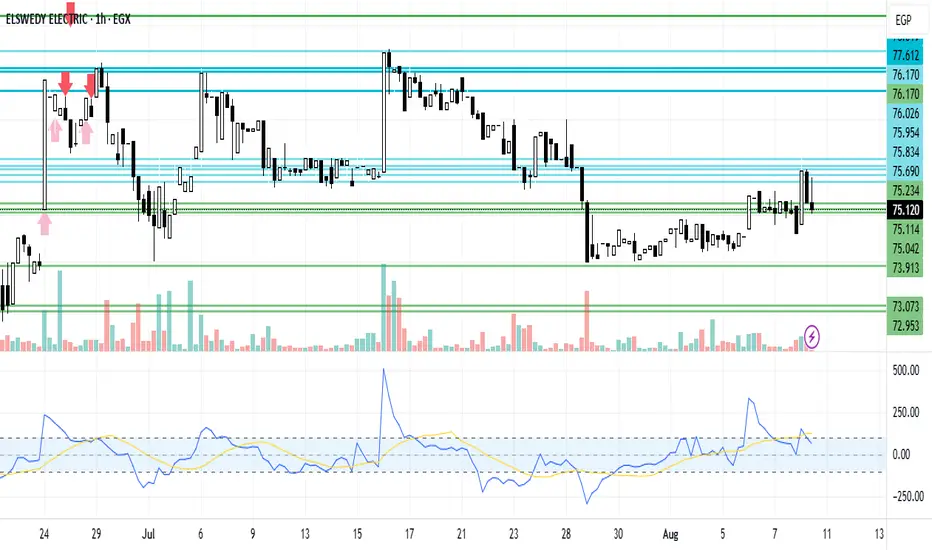
SWDY - LOW RISK EGX:SWDY timeframe 1 hour
created bullish pattern
entry 74.40
stop loss : 73.90
T1: 75.80
T2: 77.00
T3: 78.30
Its not an advice for investing only my vision according to the data on chart
Please consult your account manager before investing
Thanks and good luck
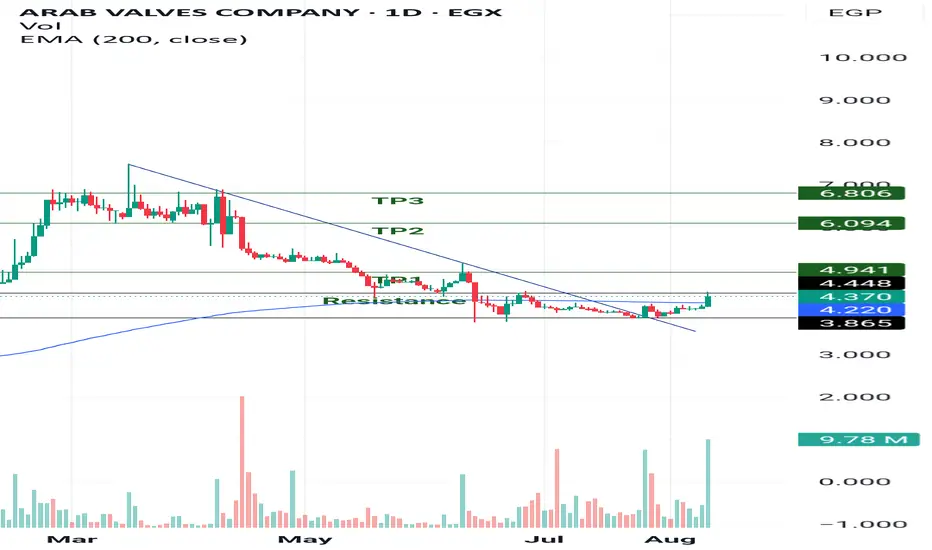
ARVA - Potential long position ARVA – Arab Valves Co.
ARVA has broken a declined resistance line and successfully closed above the EMA200 today, accompanied by a trading volume higher than the 3-month average.
On the weekly chart, ARVA has rebounded from the 61% Fibonacci retracement level.
A confirmed breakout and sustained close above the horizontal resistance at 4.45 would pave the way for the following upside targets: 4.90, 6.00, and 6.80.
Trade Setup:
- Potential Buy Range: 4.40 – 4.50
- Target 1: 4.90
- Target 2: 6.00
- Target 3: 6.80
Stop Loss: Below 4.25 (confirmation required)
Note: Trailing stop-loss levels are recommended to lock in profits.
Key Level to Watch: Holding above 4.45 is crucial for maintaining the bullish outlook.
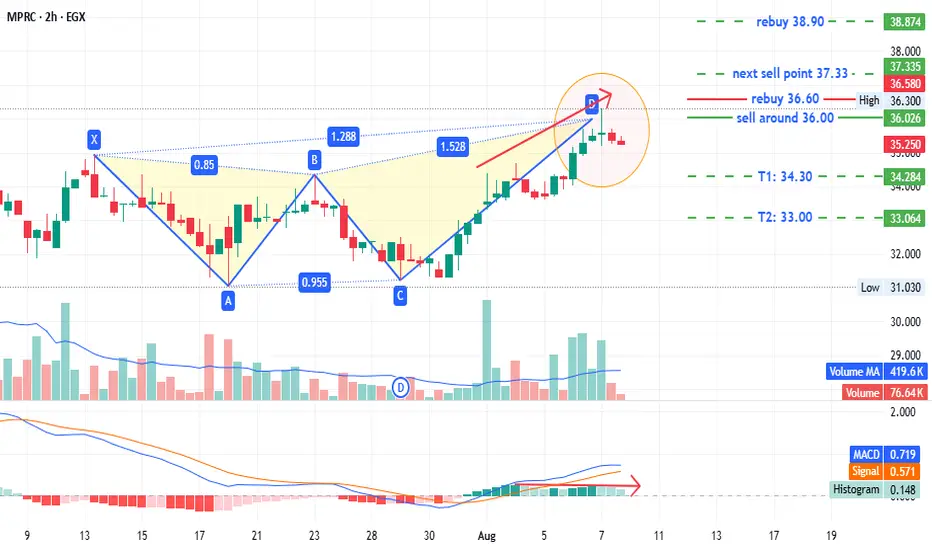
MPRC - Announce your seriousness about raising pricesEGX:MPRC timeframe: 2 hours
Identified a bearish Gartley pattern with:
- Sell point: ~36.00
- Targets: T1 at 34.30, T2 at 33.00
- Stop loss/rebuy: 36.60
If prices close above 36.60, the next resistance at 37.33 (1.618 extension of XA) could serve as another sell point. All data is on the chart.
The MACD shows a negative signal, supporting the bearish outlook. Meanwhile, EGX30/EGX70 are hitting new highs, which might push prices higher.
Given the multiple scenarios, adhere to stop losses or rebuy points to protect profits and minimize losses.
Disclaimer: Not investment advice; consult your account manager before acting. Good luck.
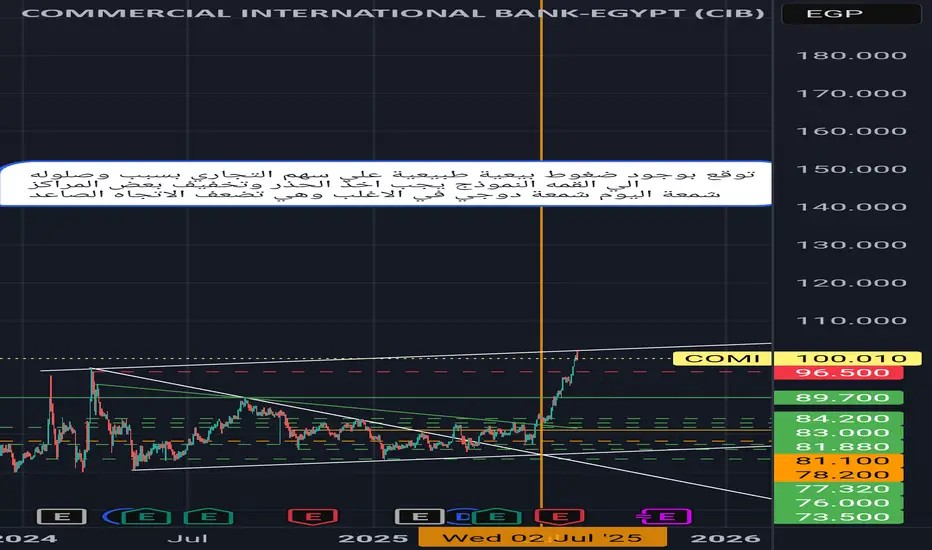
SWDY Upward Trend in a Lower RegionSWDY stock is in a lower zone than before. However, it's taking a upward trend. In case of increasing, it's expected to breach the resistance line 75.954, 76.026 to reach 76.170. In case of decreasing, it's expected to break the support line 75.234, 75.114 to reach 75.042. Positive new about SWDY as the CEO said: “In H1 2025, we achieved solid revenue growth of 20.6%, alongside a net profit margin of 7%, reflecting the strength of our diversified operations and disciplined execution”. “As previously highlighted, gross margins are gradually normalizing, in line with our expectations. Nonetheless, they remained resilient in the face of ongoing global challenges, underscoring the robustness of our business model and our ability to adapt to shifting market dynamics".
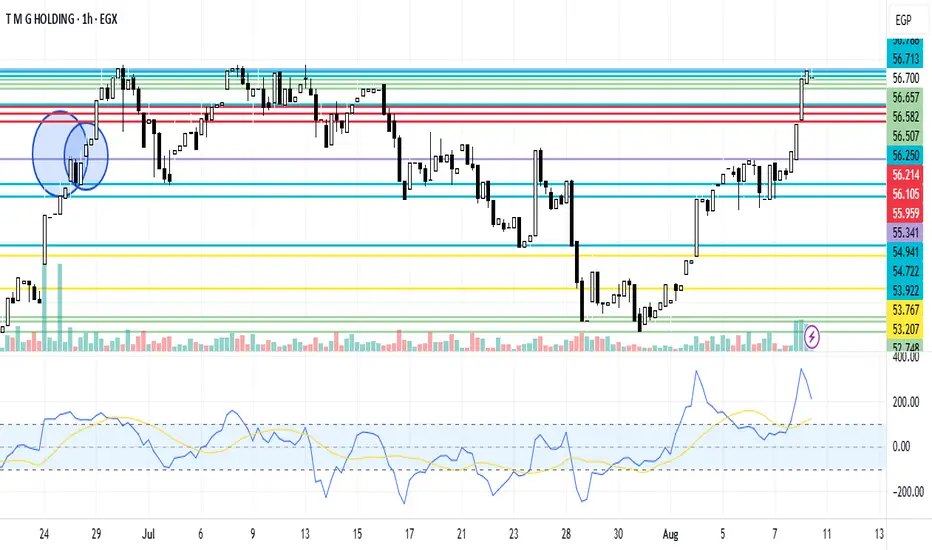
TMGH Increasing TrendTMG Holding trend is in an increasing trend. In case of increasing it's expected to breach the resistance line 56.825. In case of decreasing, it's expected to break the support line 56.657, 56.582 to reach 56.507. This is a result of positive news as Egypt's blue-chip index EGX30 jumped 1% to hit a fresh record high, led by a 1.5% gain in Talaat Moustafa Group Holding.
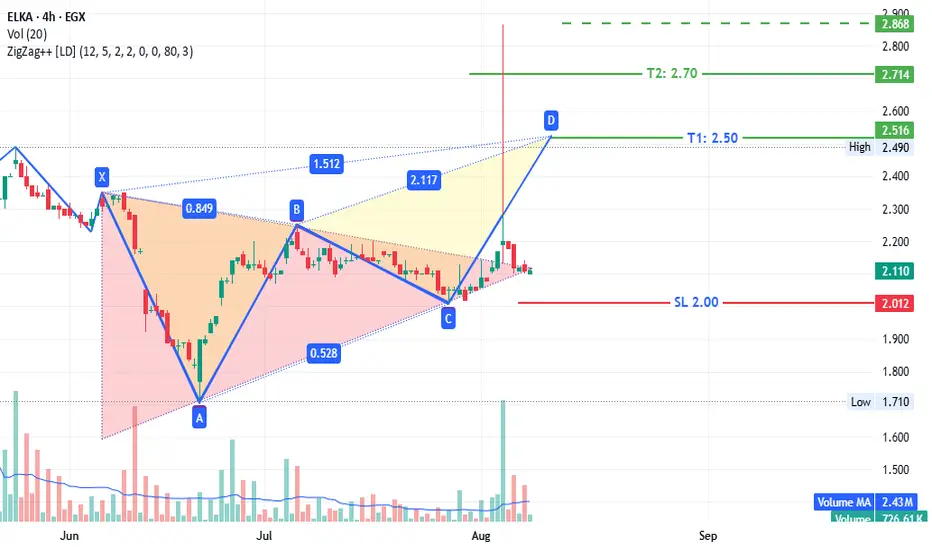
ELKA - Beware of the bull trapEGX:ELKA timeframe 4 hours
A completed triangle pattern supported by a potential bearish Gartley pattern targets :
T1: 2.50
T2: 2.70 up to 2.90 ( triangle pattern's target )
stop loss 2.00
This is not investment advice; consult your account manager before making decisions.
good luck
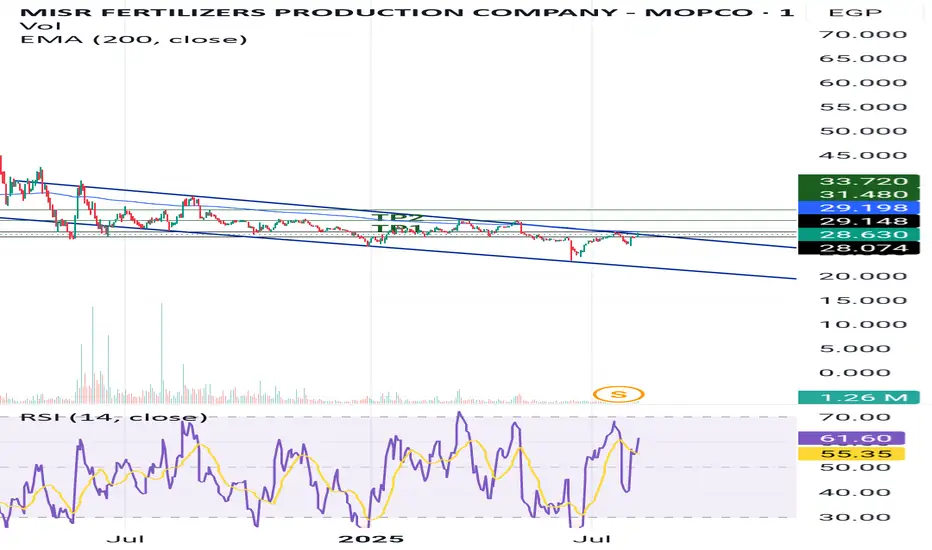
Brekthrough downtrend channel📈 MFPC Technical Outlook
Since January 2024, MFPC has been trading within a clear downtrend. However, the stock has recently broken out of this downward channel. A confirmed breakout above the horizontal resistance aligned with EMA200 "29.2" would serve as a strong bullish signal and present a potential buying opportunity.
🔹 Suggested Buy Zone: EGP 29.20 – EGP 29.50
🔹 Targets:
-TP1: EGP 31.50 (Short Term)
-TP2: EGP 33.70 (Short Term)
-TP3: EGP 35.50 (Medium Term)
-TP4: EGP 39.60 (Long Term)
🔸 Stop Loss: EGP 29.15 (to be placed after confirmation of breakout above 29.20)
A trailing stop loss is recommended to protect gains as the stock progresses.
EFIH breakthrough significant horizontal resistanceEFIH is moving in an upward channel supporting its medium - long term positive performance.
Currently EFIH breakthrough a significant horizontal resistance level at 13.37 supporting it's positive performance in the short term, potential targets and stop loss level is as follows:
- Potential buy range: 13.4 - 13.8
- TP1: 14.6 "short term"
- TP2: 17 "medium term"
- SL: below 13.3 "require confirmation"
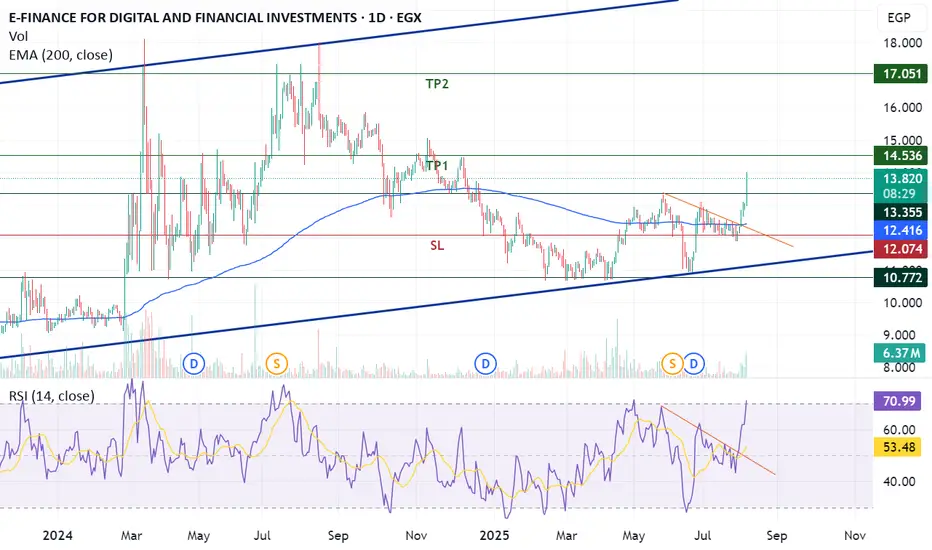
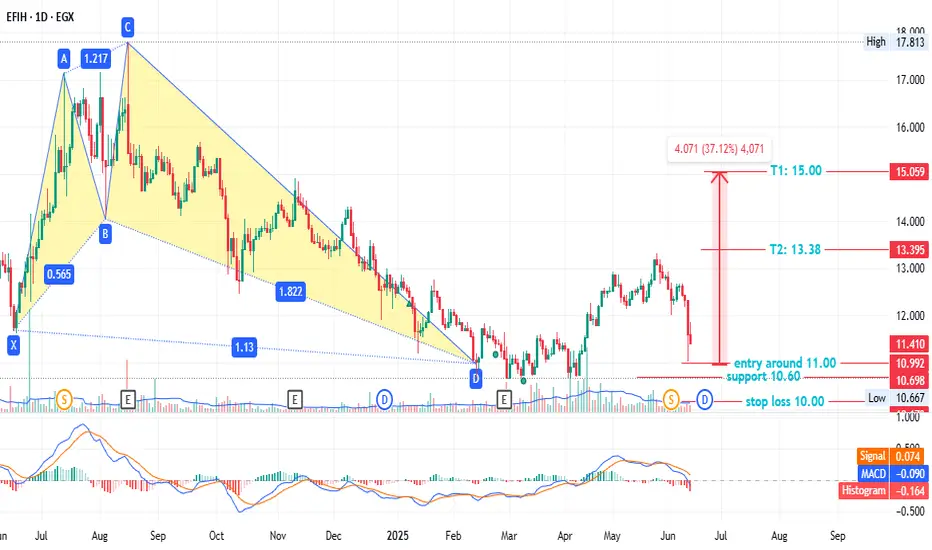
EFIH - anther chance - low risk EGX:EFIH - 1-Day Timeframe
A bullish pattern emerged on Feb 13, but prices adjusted after the 3/2 stock split on Jun 02. Key levels:
- Entry: ~11.00
- Stop loss: 10.00 (7.00% loss)
- Support: 10.60 (6-month low)
- Targets:
- T1: 13.38 (22.24% profit)
- T2: 15.00 (37.12% profit)
This is not investment advice—only my analysis based on chart data. Consult your account manager before investing. Good luck!
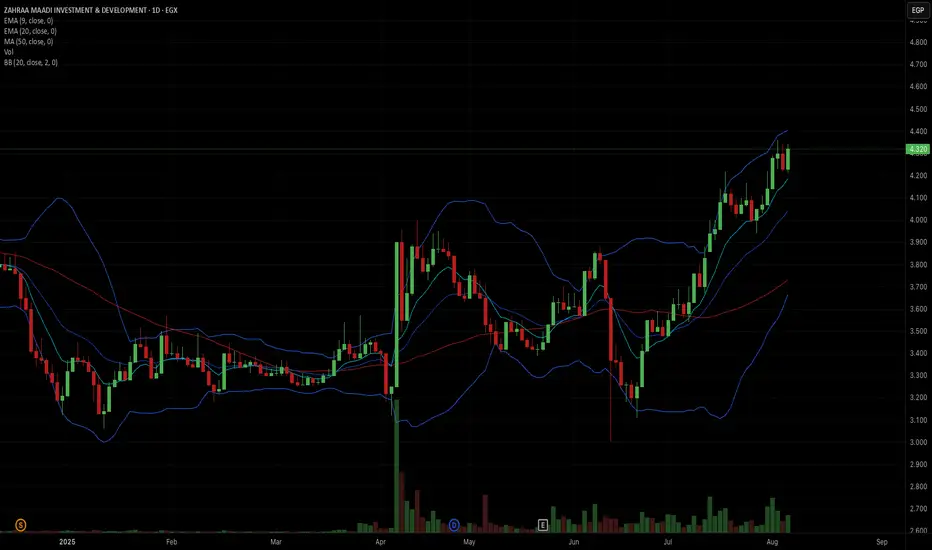
Zmid Break-&-Go Continuation Plan.Entry Trigger
4.40 EGP+
Stop-Loss
4.18 EGP — beneath 9 EMA (daily) & last micro-base
Target 1
4.60 EGP
Target 2
4.80 EGP
Target 3
5.20 EGP — weekly supply April 2022
Wait for either the 4.40 breakout confirmation or an orderly pull-back to 4.05-4.10 (low prob for now). Anything in-between → ❌
Pls ask ur questions here so that others can see it and not in the private chat.
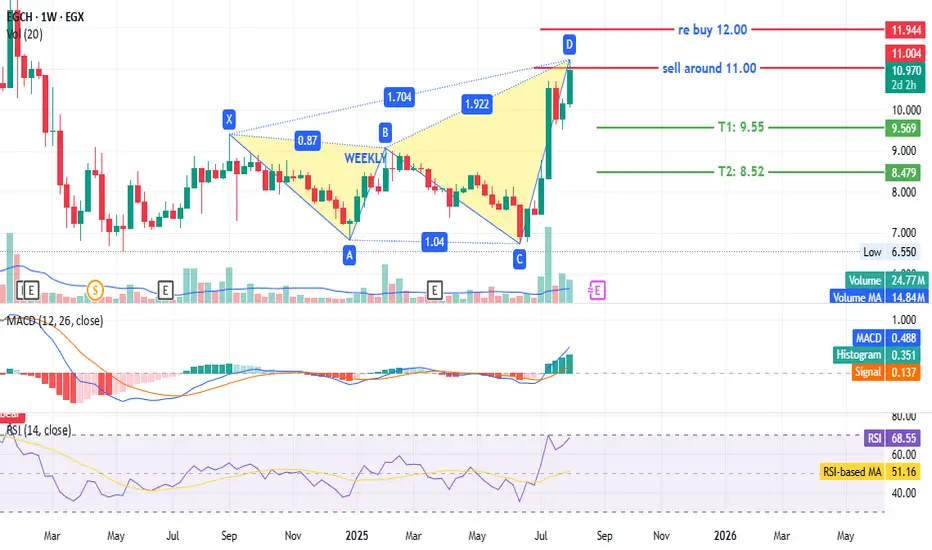
EGCH - great opportunity but be carful EGX:EGCH timeframe: 1 week
Identified a bearish Gartley pattern with:
- Sell point: 11.00
- Targets: T1 at 9.55, T2 at 8.52
- Stop loss/rebuy: 12.00
However, prices may still rise if the weekly RSI closes above 70. Currently, MACD and RSI show no negative signs, and EGX30/EGX70 are reaching new highs, suggesting potential upward movement.
Disclaimer: This is not investment advice; consult your account manager before making decisions. Good luck.
Update idea: Ad
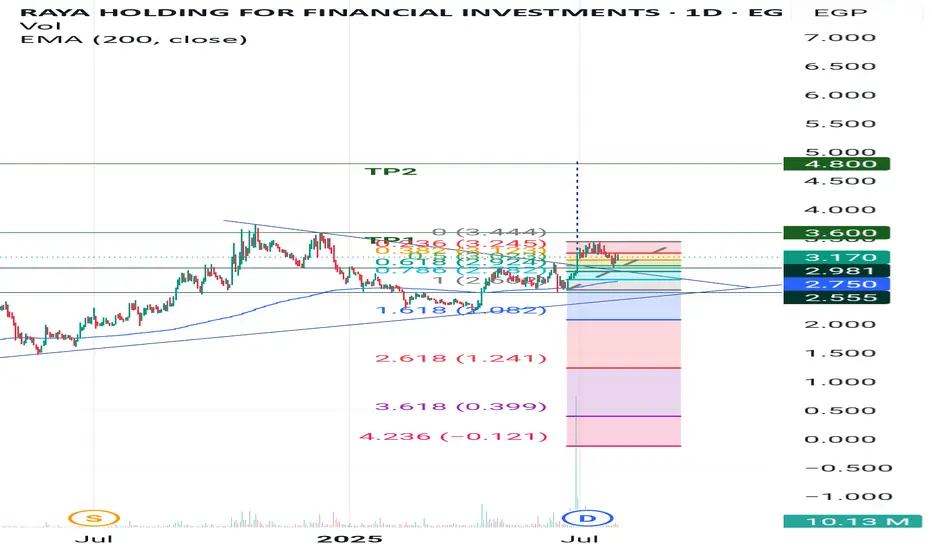
Rebound from significant support levelRAYA after breakthrough symmetric triangle pattern the stock just tested a significant support level 2.98 which considered 50% fibo retracement level, the potential targets are as follows:
- TP1: 3.6 "Short - medium term target"
- TP2: 4.8 "Long term target"
- SL: below 2.95 "current SL level"
Retracement SL is advised.
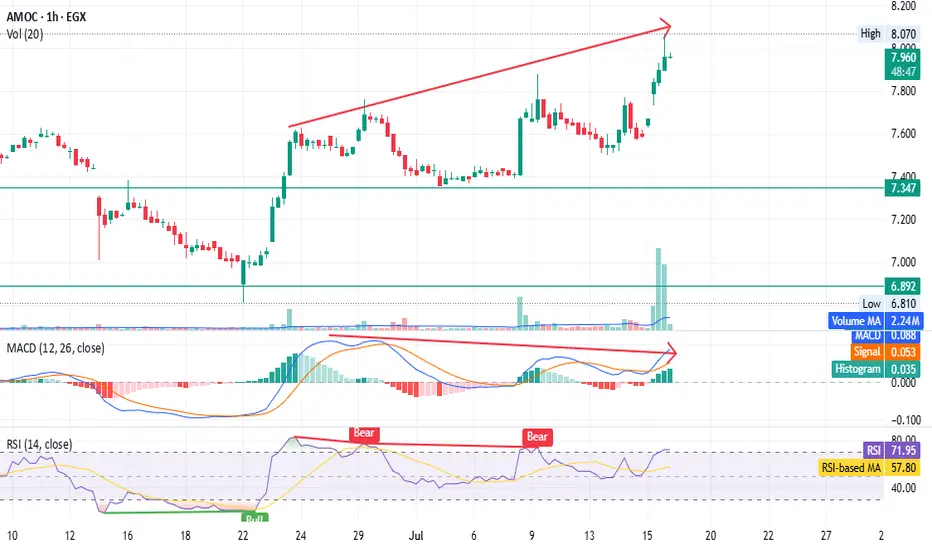
AMOC - Beware of the bear trap - only for shareholders EGX:AMOC timeframe: 1 hour
Prices continue to rise, forming a higher top than the previous one,
but MACD shows a negative divergence.
RSI indicates bearish dominance despite the price increase.
High volume with a gap, unsupported by other indicators, suggests possible distribution.
Stop loss (profit-saving) at 7.62.
This is not financial advice, just our analysis based on chart data. Consult your account manager before investing.
Thanks and good luck!
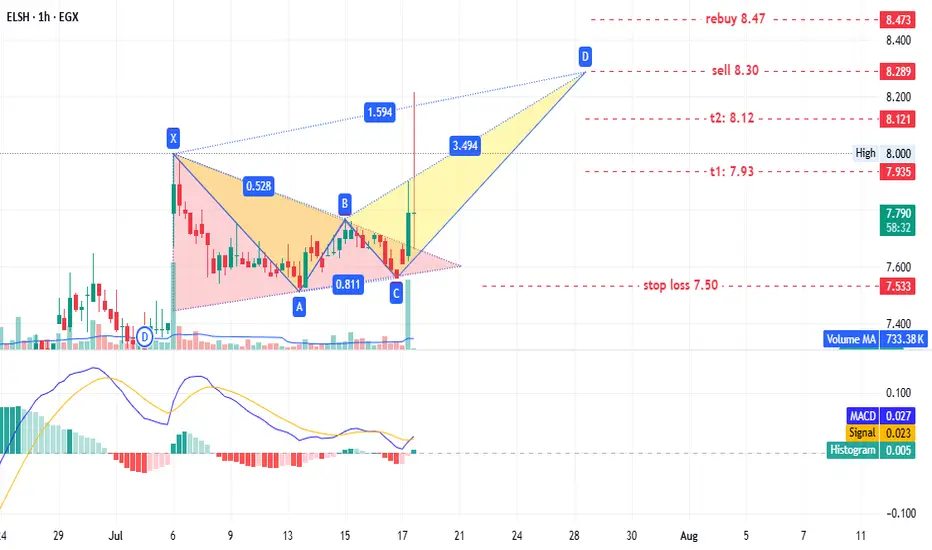
ELSH - old player EGX:ELSH timeframe: 1 hour.
A triangle pattern was identified, targeting 8.20. No new entry is recommended for shareholders, but if prices retest the triangle pattern at 7.65–7.60, it could present a low-risk entry opportunity.
This may also form a potential bearish Gartley pattern with targets:
- T1: 7.93
- T2: 8.12
- T3: 8.30 (sell point)
Stop loss: 7.50.
If prices continue rising and close above 8.47, consider rebuying what was sold at 8.30.
Disclaimer: This is not financial advice, only our analysis based on chart data. Consult your account manager before investing.
Good luck!
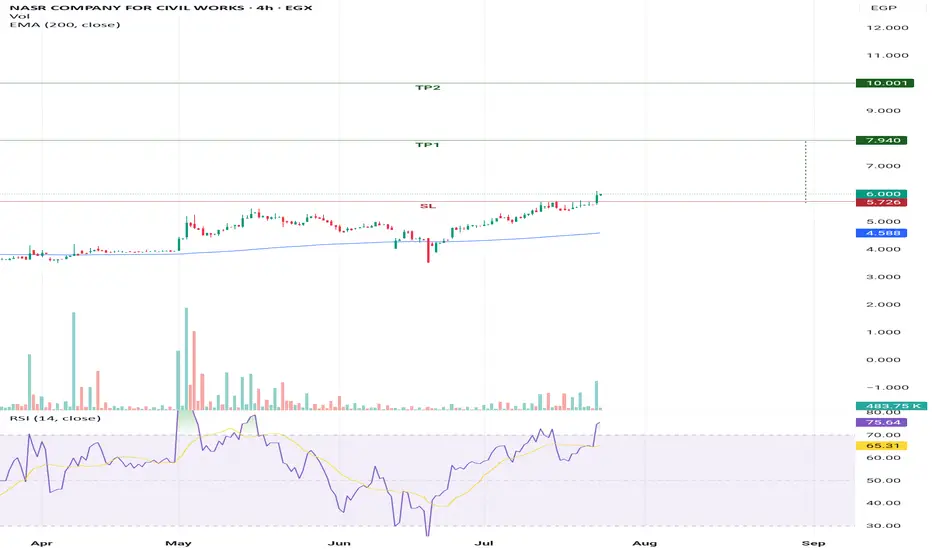
Cup and handle patternNCCW successfully breakthrough significant resistance level which also considered the resistance level of "cup and handle pattern" targeting the below targets:
- Potential buy range: 5.7 - 5.9
- TP1: 7.9
- TP2: 10
- SL: below 5.6 " require confirmation"
It is considered medium to long term target.
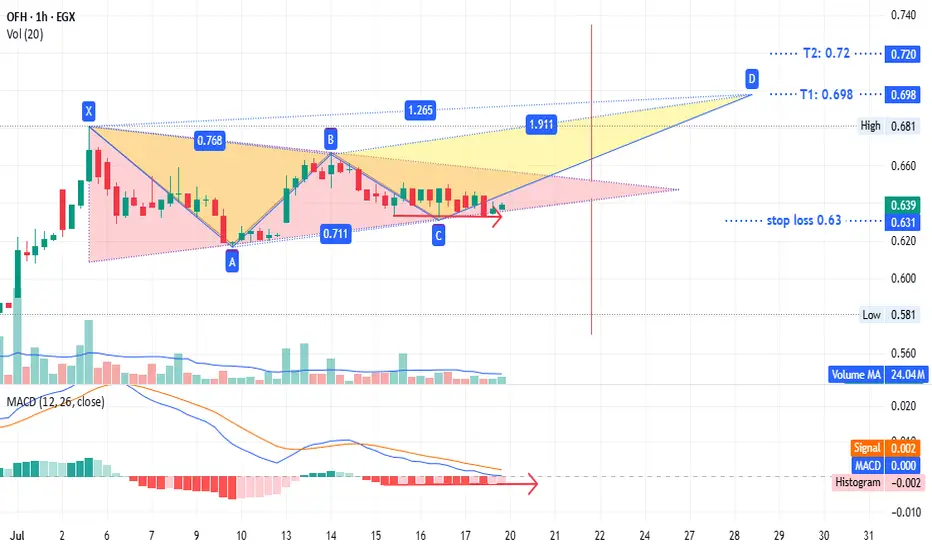
#OFH - it have a great future GETTEX:OFH timeframe is 1 hour,
showing a potential triangle pattern with targets at
0.72 if prices close above the upper line or
0.57 if they close below the lower line.
Alternatively, a bearish pattern could target 0.698 to 0.72.
The stop loss is set at 0.63 to 0.624 (the gap from July 13) based on your strategy.
A long position here offers low risk (2% loss vs. ~10% profit potential).
This is not investment advice—only my chart analysis. Consult your account manager before investing. Good luck.