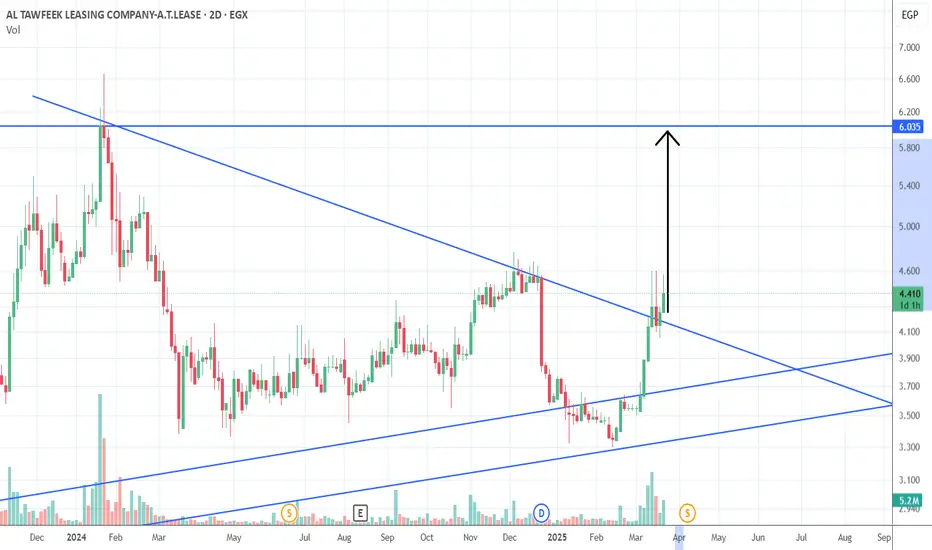
atlc buy signal ATLC break the trend and it will go up as 40% with stop loss at 4 whcich means 40% take profit and 10% stop loss
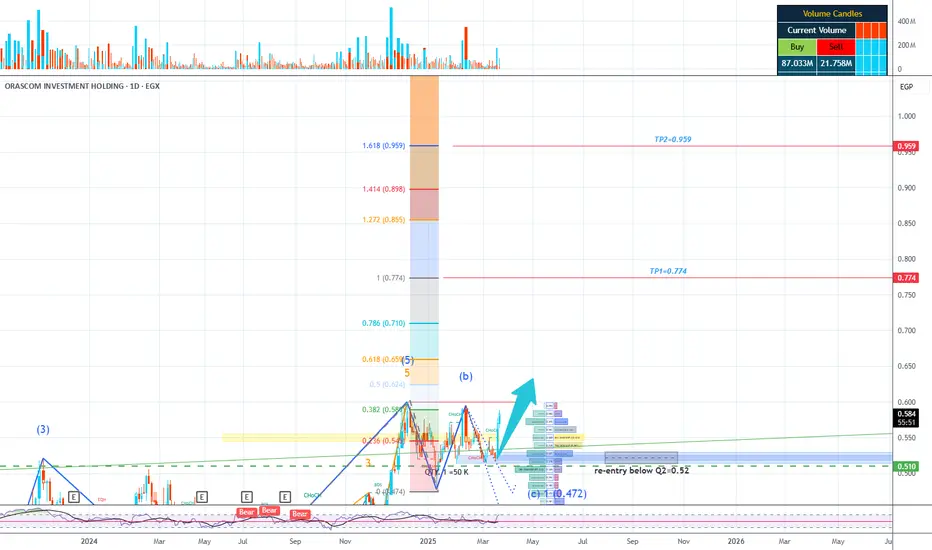
Long OIH Company Overview:
• Orascom Investment Holding (OIH) operates as an investment holding company in the telecom and technology sectors across Egypt and Africa.
• The company is also engaged in real estate investments, leveraging its experience in North Africa and Sub-Saharan markets to expand into Africa’s fast-growing economies.
• OIH invests in energy, financial services, agriculture, real estate development, logistics, and transport.
• The company is also focusing on world-class entertainment destinations, integrating entertainment, retail, and hospitality to drive regional development.
Financial Highlights (2024):
• Net Cash Position: EGP 2.27 billion (Cash: EGP 2.94 billion, Debt: EGP 664.15 million) → EGP 0.43 per share.
• Book Value Per Share (BVPS):
o 2024: EGP 0.79 (+33% YoY).
o 2023: EGP 0.59 (+12.96% YoY).
o 2022: EGP 0.52 (+67.75% YoY).
• Fair Value Per Share (based on sector book value multiple): EGP 1.72.
Stock Performance & Investment Outlook:
• 52-Week Performance: +48.05% increase.
• Current Price: EGP 0.58/share.
• 52-Week High: EGP 0.64/share (02/03/2024).
• Elliott Wave Analysis Targets:
o TP1: EGP 0.774.
o TP2: EGP 0.959.
• Investment Recommendation:
o Buy below EGP 0.52/share.
o Hold for long-term upside potential.
Next Estimated Earnings Date: Thursday, March 27, 2025.
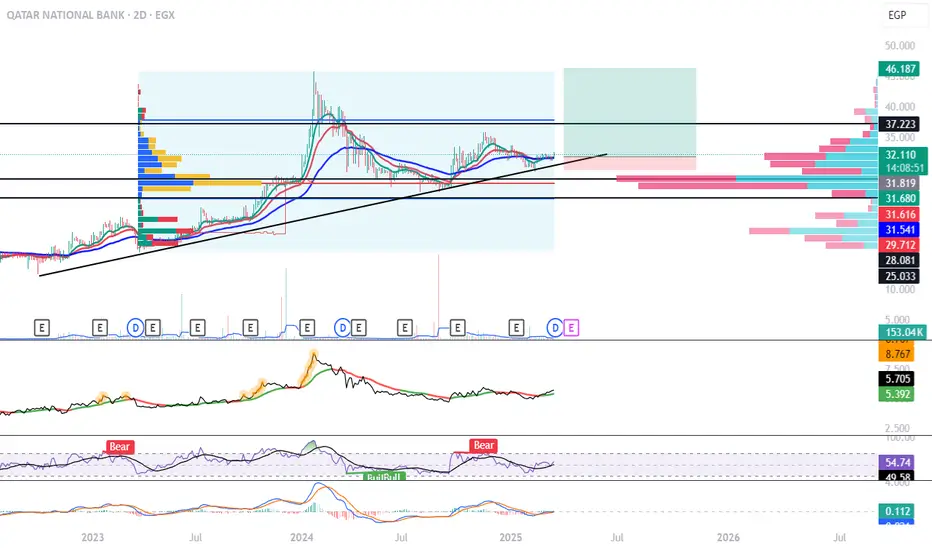
QNB Analysis with IndicatorsKey Observations:
Support & Resistance Zones:
Strong Resistance: 37.41 EGP (Previous high).
Current Resistance: 31.68 - 32.11 EGP (Needs a breakout for bullish continuation).
Support Levels: 31.54 EGP, 28.08 EGP, and 25.03 EGP.
Moving Averages (Blue & Red Lines):
Price is near moving averages, suggesting a retest of support or an early uptrend.
If the price stays above moving averages, it could confirm bullish momentum.
Indicators (MACD, RSI, Volume):
RSI: 54.74 (Neutral-Bullish). Needs to break above 60 to confirm strong bullish trend.
MACD: Slightly bullish crossover forming. Could signal momentum shift upward.
Volume Profile: High volume between 28-32 EGP, indicating accumulation.Trading Strategy Ideas:
📌 Bullish Scenario:
Buy above 32.11 EGP with a target of 47.41 EGP.
Stop loss below 29.50 EGP to minimize risk.
Confirmation: RSI above 60, MACD positive crossover, and increased volume.
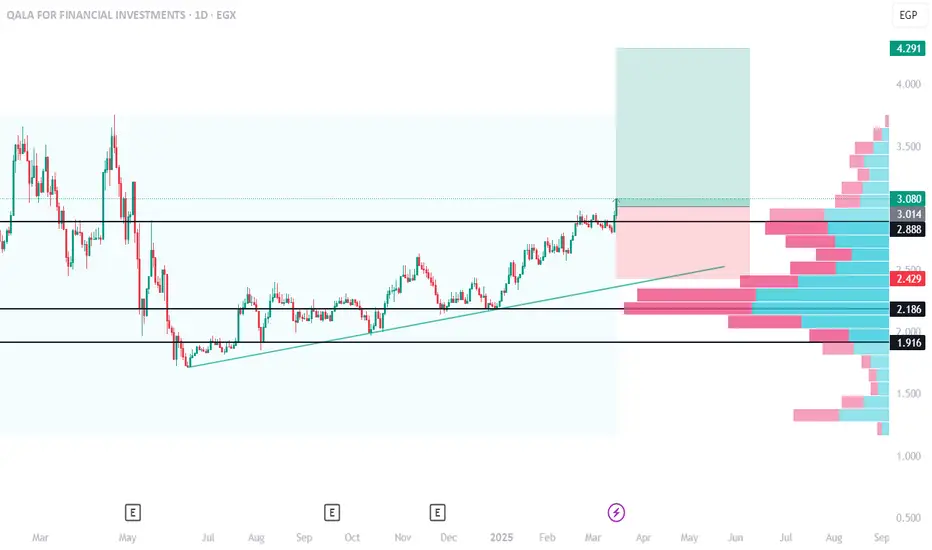
bullish trade setup for **QALA
### **Key Observations:**
1. **Breakout from Resistance**
- The stock has recently **broken above a key resistance level** around **2.88 - 3.08 EGP**, indicating bullish momentum.
- A successful retest of this zone could confirm it as a **new support level**.
2. **Volume Profile Analysis**
- The **volume profile** on the right shows a strong **buying interest** around **2.4 - 2.8 EGP**, indicating strong demand.
- **Low volume areas above 3.08 EGP** suggest that price could move quickly towards the next resistance.
3. **Target Levels**
- **First Target:** **3.81 EGP** (previous high and key resistance).
- **Second Target:** **4.29 EGP** (next major resistance level).
4. **Stop-Loss & Risk Management**
- **Stop-Loss:** Below **2.42 EGP** (previous strong support level).
- **Risk-to-Reward Ratio:** Appears to be favorable (high reward potential vs. controlled risk).
5. **Trendline & Market Structure**
- A **rising trendline** supports the price action.
- The market structure remains **bullish** with **higher highs and higher lows**.
### **Trade Plan (Bullish Setup)**
- **Entry Zone:** **3.00 - 3.08 EGP** (on a retest of support).
- **Stop-Loss:** Below **2.42 EGP** (invalidation level).
- **Take Profit Targets:**
- **First Target:** **3.81 EGP**
- **Second Target:** **4.29 EGP**
If buying volume continues, the stock has a **strong chance of rallying** toward the target levels.
IDERA Ismailia development up trend IDERA and we are waiting for a price action probably if any the stock will continue rising
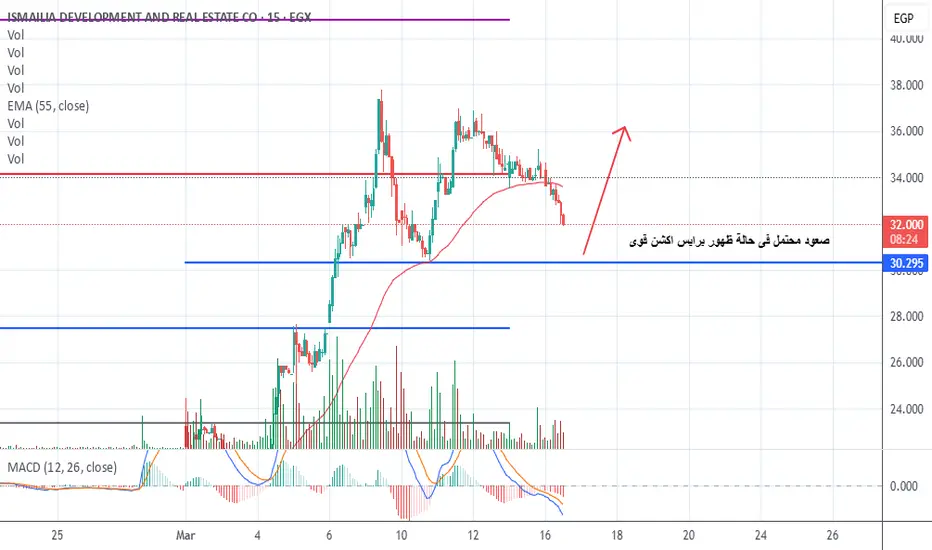
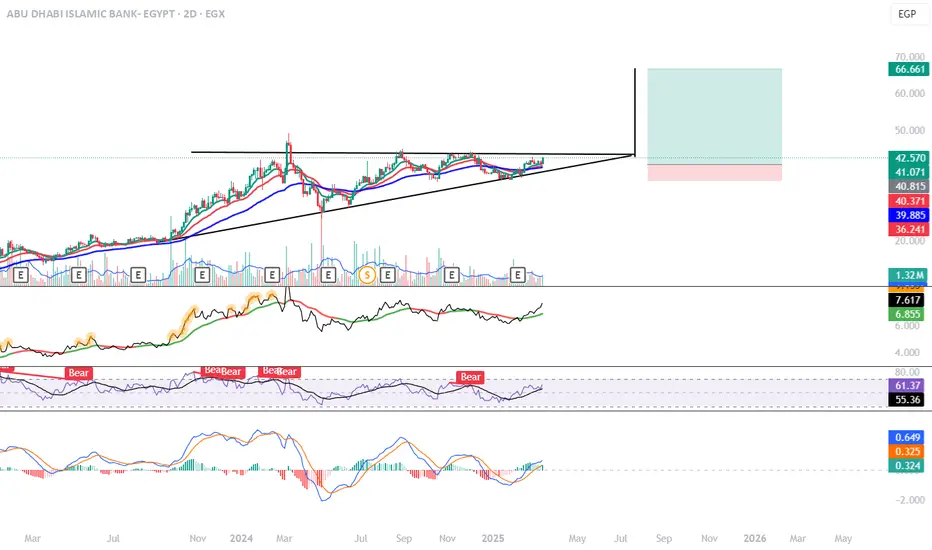
Ascending Triangle Pattern bullish continuation pattern
**Trend Analysis**
1. **Ascending Triangle Pattern:**
- The chart shows an **ascending triangle** pattern, characterized by a horizontal resistance line and an upward-sloping trendline.
- This is typically a **bullish continuation pattern**, meaning a breakout above resistance could lead to further upward movement.
2. **Support & Resistance Levels:**
- **Resistance:** Around **56.13 EGP** (historical peak).
- **Support:** The **ascending trendline** acts as dynamic support.
- **Major Supports:** **42.57, 41.07, 40.81 EGP** (previous lows and moving averages).
3. **Moving Averages:**
- The price is trading **above key moving averages (blue and red lines)**, suggesting the trend is still bullish.
- These MAs are also acting as dynamic support.
### **Indicators & Momentum**
1. **Volume & Breakout Potential:**
- The volume bars indicate **higher interest** near the breakout level.
- A **strong breakout with high volume** would confirm the pattern.
2. **RSI (Relative Strength Index):**
- Currently around **55-61**, indicating the stock is in a neutral to slightly bullish zone.
- No overbought or oversold conditions.
3. **MACD (Moving Average Convergence Divergence):**
- The MACD line is crossing above the signal line, which is a **bullish signal**.
- A strong crossover with an increase in momentum could confirm an uptrend.
### **Potential Future Movements**
1. **Bullish Scenario:**
- If the price **breaks above 56.13 EGP with strong volume**, the next target could be around **66.66 EGP**.
- This aligns with the measured move of the ascending triangle breakout.
2. **Bearish Scenario:**
- If the price fails to break resistance and falls below the trendline (**around 42-43 EGP**), it may **decline towards 39.88-36.24 EGP**.
### **Conclusion & Trade Idea**
- **Bullish bias** as long as price remains above the trendline.
- Watch for a breakout above **56.13 EGP** for confirmation.
- If price **fails and drops below 36 EGP**, expect a downside move.
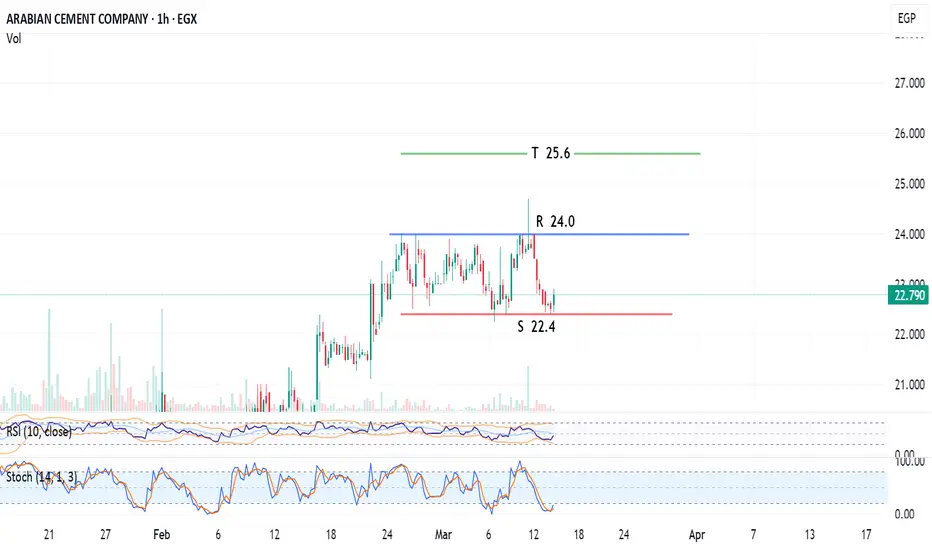
Arabian Cement has a potential to 24 then 25.61-hour chart,
the stock EGX:ARCC is trading in a channel, between support level at 22.4 and resistance level at 24.0
The technical indicators RSI, Stochastic are signalling a positive direction towards the upper line R.
Closing above 24.0 for 3 hours with high volume, the next target (TP - Take Profit) will be 25.6
(Fibonacci extension to 26.6)
Consider a stop loss below 22.2
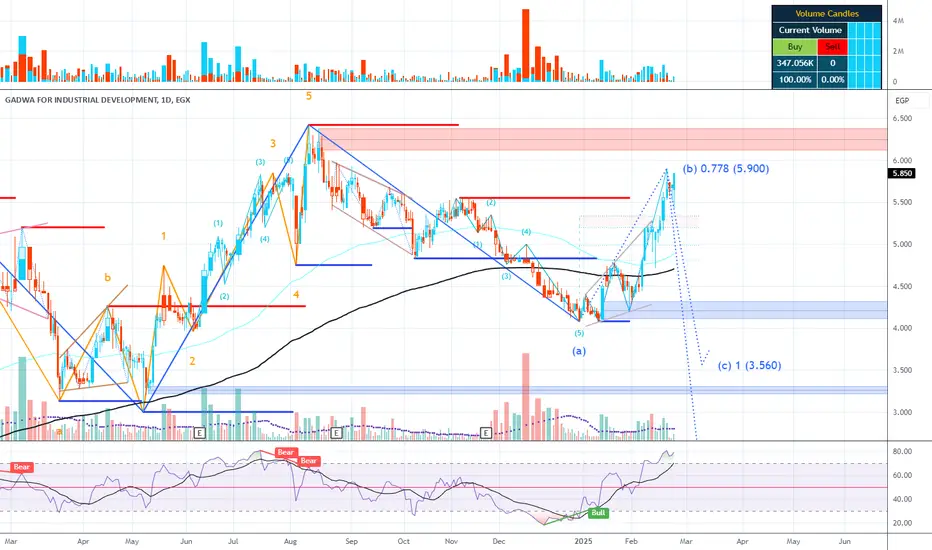
GDWA_A Deeply Underrated Asset Investment Decision Analysis for GDWA holding company has shares as following:
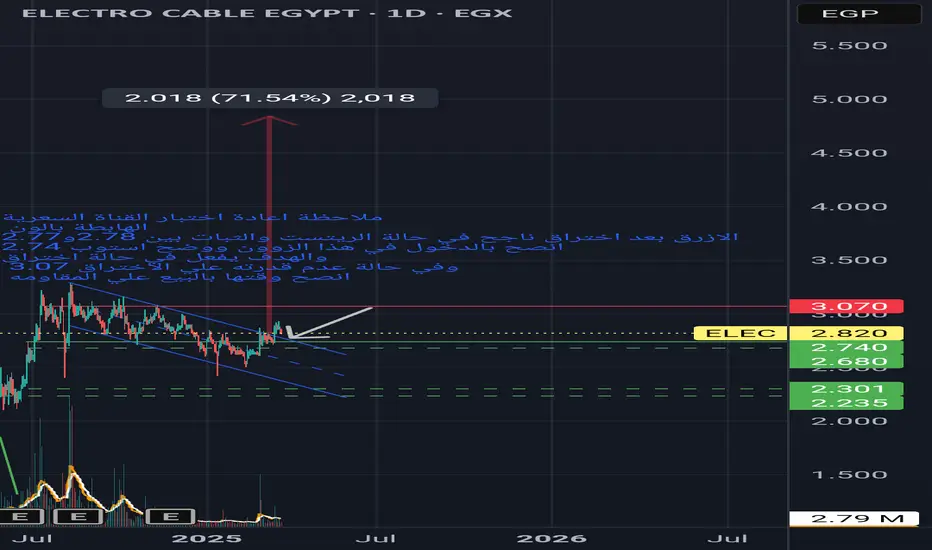
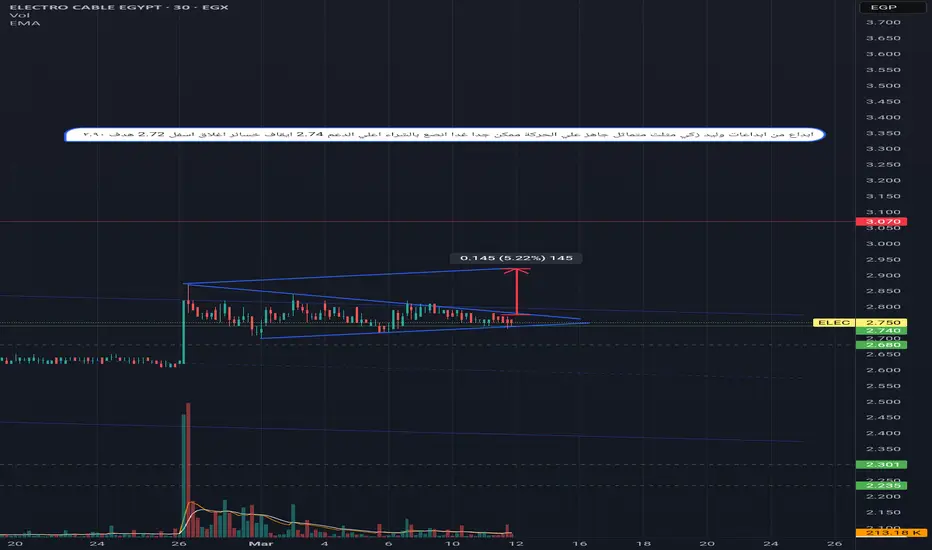
1) 72.3% of Electro Cables (ELEC) market Cap 9.15B
2) 47.9% of Arab Dairy (ADPC) Market Cap 1.58B,
3) 73.9% of Universal for Paper &Packaging Materials (UNIP) Market Cap 621.74M
4) 74.7% Egyptian Integrated for Food Industries (EIFI) Market Cap 101.74M
Minimum Market Cap Estimate: If GDWA's value is purely based on its investments, the minimum estimate is 7.91B.
value-based price of EGP 7.54/share, you would gain approximately +28.0 % profit from your investment at the current price (EGP 5.8/share).
The fair value of GDWA's share price can be determined based on the valuation data provided in the reports and financial metrics. Here’s a detailed calculation and analysis:
A) Historically, GDWA's financial performance tends to be stronger in the second half of the year due to operational seasonality and project completions.
Q4 Financial Performance
B) EBIT for Q4: EGP 1.15 billion, up by +185.81% compared to previous periods. This indicates strong operational growth.
C) Net Income for Q4: EGP 430.05 million, up by +203.65%, suggesting solid profitability improvements in the company.
Gadwa is a leading industrial development and investment company that boasts holdings in the industrial sector, particularly high growth-potential consumer-related businesses, and defensive business models.
1. Projected Price by End of 2025: EGP 10.4/share
2. Projected Price by End of 2026: Refer stockanalysis.com the company The enterprise value
is 16.37 billion. what shou be prices of share DWA would be approximately
EGP 15.59 per share.

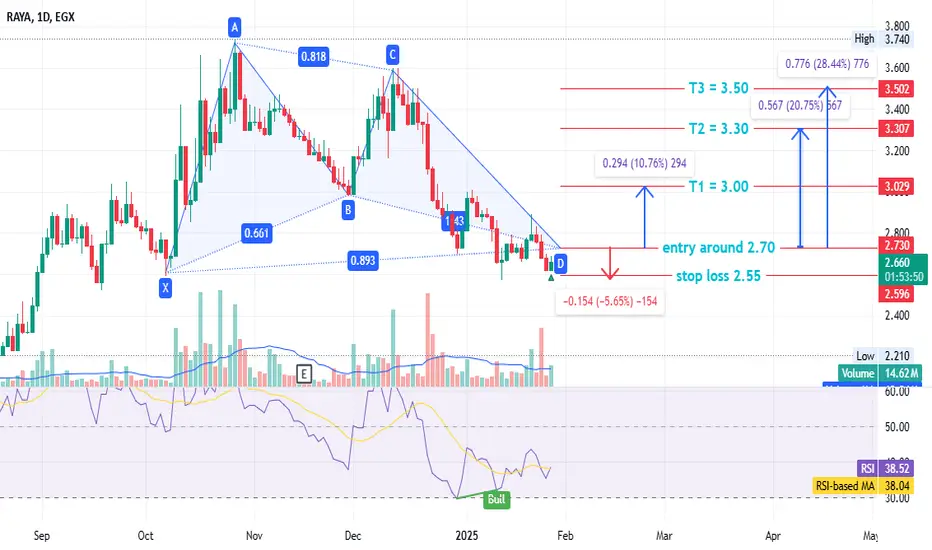
#RAYA Egyptian stock - great opportunity - great fundamental.#RAYA time frame 1 DAY
Created Gartley Bullish pattern , also there is positive diversion at RSI ( may that support our idea ) as follow :
Entry level around 2.70
Stop loss 2.55 ( estimated loss -5.50% )
First target at 3.00 ( with profit around 10% )
Second target 3.30 ( with profit around 20% )
Third target 3.50 ( with profit 28% )
NOTE : this data according to time frame I DAY , it`s may take period up to 3 months to achieve targets , you must study well the Alternative opportunities before invest in this stock .
Its not an advice for investing only my vision according to the data on chart
Please consult your account manager before investing
Thanks and good luck
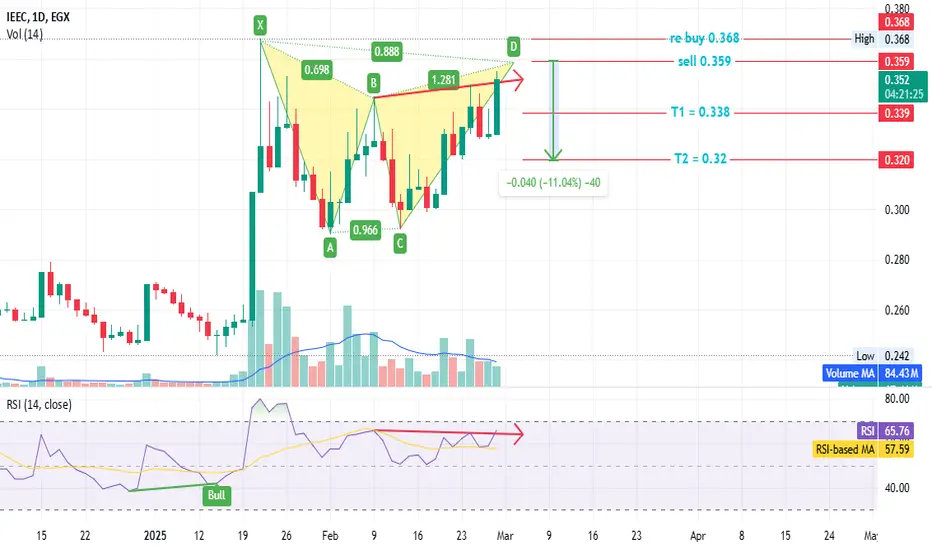
#IEEC - Egyptian stock#IEEC time frame 1 DAY
Created a bearish Gartley pattern
Sell point around 0.359
Stop loss / reentry 0.368 ( estimated loss -2.5% )
First target at 0.338 ( estimated profit 5.80% )
Second target 0.32 ( estimated profit up to 11% )
also RSI made a negative diversion that may support our idea .
NOTE : this data according to time frame 1 DAY
Its not an advice for investing only my vision according to the data on chart
Please consult your account manager before investing
Thanks and good luck
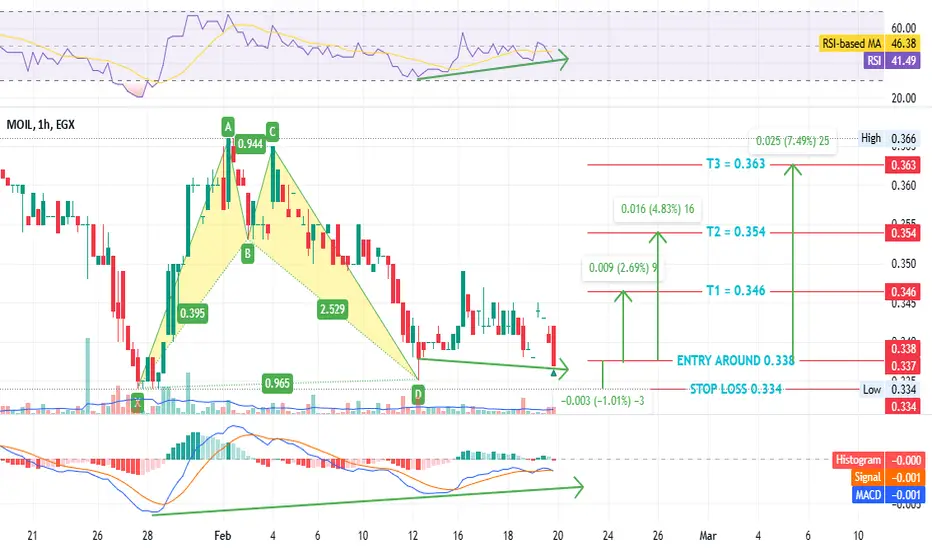
#MOIL - Egyptian stock#MOIL time frame 1 hour
created a bullish Gartley pattern
Entry level around 0.338
Stop loss 0.334 ( estimated loss -1.10% )
First target at 0.346 ( estimated profit around 2.50% )
Second target 0.354( estimated profit around 4.80% )
Third target 0.363 ( estimated profit 7% )
Note : In addition there is positive diversion at RSI and MACD , that may be support our idea .
NOTE : this data according to time frame I hour
Its not an advice for investing only my vision according to the data on chart
Please consult your account manager before investing
Thanks and good luck
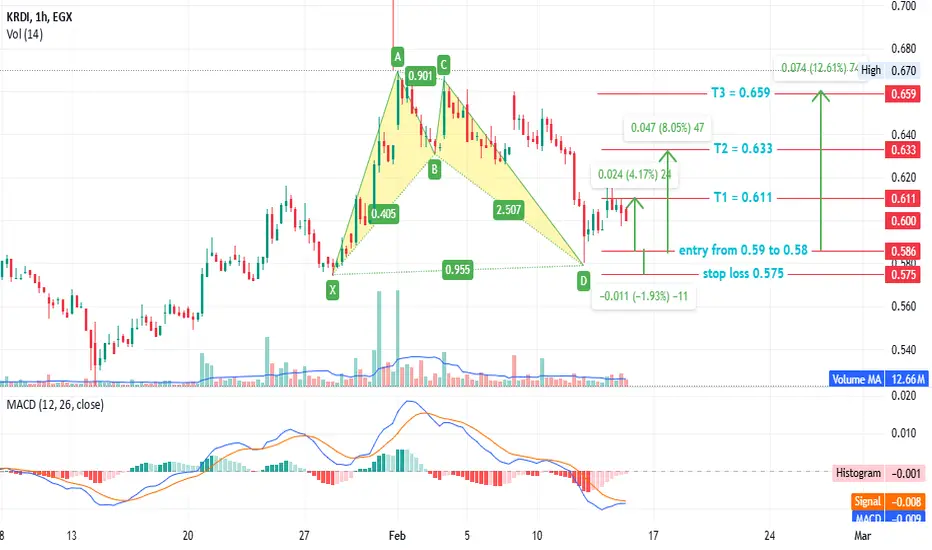
#KRDI - Egyptian stock#KRDI time frame 1 hour
created a bullish Gartley pattern
Entry level around 0.59
Stop loss 0.575 ( estimated loss -2% ) -5% from currant prices
First target at 0.611 ( estimated profit around 4% ) achieved
Second target 0.633( estimated profit around 8% )
Third target 0.659 ( estimated profit 12% )
Note : First target already achieved so it will be good chance if prices fall back into entry zone.
NOTE : this data according to time frame I hour
Its not an advice for investing only my vision according to the data on chart
Please consult your account manager before investing
Thanks and good luck
ISPH Short I think there is a valid short opportunity here.
Here is more fundamental analysis (done by ChatGPT).
///////////////////////////////////////////////////////////////////////////////
Ibnsina Pharma is a prominent pharmaceutical distribution company in Egypt, listed on the Egyptian Exchange under the ticker symbol ISPH. Established in 2001, the company distributes a wide range of pharmaceutical and cosmetic products to both private and public-sector clients, including pharmacies, hospitals, and healthcare institutions.
INVESTING.COM
Financial Overview:
Revenue: In 2023, Ibnsina Pharma reported revenues of approximately EGP 33.95 billion.
BARRONS.COM
Net Income: The net income for the same period was EGP 173.14 million, resulting in a net profit margin of 0.51%.
BARRONS.COM
Total Assets and Liabilities: The company's total assets stood at EGP 18.55 billion, with total liabilities amounting to EGP 17.1 billion, indicating a debt-to-assets ratio of 92.19%.
BARRONS.COM
Shareholder Structure:
Ibnsina Pharma's ownership is diversified among prominent entities:
Free Float: 40.7%
Abdel Gawad Family: 15.0%
Faisal Islamic Bank: 14.0%
Mahgoub Family: 12.9%
European Bank for Reconstruction and Development (EBRD): 9.6%
Blom Investment: 7.8%
This diverse shareholder base has enhanced the company's corporate governance practices.
IR.IBNSINA-PHARMA.COM
Stock Performance:
As of January 29, 2025, the stock closed at EGP 7.02 per share, with a 52-week range between EGP 2.14 and EGP 7.59.
IR.IBNSINA-PHARMA.COM
Considerations for Investors:
While Ibnsina Pharma has demonstrated significant revenue generation, its net profit margin is relatively low, and the company operates with a high debt-to-assets ratio. Potential investors should weigh these factors carefully and consider consulting with a financial advisor to determine if this investment aligns with their risk tolerance and financial objectives.
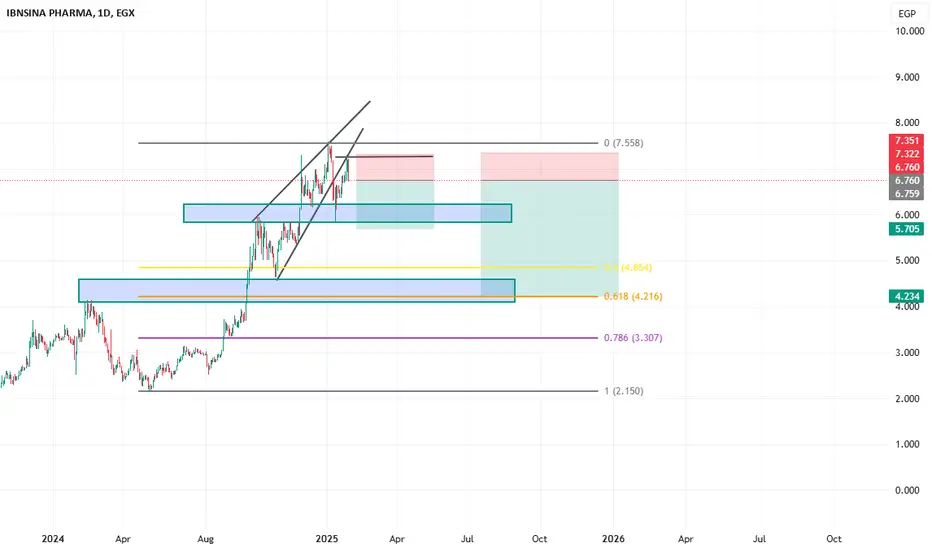
- **Entry Plan:** Expecting a **reversal from the trendlineBased on your chart analysis:
- **Entry Plan:** Expecting a **reversal from the trendline** and **60% Fibonacci level**, you plan to **start Dollar-Cost Averaging (DCA)** at current levels.
- **Stop Loss:** Placed at **13 EGP** to limit downside risk.
- **Take Profit:** Targeting **27 EGP** for a solid risk-reward ratio.
### **Additional Observations:**
1. **Trendline Support:** The price is near a long-term **ascending trendline**, which has acted as support before.
2. **Indicators:**
- The **moving average** (black line) shows a consolidation phase.
- **Momentum indicators** at the bottom suggest a potential reversal.
3. **Risk Management:**
- DCA is a good strategy if the price dips further before bouncing.
- The **stop loss at 13 EGP** is placed wisely below support to avoid unnecessary risk.
- The **profit target at 27 EGP** aligns with a previous resistance level.
Would you like a more detailed breakdown or adjustments to your trading plan? 🚀📈
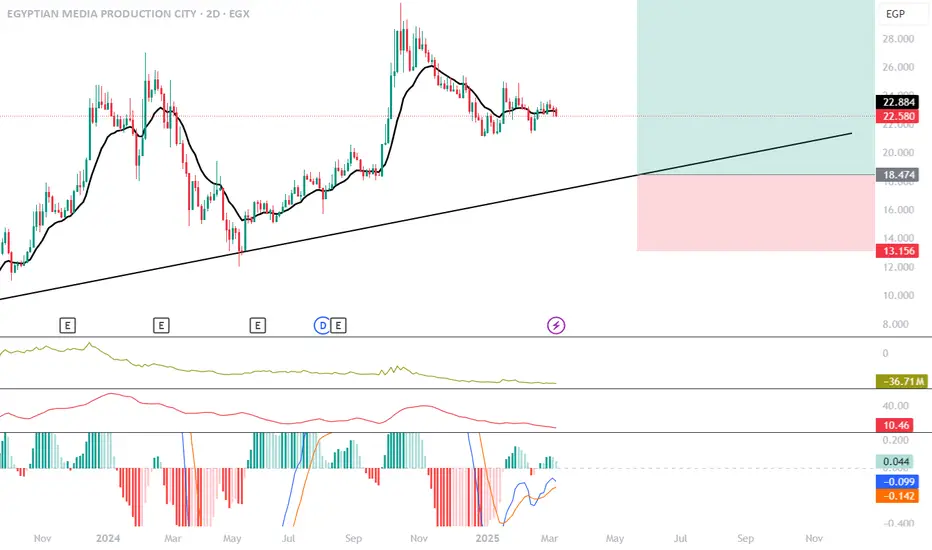
Raya Holding (EGX) – Trendline Support with Upside PotentialHere’s a TradingView idea for your trendline approach setup with targets set to the previous top:
---
**Raya Holding (EGX) – Trendline Support with Upside Potential**
📉 **Technical Analysis:**
The stock is approaching a strong ascending trendline, acting as a dynamic support level. A potential bounce from this level could trigger a move towards previous resistance zones. The MACD is showing signs of bullish divergence, suggesting a possible reversal.
📌 **Trade Plan:**
- **Entry:** Near the trendline support with confirmation of a bounce.
- **Stop Loss:** Below the trendline and recent lows to manage risk.
- **Target Levels:**
1️⃣ **First Target:** 2.478 – A key resistance level and volume cluster.
2️⃣ **Second Target:** 3.243 – A previous strong resistance zone.
3️⃣ **Final Target:** 3.752 – The previous high, where selling pressure might emerge.
📊 **Indicators & Confirmation:**
- MACD forming bullish divergence, signaling momentum shift.
- Price approaching a strong support level with high probability of a bounce.
- Volume profile suggests strong interest at higher levels.
🚀 **Final Thought:**
A well-structured trade with a favorable risk/reward ratio. A bounce from the trendline could lead to a strong upside move, aiming for previous highs. Monitor price action and volume for confirmation!
#Trading #StockMarket #TechnicalAnalysis #EGX
---
Not Financial Advice! 🚀

Golden Area Here’s an idea you can publish on TradingView based on the provided chart:
---
🚀 **Potential Trend Reversal & Fibonacci Golden Ratio Retest!** 🚀
We're approaching a key turning point in the market! 📉➡️📈
🔹 **Descending Wedge Breakout Incoming?**
The price has been consolidating within a descending wedge pattern, typically a strong bullish reversal signal. A breakout from this structure could indicate the beginning of a new impulsive move.
🔹 **Golden Ratio Confluence (0.618 - 0.705 Fibonacci Levels)**
The price is heading toward the **golden ratio zone (0.618 - 0.705 Fib retracement)**, a historically significant level for reversals. Buyers might step in, leading to a strong bullish push.
🔹 **Elliott Wave Structure in Play**
We're potentially forming the **(1)-(2)-(3)-(4)-(5) wave count**, with wave (2) likely completing near the golden ratio before the next impulsive leg (3) to the upside.
🔹 **Potential Targets 🎯**
If we confirm the breakout, our **first major resistance** lies around the **0.5 Fibonacci level (~36.96)**, followed by the **0.382 Fib (~43.06)**. Beyond that, wave (5) could aim even higher!
🔹 **Bullish Divergence on the MACD & RSI**
Momentum indicators are showing signs of reversal, further supporting the potential bullish scenario.
🚨 **What to Watch For:**
✔️ A clear breakout above resistance for confirmation
✔️ Volume increase to support the move
✔️ Retest of broken trendline as support
🔄 If the golden ratio doesn’t hold, deeper retracements to 0.79 Fib (~22.08) remain possible, but for now, bulls seem to be preparing for action!
What do you think? 🚀 Are we ready for the next leg up? Let me know in the comments! 👇
#Crypto #Trading #ElliottWave #Fibonacci #TrendReversal #PriceAction #TechnicalAnalysis
---
Let me know if you'd like any adjustments! 🚀📊its not financial advice

#ASCM - Egyptian stock / 1 hour#ASCM time frame 1 hour
Created 2 Bullish pattern ( Gartley and AB=CD ) ,
Entry level around 32.10
Stop loss 31.50 ( estimated loss -2% )
First target at 34.10 ( estimated profit around 6% )
Second target 35.50( estimated profit around 10% )
Third target 36.30 ( estimated profit 13% )
Its not an advice for investing only my vision according to the data on chart
Please consult your account manager before investing
Thanks and good luck

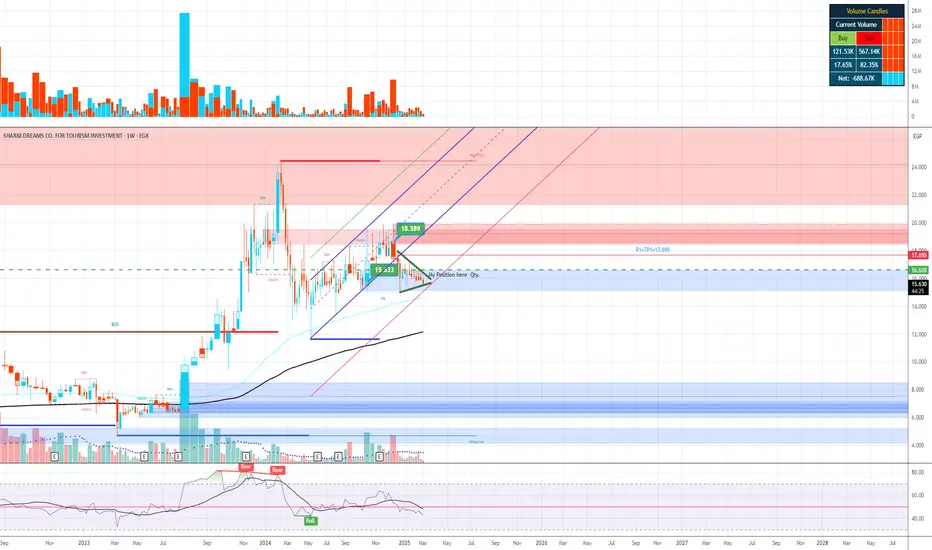
SDTI Target price is projected at 46.566 EGP/share withing 24 MSharm Dreams Co. for Touristic Investment S.A.E (SDTI) was founded in 1996 and specializes in the development of tourism, entertainment, and mixed-use real estate projects. The company’s property portfolio includes hotels, boutique hotels, resorts, vacation clubs, water parks, downtown areas, a spa island, real estate units, villas, and townhouses.
In the quarter ending September 30, 2024, SDTI reported revenue of 75.37 million EGP, reflecting 66.25% growth. Over the past twelve months, the company’s total revenue reached 197.36 million EGP, marking a 54.04% year-over-year increase. In 2023, SDTI achieved annual revenue of 116.58 million EGP, with a growth rate of 80.78%.
EBIT Performance (Last 5 Years):
2019: -13.07 million EGP
2020: -25.71 million EGP
2021: -12.3 million EGP
2022: 13.28 million EGP
2023: 54.41 million EGP
2024: 120.94 million EGP
The fair value, as estimated by Ostoul Capital, is 16.51 EGP/share in Feb.2024
SDTI (EGX:SDTI) has a market capitalization (net worth) of 829.22 million EGP, while its enterprise value stands at 2.48 billion EGP.
The target price is projected at 46.566 EGP/share.
Return on investment (ROI): 195.7% within 2 years
This means your investment would nearly triple in value if the target price of 46.566 EGP/share is reached. 🚀
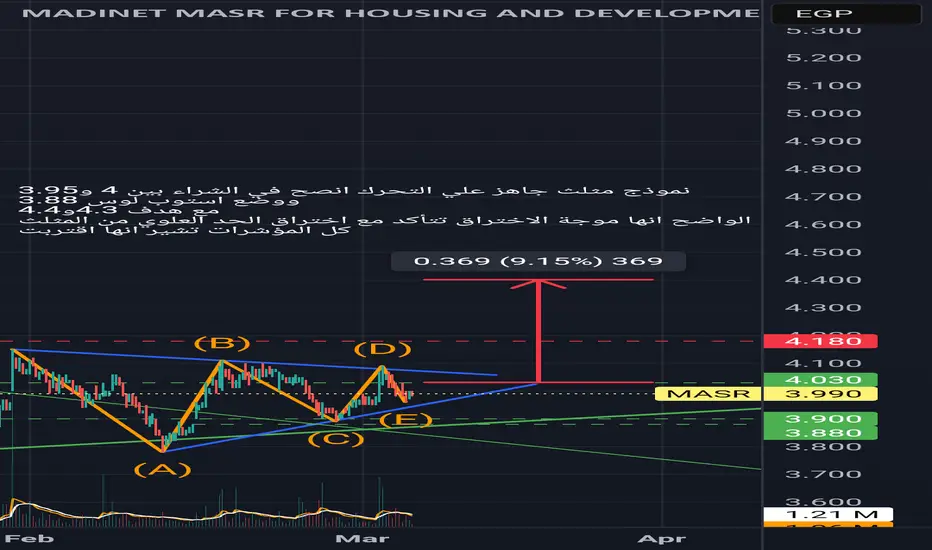
Madient masr *masr*Tic tac
Support 3.9
Stop loss 3.88
Buy between 4 to 3.95
T+1 4.3
T+2. 4.4
Don't forget following and support
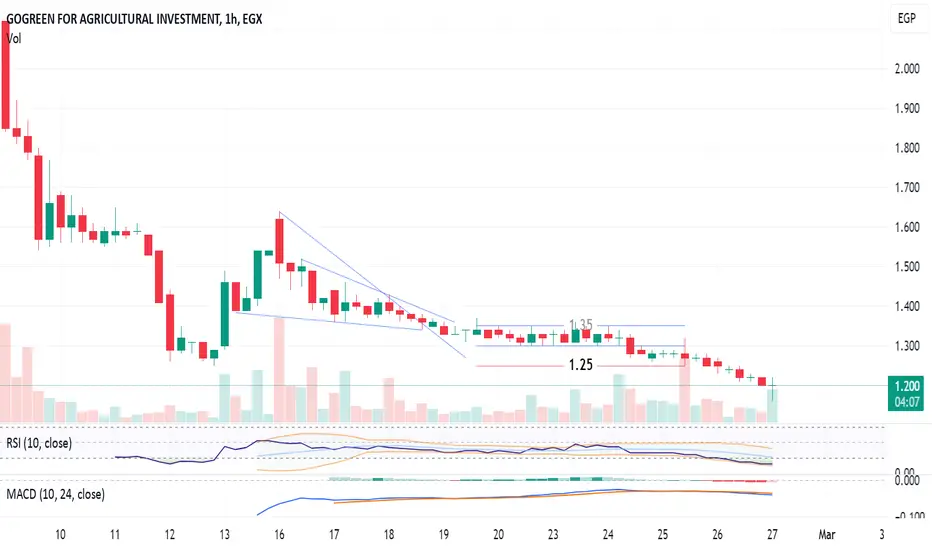
Go Green Egypt: To be Monitored for Rebound!1-hour chart
The stock EGX:GGRN was recently rolled out in the EGX stock market, and fell sharply since then.
It should be monitored for the rebound confirmation signals; to grab the new bullish wave.
Above 1.25 will be a good entry.
However, for higher profit/risk, buy in parts down to 1.15,
then the first sell target will be 1.35
Closing above 1.35 for 3 bars with high volume, the next target will be 1.60
Consider a near profit protection / stop loss level, as this stock is volatile.
long Stock Performance & Valuation
Current Price: 5.9 EGP/share (🔼 +10.8% gain so far)
Fair Value: 7.1 EGP/share (🔼 20.3% undervalued)
P/E Ratio: 4.1X (very low, strong value play)
Market Cap: 5.48B EGP
Price Target: 8.1~9.5 EGP (+37% upside potential)
Holding Period: 12 months
Financial Performance (1H 2024)
📈 Revenue Growth: +80% YoY → Strong top-line expansion
📈 Gross Profit Growth: +110% YoY → Higher profitability efficiency
📈 Operating Profit Growth: +123% YoY → Improved operational execution
📈 Net Profit Growth: +115% YoY → Bottom-line strength
📈 Net Profit Margin: 13% (up from 11%) → Profitability improving
📌 EPS Growth: 0.81 EGP vs 0.38 EGP (YoY) → +113% growth in earnings per share
💡 Sector Strength:
Cable product revenue: +79% YoY (65% of total revenue)
Dairy product revenue: +60% YoY (16% of total revenue)
Real estate & contracting revenue: +166% YoY (8% of total revenue)
Investment Outlook & Strategy
✅ Bullish Signals:
✔ P/E ratio of 4.1X → Stock is undervalued relative to earnings
✔ Strong revenue & profit growth → +115% net profit YoY is a major positive
✔ Fair value (7.1 EGP) & TP1=price target (8.1 EGP) → Stock has a potential 37% upside
✔ Higher profitability margins (13% net profit margin)
❌ Bearish Signals & Risks:
⚠ Finance expenses surged (+176%) → Higher debt burden
⚠ Currency translation differences (-91%) → FX risk exposure
⚠ Lower gains on asset sales → One-time earnings boost may not be repeated