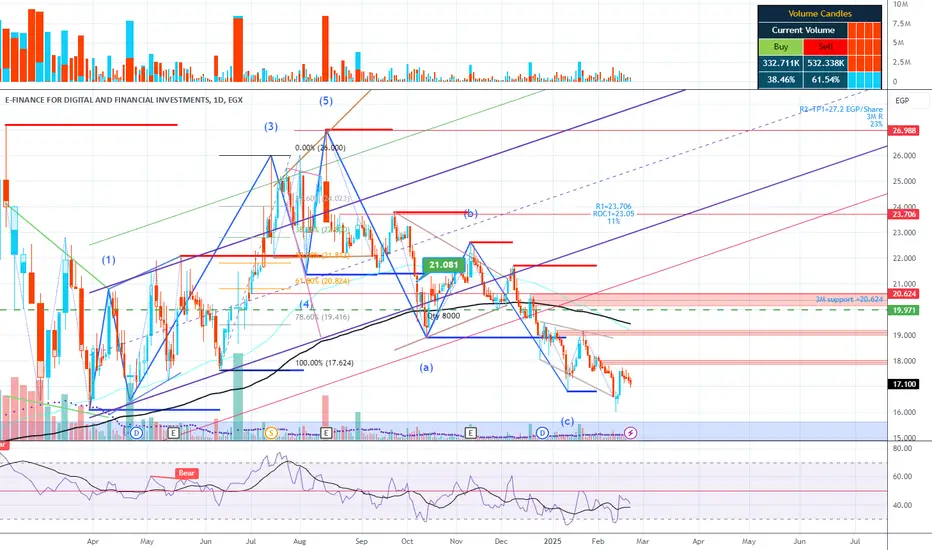
long _ fundamental investorYour latest update provides some positive catalysts for EFIH:
Strong Earnings Growth:
Net income for 9M 2024: 1.39495B EGP, which is 3.5% of market cap
+21% Y-o-Y growth → Indicates strong business expansion
Strategic Partnership with Visa:
Focus on digital payments, merchant solutions, and financial inclusion
Aligns with Egypt’s Vision 2030 → Government support is a plus
Expansion of Tap-on-Phone technology and digital payment services
Government-Backed Health Collaboration:
Partnership with eHealth & Egypt's UHIA → Supports long-term revenue stability
Digitalization of healthcare payments → Increases EFIH’s presence in essential services
Updated Investment Strategy:
Bullish Factors:
✅ Strong earnings growth (+21%)
✅ Visa partnership increases digital finance reach
✅ Government-backed health project adds long-term value
Bearish Factors:
❌ Still overvalued (P/E 32.64X)
❌ Short-term volatility remains a risk
If you're a momentum/speculative investor, the price target of 29 EGP could present an opportunity if market sentiment improves within year 2025
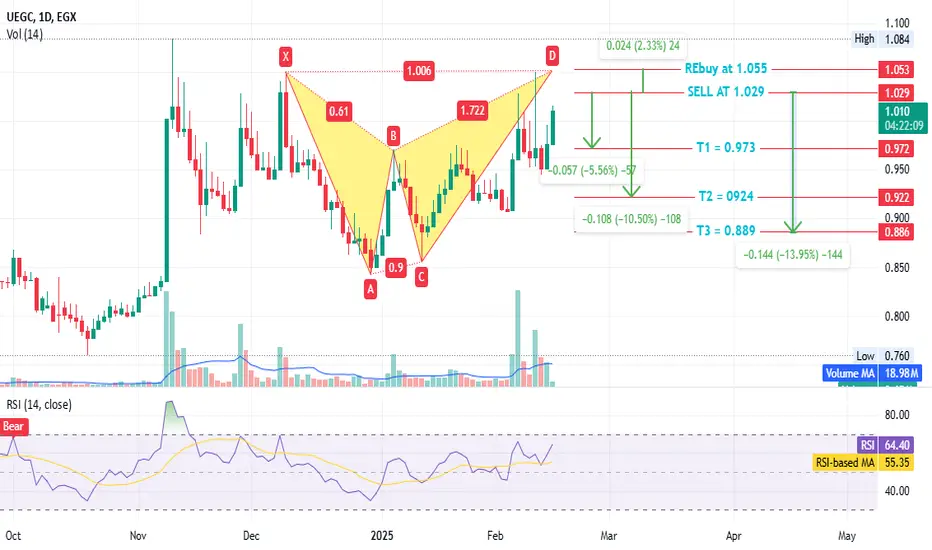
#UEGC - Egyptian stock#UEGC time frame 1 DAY
Created a bearish Gartley pattern
Sell point at 1.029
Stop loss / rebuy 1.055 ( estimated loss - loss of additional profit -2.30% )
First target at 0.973 ( estimated profit - avoid capital loss or Realized gains - 5.50% )
Second target 0.924 ( estimated profit - avoid capital loss or Realized gains - 10.50% )
Third target 0.889 ( estimated profit - avoid capital loss or Realized gains - 14% )
NOTE : this data according to time frame 1 DAY
Its not an advice for investing only my vision according to the data on chart
Please consult your account manager before investing
Thanks and good luck
MFPC Short Hello Everyone,
Have checked this stock for a shorter term opportunity on the 4h tf. The stock seems was way way way over valued and made a huge run to the upside, then now is on the way down. This downtrend only tells that buyers are not that interested on this stock at those prices, along side those who made profits from the initial run up to the upside, which now closing their positions.
Now there are entities and individuals who would love to buy this stock at lower prices, thus it only means that the stock in itself is worth the money (based on the chart and not any fundamentals, as i dont read enough about companies nowadays).
The chart this time shows two different opportunities. The first one is long and the second one is short.
The long opportunity comes as poison in honey (as we Egyptians say), its a reversal trade and going against the trend thus the stoploss is so tight and the target is marked by the yellow arrow.
Now the short opportunity comes as free money laying around, waiting to be taken. There is a short price gap, which likely to be filled, then there will be a liquidity sweep @ 50.9. Then its on.
Do your own research, and find out if the company has any upcoming news that might move the price up or down, also remember to DYOR. This is a lucrative opportunity i think, but without reading about the fundamentals then its not worth it.

#ORHD - Egyptian stock . weekly ( may loss go to 40% ) #ORHD time frame 1 WEEK
Created a 2 bearish pattern ( Gartley and AB=CD ) .
In addition there is SHARK 32 from ( 17.00 to 20.00 ) if prices close weekly higher 20.00 may still rises to 23.00 , in anther hand if prices closes under 17.00 weekly may still down to 14.00 achieved first target for the 2 bearish pattern as follow :
Sell point around 19.00 to 18.00 and wait for action .
Stop loss / reentry 20.00 ( estimated loss -6.80% ) weekly close .
First target at 15.50 to 14.00 ( estimated profit or saving invest 20% ) .
Second target 13.00 ( estimated profit or saving invest 30% )
Third target 11.00 ( estimated profit or saving invest 43% )
the profit in this case is saving your invest from losses up to 40% .
NOTE : this data according to time frame 1 week .
So i think if prices closed weekly under 17.00 , stock will go in downtrend for medium-term .
Its not an advice for investing only my vision according to the data on chart
Please consult your account manager before investing
Thanks and good luck

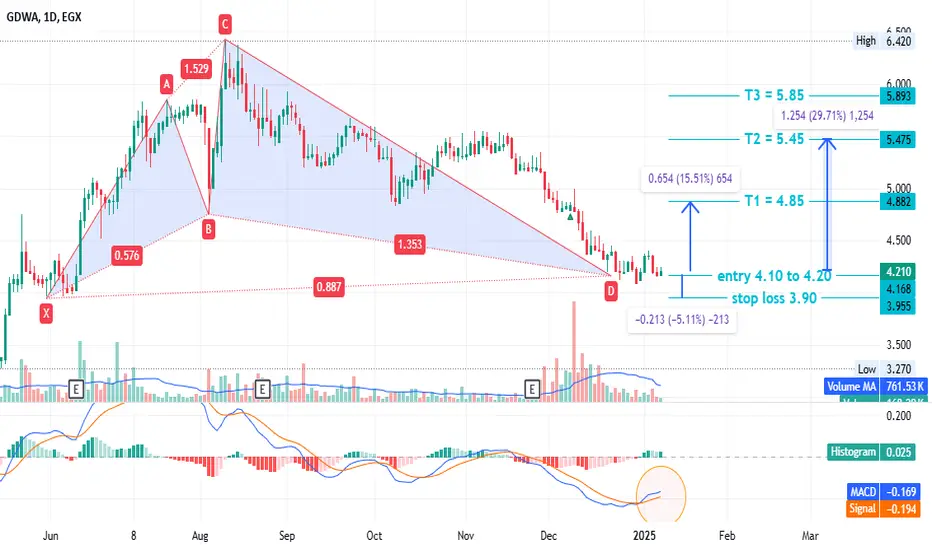
#GDWA Egyptian stock #GDWA time frame 1 DAY
created a patter flay pattern , also the stock in critical point .
Entry level at 4.10 to 4.20
Stop loss 3.90 ( loss may go to up 6% )
First target at 4.85 ( with profit around 15% )
Second target 5.45 ( with profit around 29% )
Third target 5.85 ( with profit 39% )
the positive thing here is MACD created a positive diversion ,
NOTE : this data according to time frame I DAY , it`s may take period up to 3 months to achieve targets , you must study well the Alternative opportunities before invest in this stock .
In addition EGX70 is in critical point
Its not an advice for investing only my vision according to the data on chart
Please consult your account manager before investing
Thanks and good luck
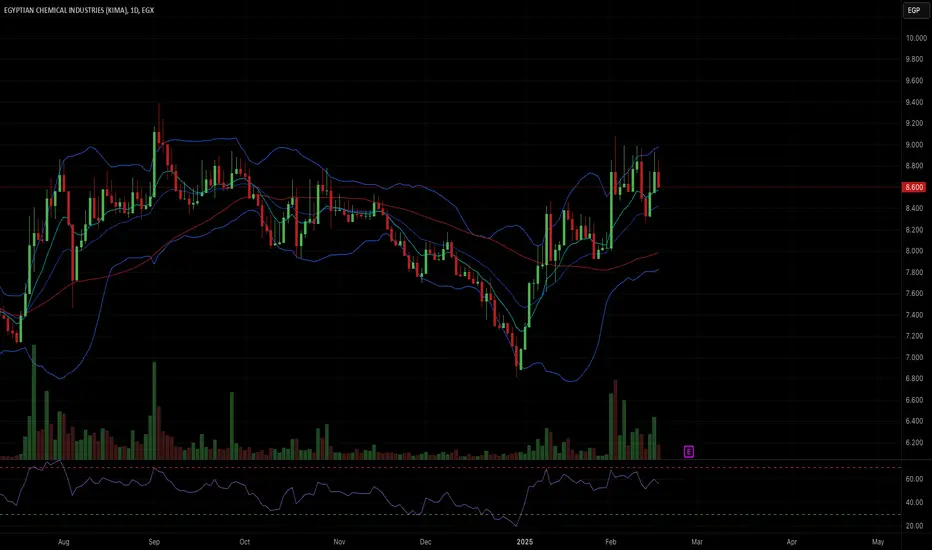
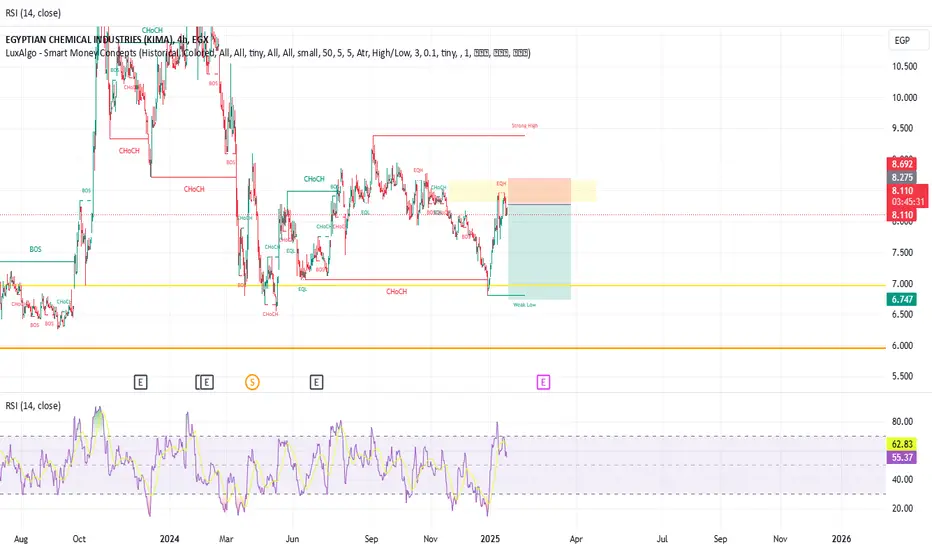
EGCH: Building Momentum – Eyes on the Next Move!“EGCH is setting up for a potential move with strong momentum and a bullish structure. Watching for a key reaction around the 8.40–8.50 EGP zone, where buyers could step in for continuation. If strength holds, upside potential toward 9.20–9.50 EGP is on the table. A breakout above 8.80 EGP with volume would confirm further momentum. Keeping an eye on how price reacts at these levels—let’s see how it plays out! ”
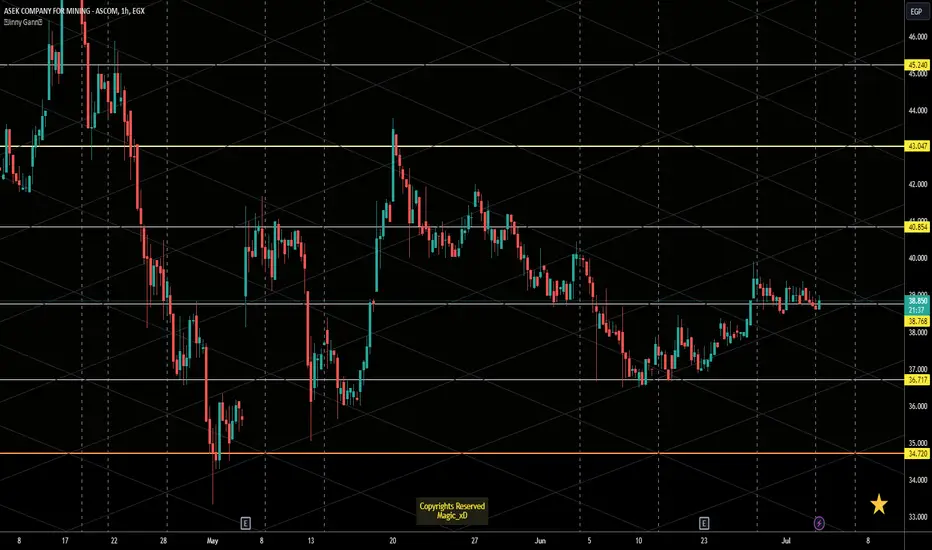
Ascm Important LevelsHello Dear Traders,
- Important Levels
On the Chart "Horizontal Lines" Based on Gann Square of 9
Works as Support/Resistance. Watch for Price action around those levels
- Jinny Gann Grid
- Vertical lines works as time lines. Expect Reversal around them.
For Today
Support : 38.38 - 38.75
Resistance :40.85 Then 43.047
Wish you Good Luck Trading.
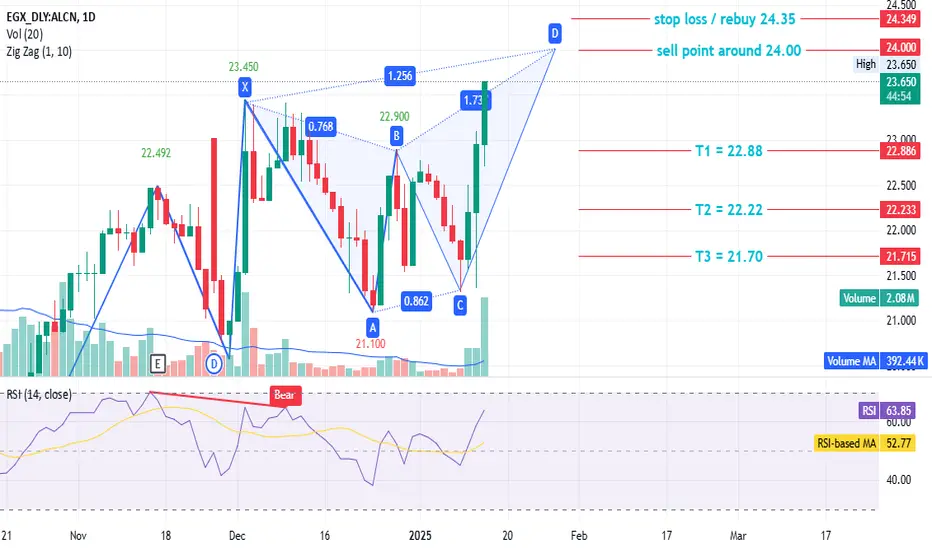
#ALCN - Egyptian stock#ALCN time frame 1 DAY
Going to Create a bearish Gartley pattern
Sell point at 24.00
Stop loss / reentry 24.35
First target at 22.88
Second target 22.22 up to 21.70 ( estimated profit up to 8% ).
NOTE : this data according to time frame 1 DAY
Its not an advice for investing only my vision according to the data on chart
Please consult your account manager before investing
Thanks and good luck
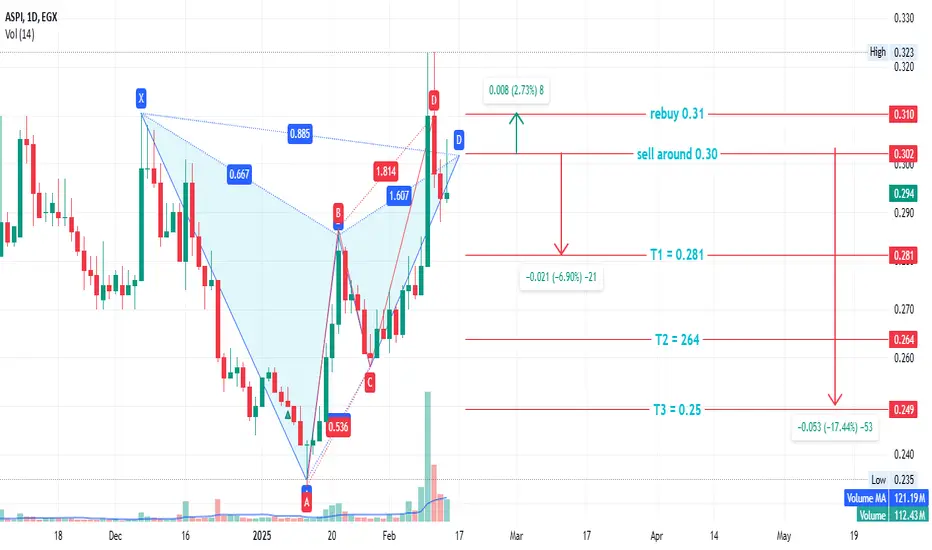
#ASPI - Egyptian stock#MEPA time frame 1 day
Created 2 bearish patterns ( Gartley and AB=CD )
Sell point at 0.30
Stop loss / rebuy 0.31 ( estimated loss - loss of additional profit 3% )
First target at 0.281 ( estimated profit - avoid capital loss or Realized gains - 6% )
Second target 0.264 ( estimated profit - avoid capital loss or Realized gains - 12% )
Third target 0.25 ( estimated profit - avoid capital loss or Realized gains - 17% )
NOTE : this data according to time frame 1 day
Its not an advice for investing only my vision according to the data on chart
Please consult your account manager before investing
Thanks and good luck
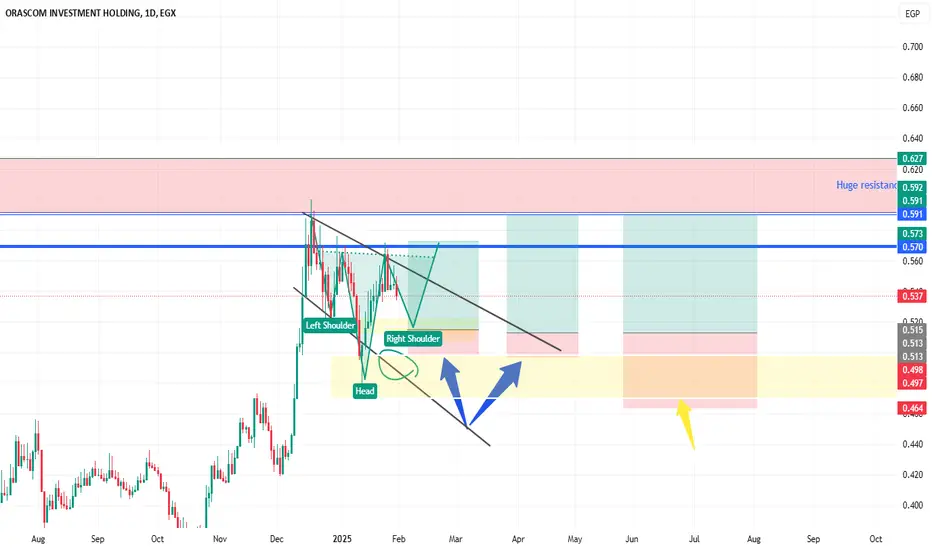
OIH Long Thats a tough chart tbh.
Ok. So there are two patterns on here that i think are very interesting. What is most interesting is that both patterns are bullish. The first one is the bull flag, and the second one is inverted head and shoulders.
On the bearish side, there is a huge resistance on the weekly which explains both the bullish chart patterns discussed earlier. It looks like bulls prepare for another move up to break the resistance, and every attempt of bears or sellers to push the price down, the bulls push it further up.
So i have marked both my aggressive entries, marked in blue, and my conservative entry (taking all scenarios into consideration) marked in yellow.
DYOR.
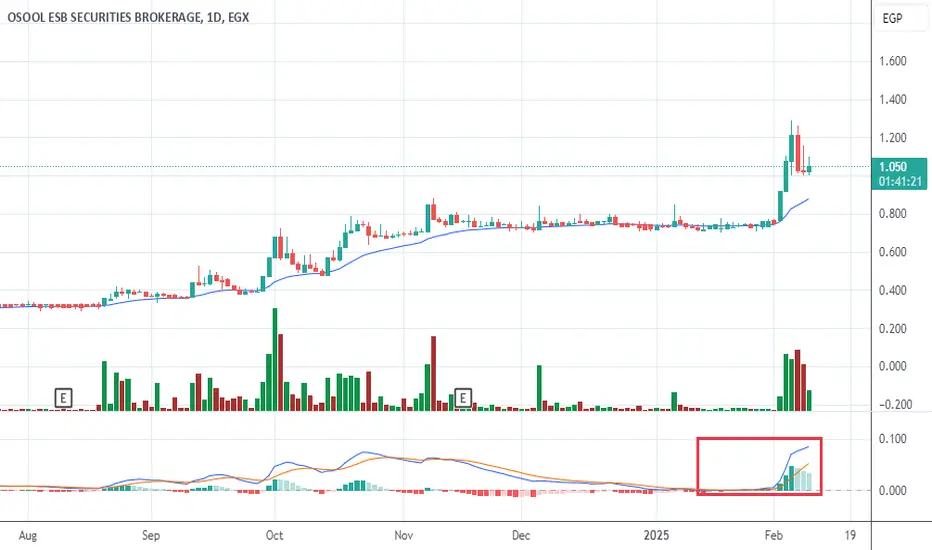
Triangle pattern breakoutA bullish opportunity by breaking the upper side of the triangle at 0.54 which also represents a previous resistance, today marked the highest traded volume ever, the potential target price is around 0.7
Meanwhile by breaking 0.65 area there is a giant cup and handle breakout with a potential target of 1 EGP
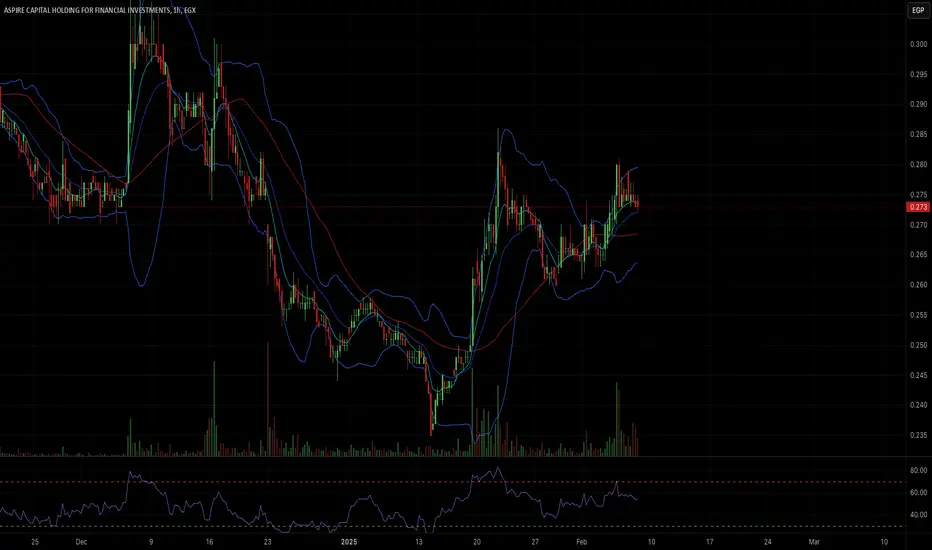
Free Trade Idea: ASPI Ready for the Next Move! ASPI is setting up for a high-probability move, and I’m sharing a rare free trade with exact entry and exit levels. I don’t usually give precise entry and exit details, but this time, I’m making an exception. Ideal entry is at 0.270–0.272 EGP, targeting a move toward 0.300 EGP. Let’s see how this plays out! 🚀 Drop your thoughts in the comments
#MEPA#MEPA time frame 1 hour
created a bearish Gartley pattern
sell point at 1.34
stop loss / rebuy 1.38
first target at 1.297
second target 1.26
NOTE : this data according to time frame 1 hour
Its not an advice for investing only my vision according to the data on chart
Please consult your account manager before investing
Thanks and good luck

#ASPI Egyptian stock#ASPI time frame 1 DAY
Created a Bullish Gartley pattern
Entry level at 0.25
Stop loss 0.24
First target at 0.27
Second target 0.284
Third target 0.295
If prices close up 0.31 then there anther target at 03.328
MACD created a positive diversion that may support our idea.
NOTE : this data according to time frame I DAY , it`s may take period up to 3 months to achieve targets , you must study well the Alternative opportunities before invest in this stock .
Its not an advice for investing only my vision according to the data on chart
Please consult your account manager before investing
Thanks and good luck

please watch today close and MACD signalstoday close is important also weekly and monthly trend following is giving us a wide view for the stock trend
EGCHjust noticed this valid short right now.
I have no information about the stock or the company behind it, also i didnt follow the news today or anything related to this coin. So this is only TA analysis opportunity
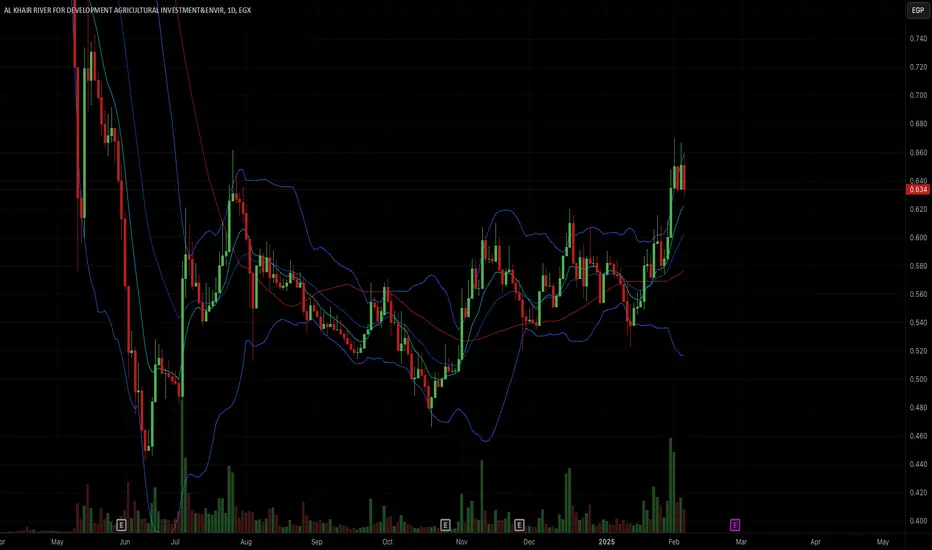
KRDI: Ready to Break or Bounce? Watch These Levels!KRDI is setting up for a key move, with price holding above support at $0.62 and showing strong momentum on both the daily and hourly charts. If it reclaims $0.65 with volume, a breakout towards $0.68–$0.72 is in play. However, a pullback to $0.62 could offer a solid buy opportunity if support holds. Watching volume closely—confirmation is key. A drop below $0.60 would invalidate the setup. Let’s see how this plays out! 🚀📈
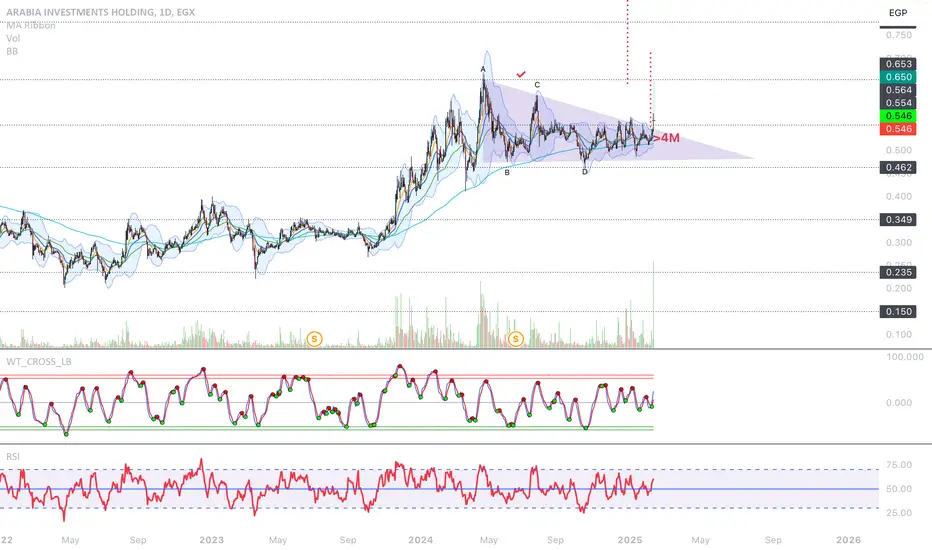
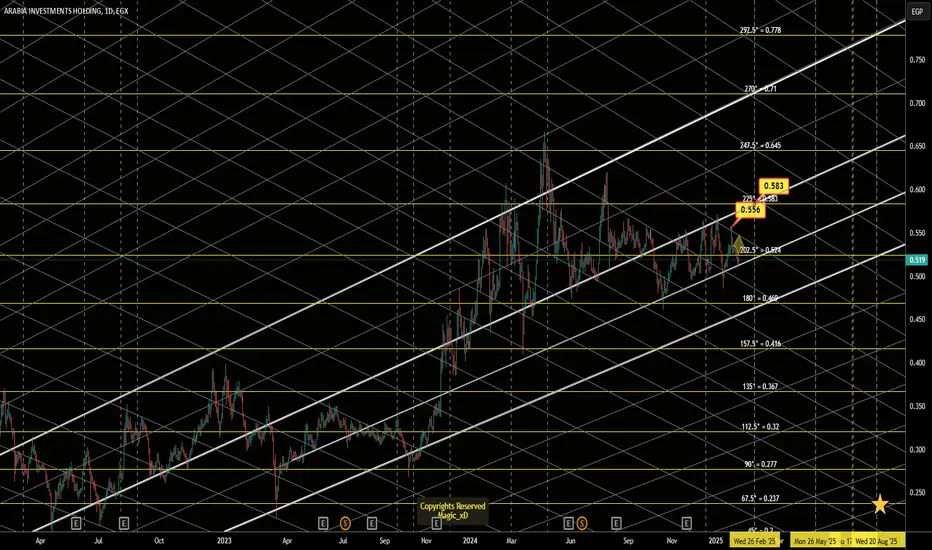
Aih Gann analysis - Important levelsWelcome to a new analysis, and today we’re breaking down the Arabia Investments Holding stock on the Egyptian Exchange. We’ll go through the chart in detail, highlight key technical levels, and discuss potential future scenarios. 🔥
🔎 Quick Overview of the Chart
🔹 The stock is currently trading at 0.519 EGP after testing strong resistance at 0.524 EGP and slightly pulling back.
🔹 We can see that the stock is moving within a rising channel defined by the white trendlines and is attempting to hold above the lower boundary to continue its uptrend.
🎯 Key Levels on the Chart
📌 Important Resistance Levels:
✅ 0.524 EGP – A very strong level. If the stock successfully breaks above it with strong closing, we could see further upside.
✅ 0.583 EGP – A key resistance zone. Breaking above it could lead to a move toward 0.645 EGP in the medium term.
📌 Support Levels:
🛑 0.469 EGP – The nearest support level. If it gets broken, we might see a drop to 0.416 EGP.
🛑 0.416 EGP – A major support zone and a potential area for a strong rebound if a correction occurs.
🚀 Possible Scenarios
📈 Bullish Scenario (Uptrend):
If the stock stabilizes above 0.524 EGP with a strong daily close, we could see an upward move toward 0.583 EGP, followed by 0.645 EGP.
Breaking above 0.645 EGP would signal a strong bullish phase.
📉 Bearish Scenario (Downtrend):
If the stock fails to hold above 0.524 EGP, we might see a corrective move down to 0.469 EGP.
A break below 0.469 EGP could push the stock lower toward 0.416 EGP, which is a key support level for a possible bounce.
🕵️ What Should We Watch for Now?
✅ Monitor the daily closing price: If we see a strong close above 0.524 EGP with high trading volume, the stock could move higher.
✅ If a pullback happens, keep an eye on 0.469 EGP as a key support zone.
✅ The overall bullish structure remains intact as long as the stock is trading within the rising channel.
💬 What’s your take on this analysis? Do you agree or see another scenario? 👇👇 Let’s discuss in the comments!
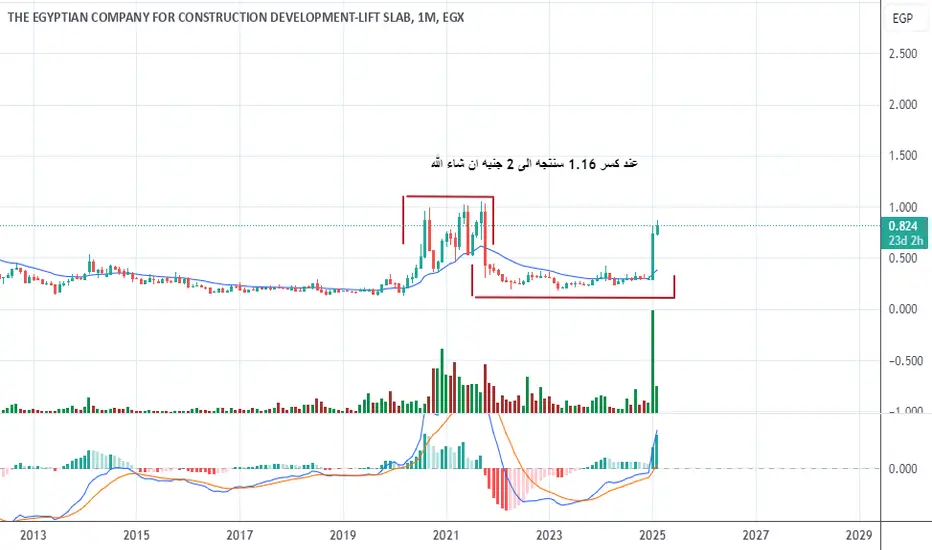
EDBMthe stock is accumulating and after breaking and close above 1.16 we are going to reach 2 L.E. in shaa allah
Cairo Oils & Soap - Gann Analysis & Future Price Projection
📈 **Market Overview:**
Cairo Oils & Soap (EGX) is currently trading at **0.268 EGP**, facing resistance around **0.295 EGP**. The price is consolidating within a structured Gann grid, with key angles and price levels playing a significant role in market behavior.
🔍 **Technical Breakdown:**
- The **450° Gann level (0.295 EGP)** acts as immediate resistance. A breakout above this zone may lead to **0.322 EGP (495°)** as the next target.
- The price has been respecting the ascending white trendline, indicating a **medium-term bullish structure**, but it must hold above **0.243 EGP (360° Gann level)** to maintain strength.
- Further resistance levels include **0.351 EGP (540° Gann level)** and **0.413 EGP (630° Gann level)**.
📊 **Potential Scenarios:**
🟢 **Bullish Case:** If the price breaks and holds above **0.295 EGP**, we could see an upward movement towards **0.322 EGP**, then **0.351 EGP** in the coming weeks.
🔴 **Bearish Case:** A breakdown below **0.243 EGP** could trigger a drop towards **0.219 EGP (315° Gann level)** or even **0.196 EGP (270° Gann level)** if sellers gain momentum.
⚠️ **Key Takeaway:**
Price action around the **0.243 - 0.295 EGP range** will dictate the next move. A strong breakout above resistance could drive bullish momentum, while failure to hold support may result in further downside.
📌 **What are your expectations for Cairo Oils & Soap? Share your insights! 🚀🔥**

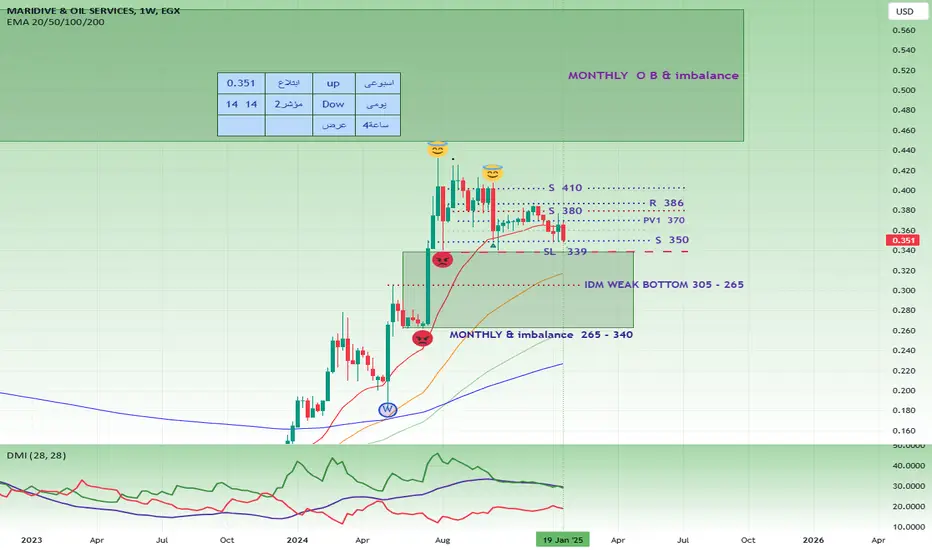
Turtle arrow movement scenarioAs a result of the good news in the statements of the US president, including the trend to reduce interest rates and is expected to have a positive impact on the markets, we hope that the Egyptian market is also affected positively.
The stock's performance in the current period is positive and we hope that it will continue so it is expected a weak downward movement and then rise to the levels shown on the chart.
And beware of breaking the 340 level
Thank God always... Good luck to everyone.
MOED Egypt has a potential for a breakout 0.469 / 0.520 / 0.54130-min chart
The stock EGX:MOED is trading in a falling wedge between R and S lines, and may form a bigger pennant pattern.
We need a confirmation, after closing 3 candles above 0.425, then the target will be 0.469
Above 0.470 for 3 candles, the next target will be 0.520 - extended to 0.541
Consider a near stop loss - and note the important support line at 0.400

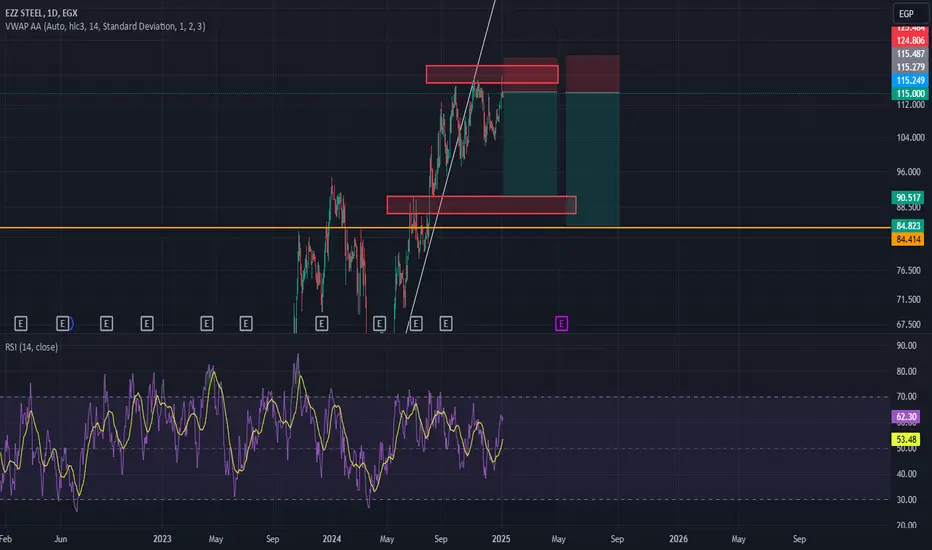
EZZ steal, its time for correctionWhat a beautiful short opp in here.
looks like the price is just hitting a prick wall that it cant get through. Unless fresh liquidity enters the market, its short. Also check out this big rejection candle on the daily, looks very bearish tbh.
keep track of the news in the coming days, if there is any positive news, then close the trade.