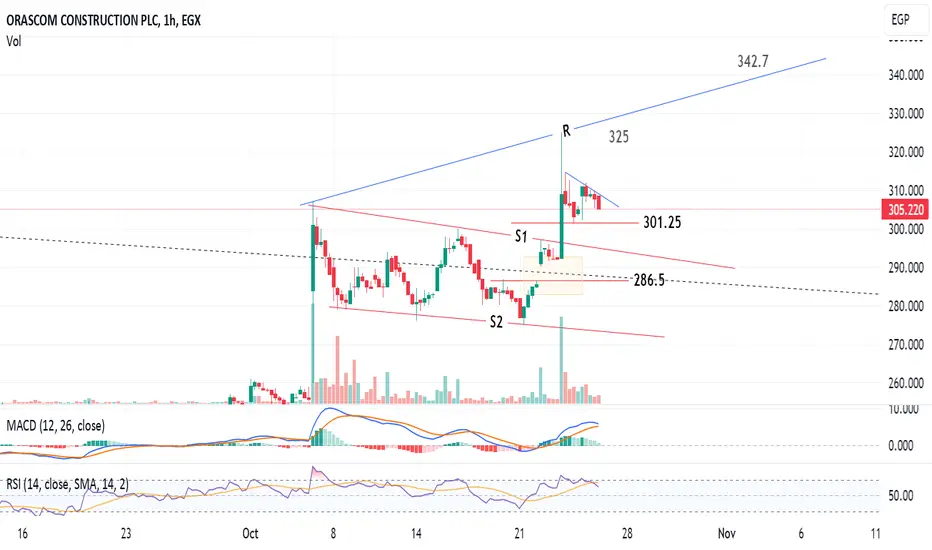
Orascom Constr. Egypt has a "conditional" target 342.71-hour chart
The stock EGX:ORAS completed a flag chart pattern (lines S1 and S2) and is re-testing a support level at 301.25
Technical indicators RSI and MACD are showing a correction is soon
Next support is line S1 (at around 294.5) - Closing below this level, the next support will be S2 (around 272)
Trading above 308 for 2 hours, the target will be 325, and stabilizing above 325 for 3 hours, the target will be 342.7 - 343
Raise the profit protection / stop loss level as the price goes up.
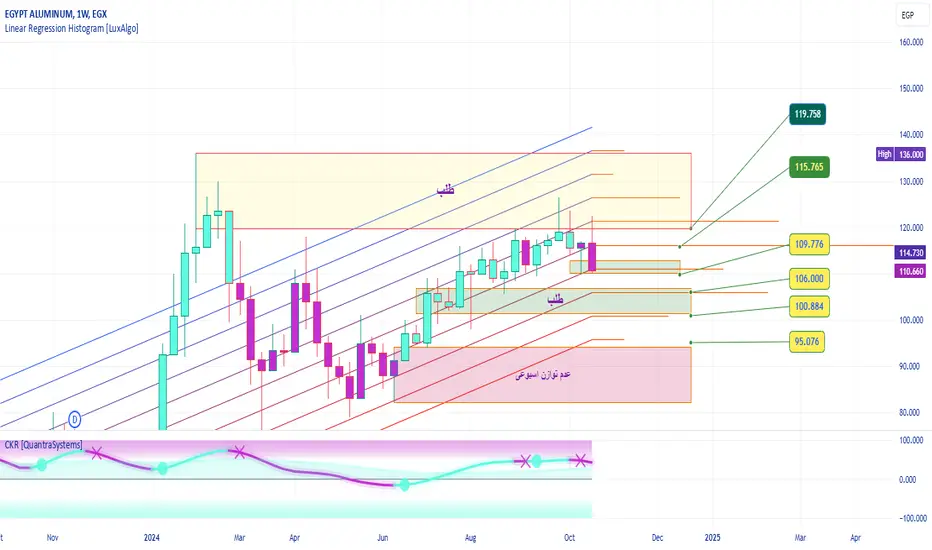
What if the stock falls, what are the maximum points of decline?The main purpose of this analysis is to zoom in on the chart for a better view to facilitate the decision-making process (hold - buy - sell). Especially since the stock reached a historic peak during this period.
As shown in the weekly chart, there are areas of demand and areas of imbalance.
The worst scenario is that the price falls to the imbalance zone.
Good luck to everyone, God willing
Emaar Egypt has a potential to 9.1 and 9.4Daily chart
The stock is trading in a rising channel - the price is heading towards the upper line (Resistance line R).
Next resistance levels will be 8.7, 9.1 then 9.4
The technical indicators RSI and MACD are supporting the positive view.
Consider a stop loss below the line SL. Currently, below 8.0

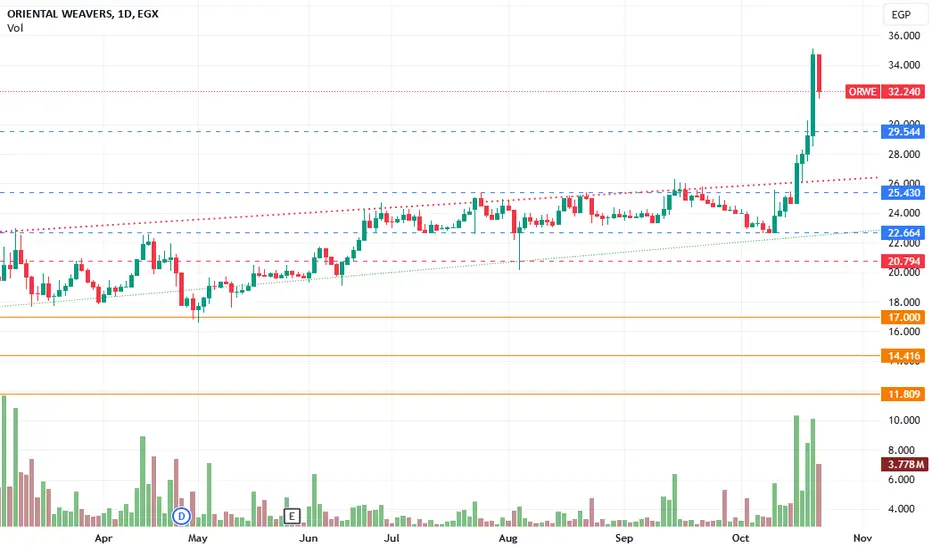
oriental weavers have a great Chanse to grow and earn oriental weavers have a great Chanse to grow and earn after establishing this framework
El Ezz Porcelain has a potential to target 31.6Daily chart, the stock EGX:ECAP is drawing a symmetrical triangle, between the Resistance line R and Support line S.
Closing above R for 2 days (above 24 for more safety), the price will target 31.6 passing through the shown resistance levels.
Stop loss is below S, and can be below SL line at 21 (one day, with low volume)
Below SL line, the price may fall to line S1, then S2
Remark :
Either quick trade between R and S lines.
Or wait for the new entry confirmation after crossing R.

Arabian Cement : Opportunity after breakout - Target 14Daily chart, the stock EGX:ARCC is trading in a descending channel, and a long flag chart pattern may be completed.
After crossing the Resistance line R, the target will be 12.
Closing above 11.3 for 2 days, the target will be 14 extending to 14.5
A new buy entry should be safer above 11.5 with the stop loss below 11.1
For an immediate entry, the Stop loss below SL line at 10.8 should be considered.

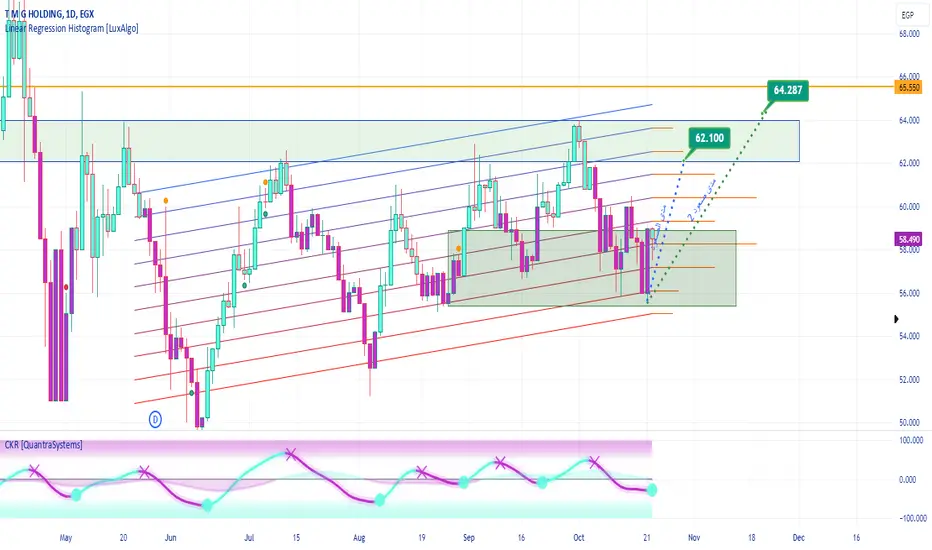
Backup possibilities for the next periodThe movement of repeating highs and lows from around the beginning of the year foretells the next upward movement.
The correction rates after the decline represent 16%, 15%, or 11% of the last upward movement.
Therefore, the stock is expected to rise to the levels shown on the chart..
Then the correction goes back down As we have been accustomed to the stock for quite some time.
This expectation is supported by technical indicators, which produce bullish signals.
Good luck everyone.
SKPC EGYPTION STOCK entry level from 20.80 : 20.44 ( FIP 0.884 )
stop loss 20.25 daily close
target 1 = 22.15
target 2 = 23.15

ICON Egypt can target 26 and 27Daily chart, the stock EGX:ENGC is forming a rising channel.
The last candlestick can be considered as signal for a positive movement.
The expected target is 27.0 at the resistance line R, passing through resistance zones 24.4 and 26.0
Consider a stop loss below 22.0

Lecico Egypt has a potential to re-hit Resistance line at 29.2Daily chart
The stock is trading in a broadening pattern (mainly between lines R and S); and the next level is 25.6
Above this resistance , the next targets will be 27.3, 28.0 and 29.2
The technical indicators RSI and MACD are supporting this view.
Consider the stop loss below 22.6 - And raise the protection level as the price goes up.

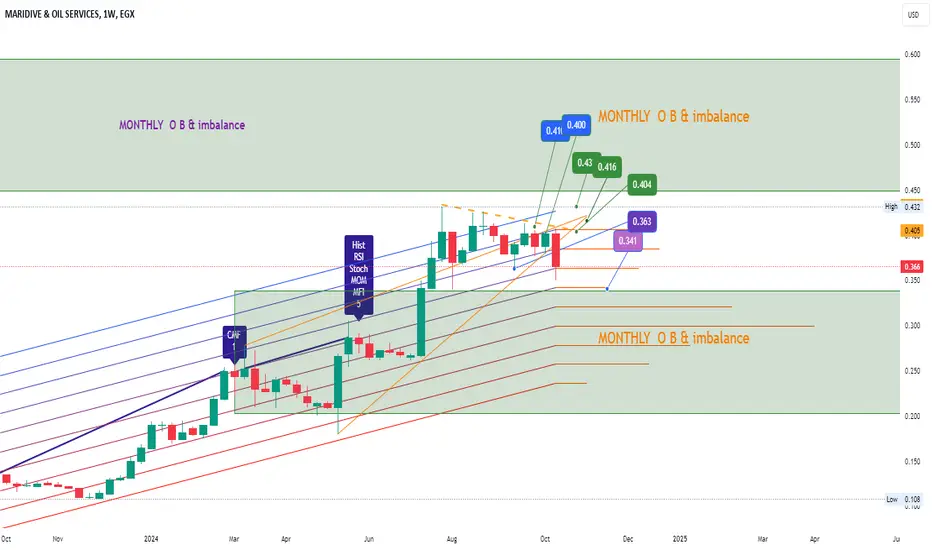
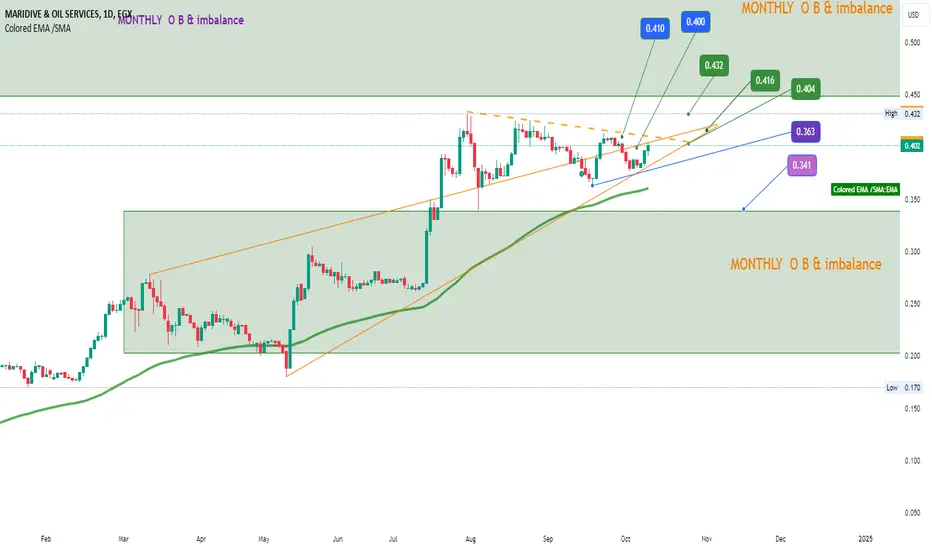
Updating for the last chart The stock's performance over the past few days does not contradict the previous analysis. The last candle on the chart so far formed liquidly and the price reached the 0.35 level and quickly returned to the rise.
Noting that the stock has been moving for 12 weekly candles in a horizontal movement between a price range (0.340: 0.432).
God willing, this will not cause concern about falling to a level below 0.35
Currently, purchasing is the best opportunity for the short- and long-term investor.
If we assume the maximum level that can be reached, which is the area of monthly imbalance at the bottom of the chart, the maximum price will reach 0.25, and this is not possible except in cases of crises or disasters, God Almighty forbid.
It is considered a great purchasing area to compensate for any loss in the past
so It is safe to recommend buying in the areas indicated on the chart (0.35-0.36-0.365).
Hoping for success from God Almighty
I wish everyone success from God Almighty
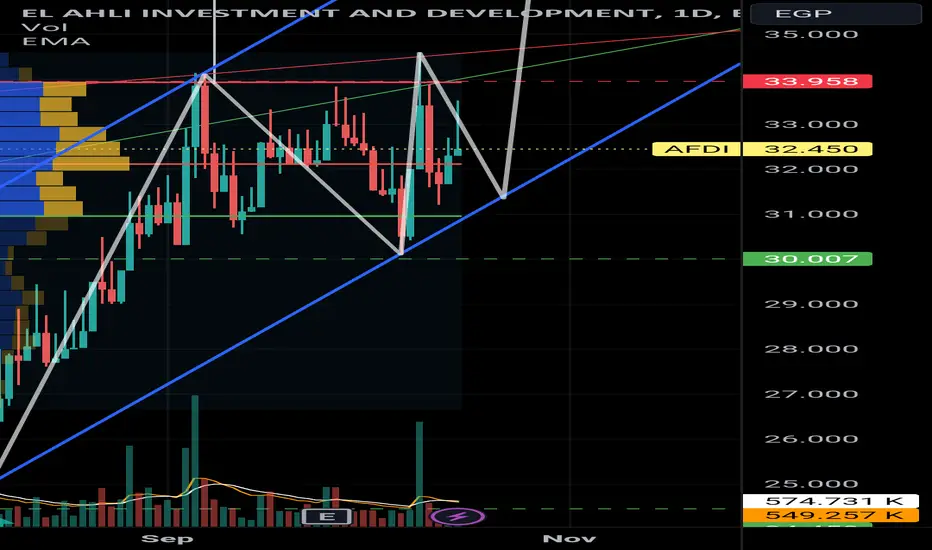
AFDIThe stock is moving in a consolidation trend between 30 and 34 This period is expected to end soon with the Bollinger Bands tightening and volume highs falling R1. 33.95 R2. 38.3 S1. 31 to 30 T1. 41
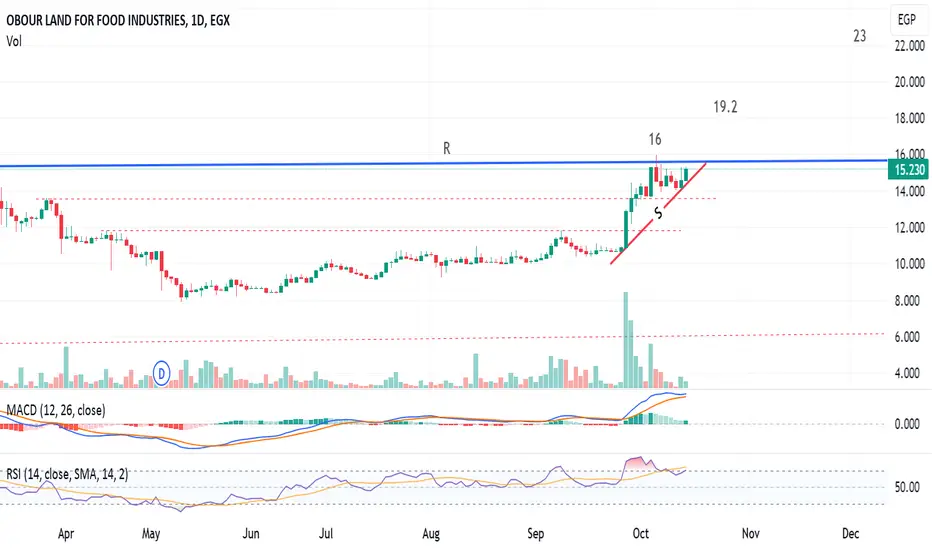
Obour Land is preparing to breakout - to 23Daily chart, the stock EGX:OLFI is preparing to beat the resistance line R and breakout.
Closing above resistance line R for 2 days (above 16), the target will be 19, then 23
Technical indicator MACD is positive, and RSI is near over-bought (so some minor correction may happen around the breakout level.
Consider stop loss below the line S or below 14.1
Probabilities of the next possible weekly movementIn the weekly term, the price moves between two deterministic ranges.
The upper area is characterized by imbalance and is also a supply area, while the area below the price is an imbalance area.
The price probabilities in the event of a decline or rise are clearly visible on the chart
Technical indicators support the potential upward trend.
The next movement of the investor, more than the speculator, requires patience or speculation on the fluctuation that occurs.
pivot point is 102.0
Good luck everyone
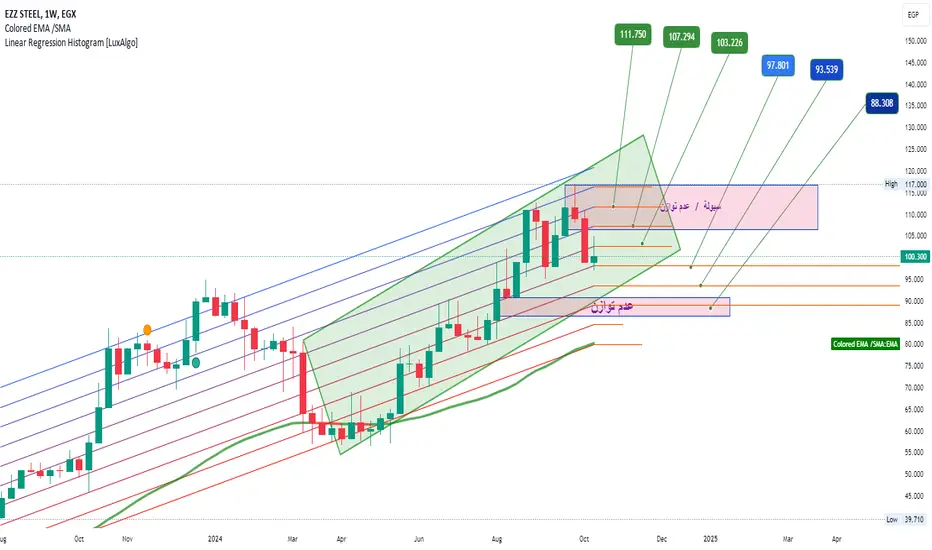
Expected upward trendThe uptrend is supported by the ascending triangle and EMA 100 indicators .
The green areas above and below the price are areas of order block, imbalance, and monthly liquidity.
Good Luck For All
Ismailia Poultry targets 12.1 then 13.9 after crossing 9.5Daily chart, the stock is trading between support level 8.6 and resistance level at 9.5
Closing above 9.5 for 2 days, will push the price to the shown resistance levels.
Consider a stop loss below 8.6, and raise the level as the price goes up for profit protection.
Technical indicator MACD shows a consolidation in this range is still going on.

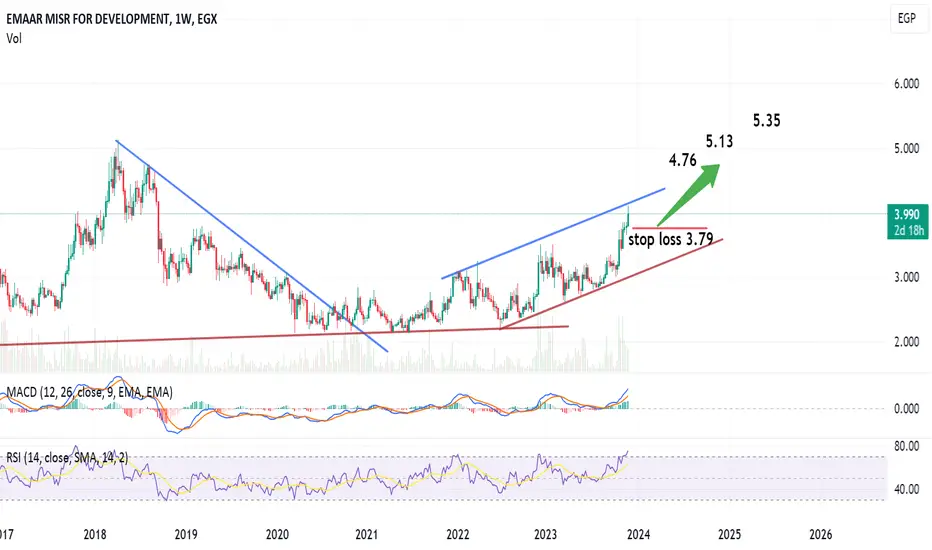
EMFD has targets 4.76, 5.13 and 5.35On the weekly chart, EMFD is pushing to cross the resistance line. Above 4.17, the targets will be 4.76, 5.13 and 5.35
RSI and MACD are positive upwards
Stop loss at 3.79 should be considered
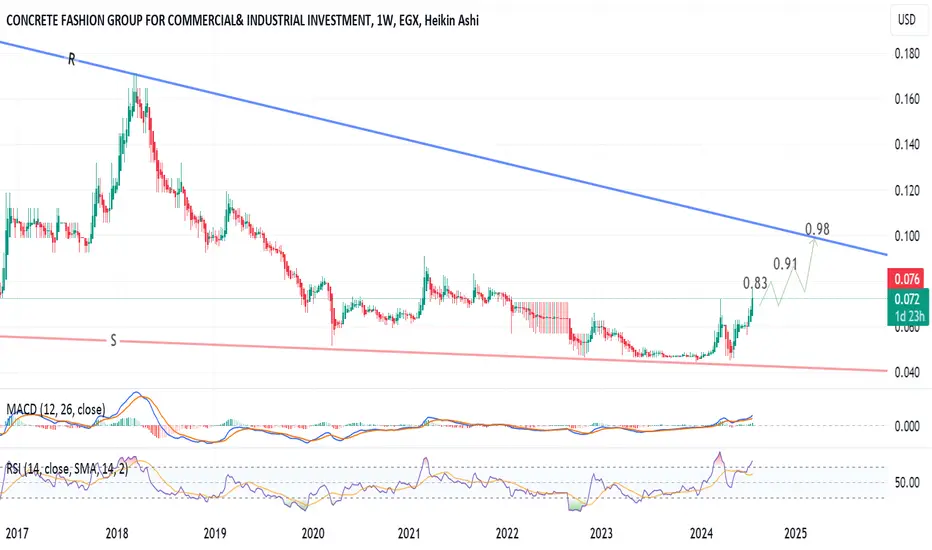
Concrete Fashion (Arafa) positively on uptrendWeekly chart, the technical indicators MACD and RSI are supporting the uptrend of the stock.
There are resistance levels at 0.83 and 0.91
The target is 0.98 - 1.00 after crossing 0.91
Consider a near stop loss below 0.72
Note: Low volume trading on the daily time-frame.
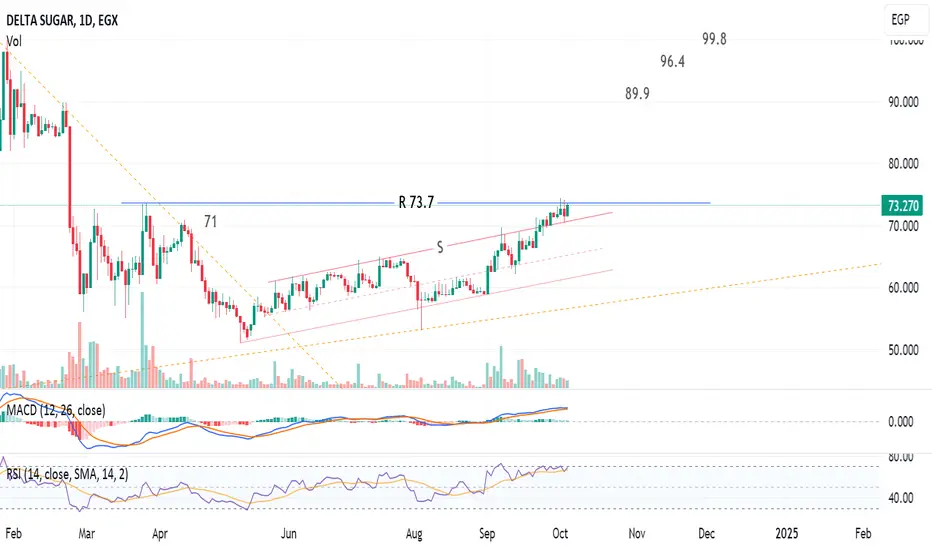
Delta Sugar, Egypt, has a potential to 90'sDaily chart, the stock EGX:SUGR is trying to beat the resistance level at 73.7
2 days closing above 74, the target will be 89.9 then 96.4 extending to 99.8
The support line S should be considered for the near stop loss level for the daily time-frame.
Currently at 70.5
Technical indicators RSI and MACD are supporting this bullish view.
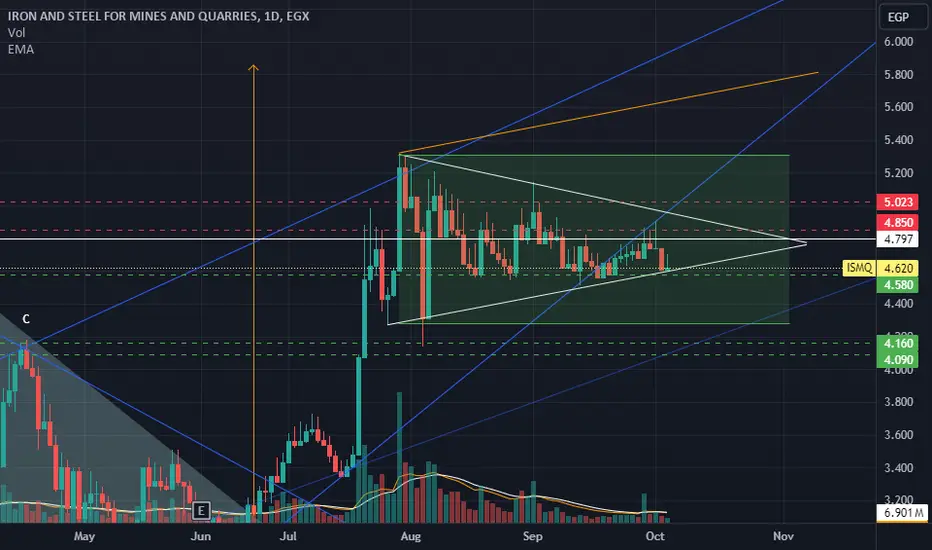
iron is black goldstand in 4.58
t1 .... 4.87
t2 .... 5
st 4.58 with close
support 4.16 ///4.14
volume is less
Ezz Steel (ESRS) formed a chart pattern, to target 94.9Daily chart, ESRS stock formed a bullish chart pattern (descending triangle), and the target is 94.9, extending to 110.6 (Fibonacci extension)
Technical indicators RSI and MACD are positive.

Madinet MASR targets 5.7 after the breakoutDaily chart, the stock EGX:MASR is expected to rebound from the support line S to hit the resistance line R at around 4.57 - 4.56
Immediate stop loss below S (4.22)
Another bullish setup will be triggered after crossing the dashed line R1, and closing above 4.70 for 2 days, the target will be 5.6 - 5.7 passing through a resistance level at 5.2
Note : Be careful with the profit protection / stop loss levels.
