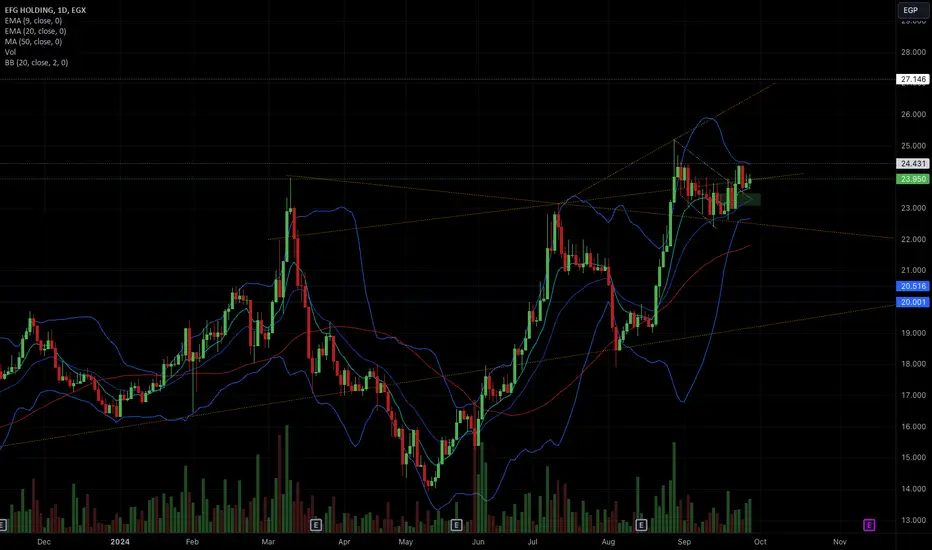
EFG Hermes Egypt will target 27, then 30 and 33.3Daily chart, the stock EGX:HRHO is forming a rising wedge pattern (Between R and S2), where the support line S2 should be carefully monitored. A Stop Loss below line S2 should be considered.
Below S2, the probability will be high to fall to S1
The technical indicators RSI and MACD are in favor of bullish movement; which should be targeting the upper resistance line R at around 27.0
Above R for 2 days, the price will target 30 and 33.3

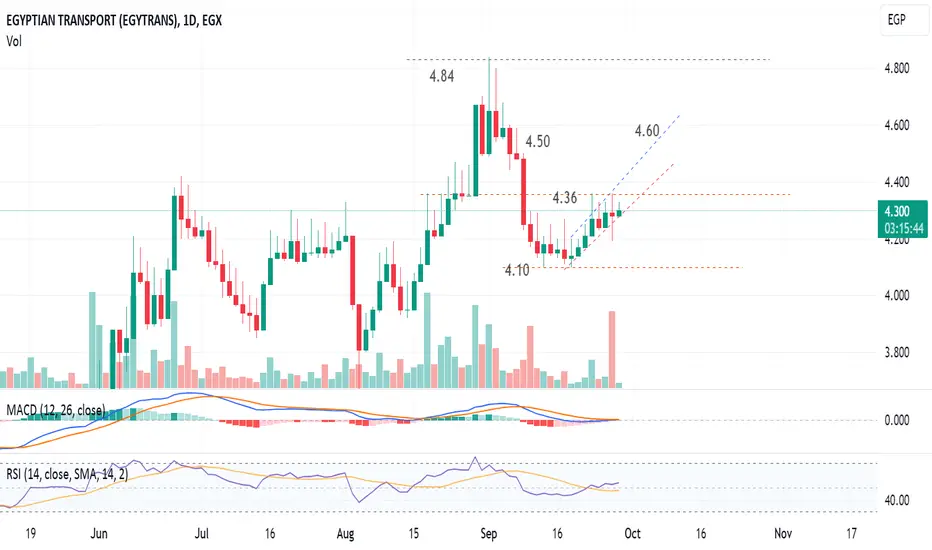
Egytrans is preparing to target 4.60 soonDaily chart, the stock EGX:ETRS dropped from 4.84 to 4.10 and renounced to 4.30
The technical indicators RSI and MACD are telling the price will soon go to 4.50 extendable to 4.60
Note that 4.36 level is a resistance and there may be some fluctuation around this level; before resuming upwards.
Stop loss below 4.25 should be considered
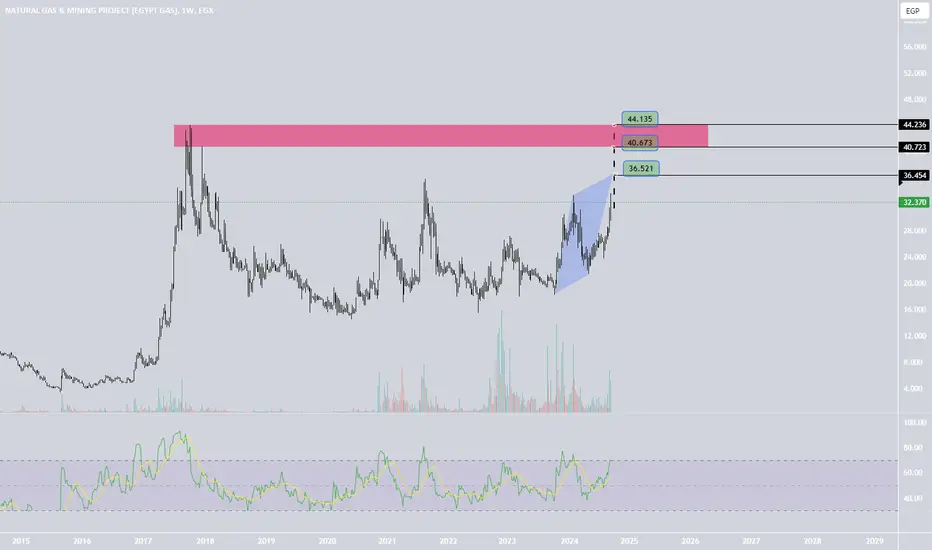
EGASIt is clear that trading is in a direction of momentum. Targets are marked on the chart and may take some time. EGX:EGAS
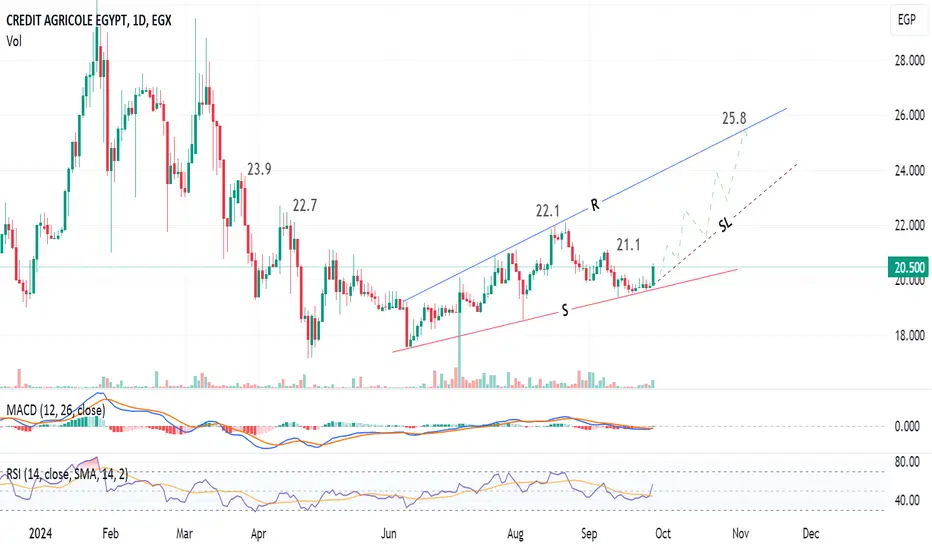
Credit Agricole should target 25.8 in few weeksDaily chart, the stock EGX:CIEB is trading in a rising pattern (expanding triangle), and I am expecting the price will go upwards to hit the resistance line R at around 25.8 passing through the shown resistance levels.
The technical indicators RSI and MACD are signalling a soon bullish rally.
The Stop Loss line SL should be monitored
HRHO to ATH- For a ticker like HRHO with all its outstanding shares to be holding like that may be signaling
a continuation to the upside towards ATH.
- trade it on a breakout or buy it now with a clear risk defined.
- Im being asked to give a price to where it will go but I lost my crystal ball.
- Size according to your risk tolerance, there is no certainty in trading.
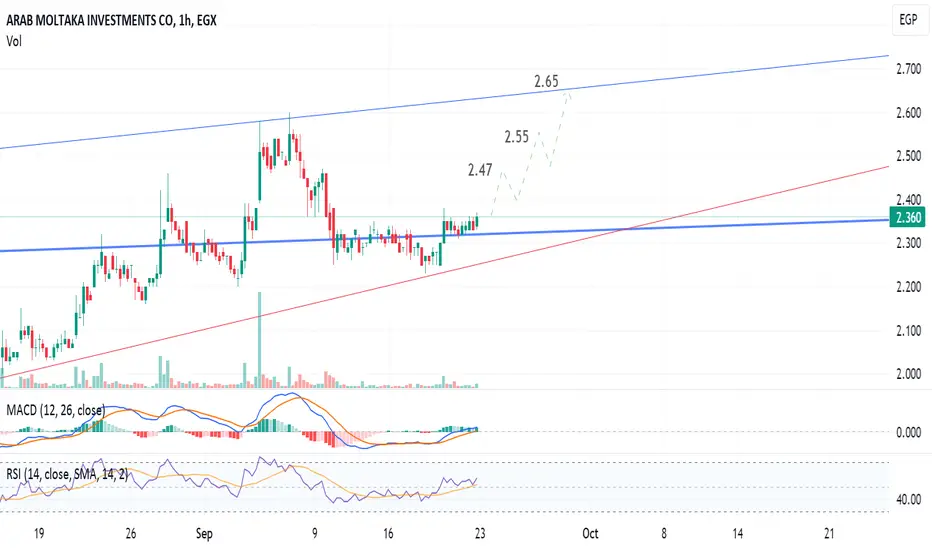
Arab Moltaka, Egypt has a high potential to reach 2.65 soon1-hour chart, the stock EGX:AMIA is forming a chart pattern, and is supposed to hit the upper line at around 2.65 within few days.
Resistance levels at 2.47 and 2.55
Technical indicators RSI and MACD are supporting this view.
Stop loss should be considered below 2.31
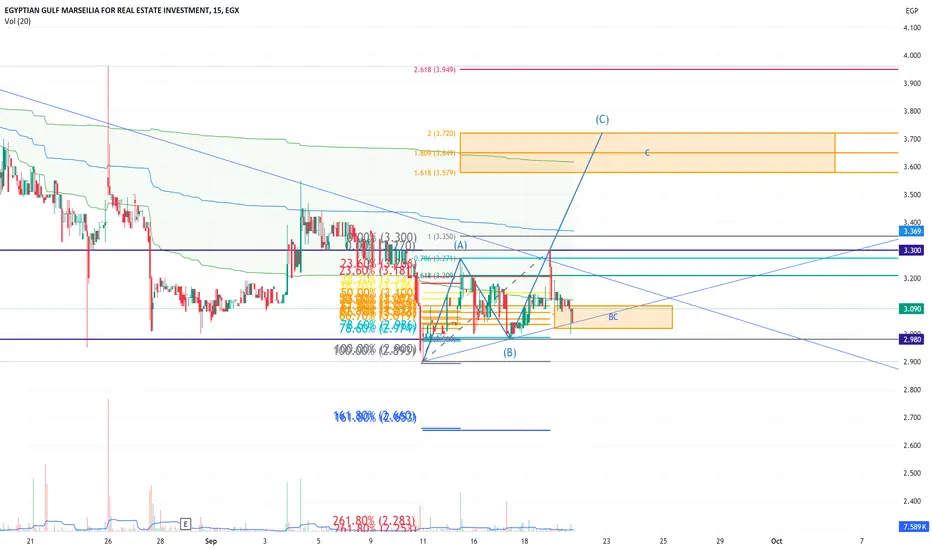
"Marseilia Egyptian Gulf" Stock (MAAL) Analysis Based on SKThis analysis is based on the SK Strategy, focusing on corrective price patterns like ABC and Fibonacci retracement levels to identify support and resistance. Currently, the stock is trading at 3.09 EGP, with a correction pattern indicating potential upward movement towards 3.60-3.70 EGP. The 2.99 EGP (78.6% Fibonacci level) acts as support, while breaking below 2.98 EGP might signal further declines.
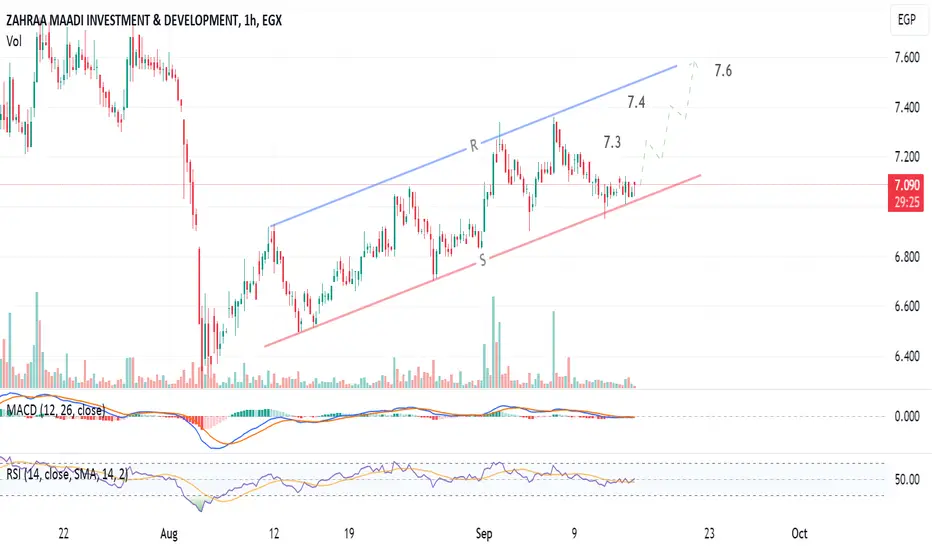
Zahraa Maadi Egypt : A quick trade opportunity1-hour chart, the stock EGX:ZMID is preparing to rebound from the lower channel line R.
The target should be the upper line (around 7.6) passing through some resistance levels.
Technical indicator RSI is supporting this view.
Stop loss below 7.05 should be considered.
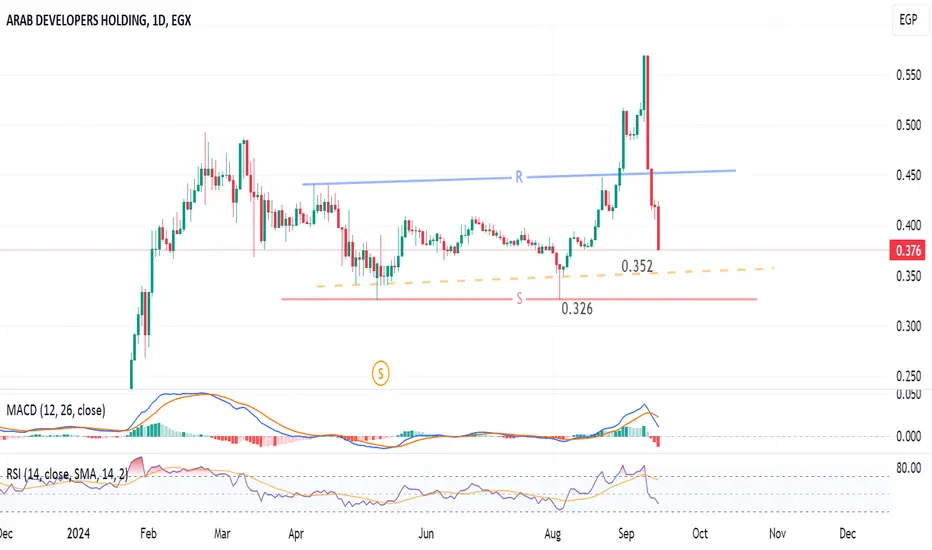
Arab Developers, Egypt - A new Entry / Opportunity after REBOUNDDaily chart, the stock EGX:ARAB has been falling badly. The pattern is showing a possibility for 2 rebound levels: 0.352 and 0.326
Technical indicators:
RSI is near a BUY zone.
MACD is signalling a down movement.
So, a new entry should be after the clear rebound.
Be careful with this stock!
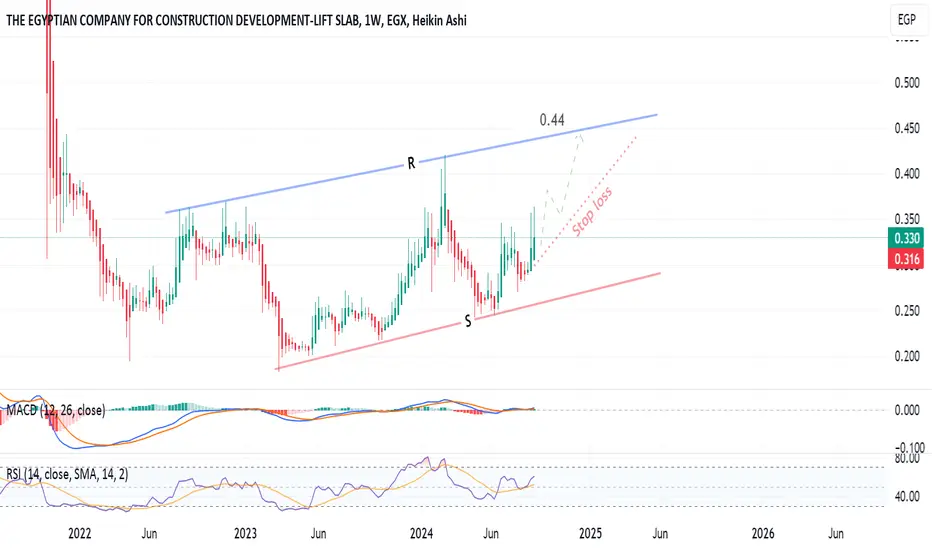
Lift Slab Egypt has a strong potential to hit resistance at 0.44Weekly chart, the stock EGX:EDBM is trading in a rising channel, and the technical indicators MACD and RSI are showing the strong potential to target the resistance line R at around 0.44
(Used Heikin Ashi candlesticks to remove noise)
Stop loss below 0.295 should be considered.
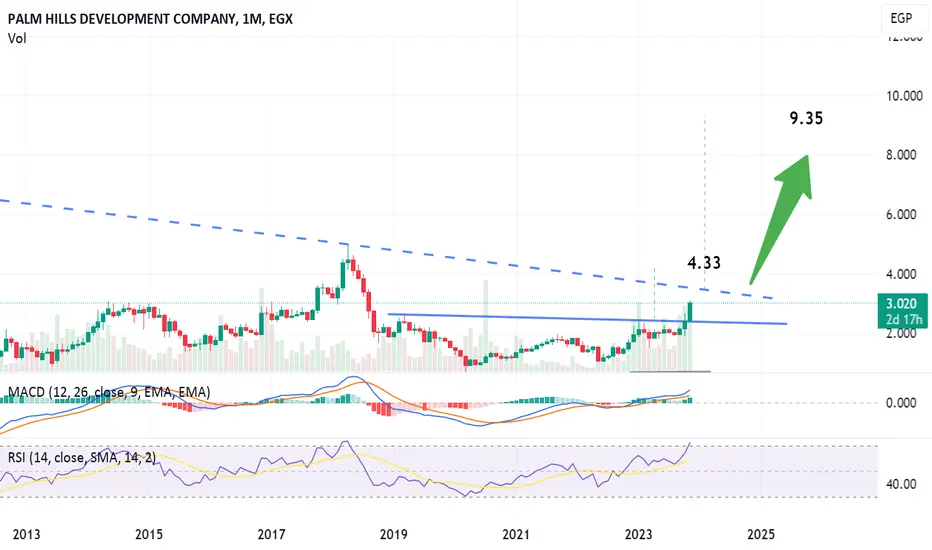
PHDC to target 4.33 after crossing 3.52Monthly chart,
PHDC targets 4.33 after crossing the resistance line at 3.52
A very long term target is 9.35 after crossing the 5.0 resistance (high of April 2018)
Stop loss 2.8 should be considered
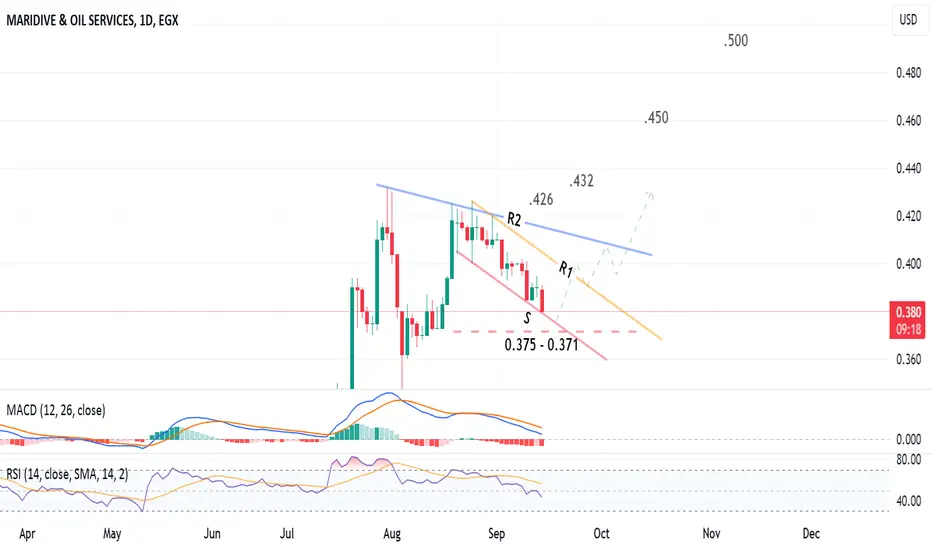
Maridive Egypt has a potential to rebound & target 0.432, 0.450Daily chart, the stock EGX:MOIL is trading in a flag chart pattern inside an expanding triangle.
I see the price has a high probability to rebound to resistance line R1 from the support zone 0.375 - 0.371, then the target will be blue line R2 (around 0.408 - 0.405)
Above R2, the targets are shown on chart.
Note: New entry should be after clear rebound.
Stop loss below 0.370 should be considered.
Sidi Kerir Egypt is preparing to go uptrendDaily chart, the stock EGX:SKPC has formed 2 patterns: symmetrical triangle and cup.
After crossing resistance line R around 30 - 31, the target will be 36 then 40
The technical indicators RSI and MACD on the weekly time-frame are signalling an uptrend.
Stop loss below 28 should be considered.

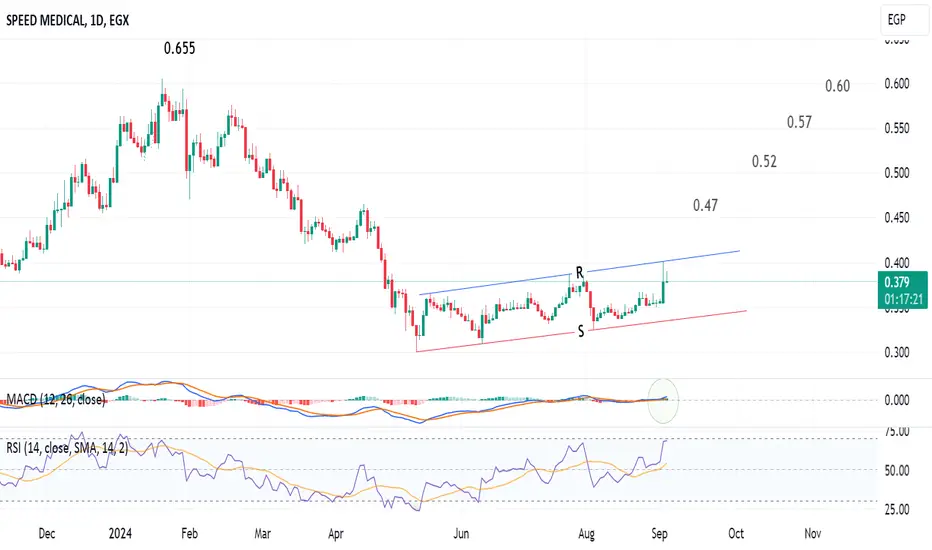
Speed Medical Egypt has a potential to 0.60Daily chart, the stock EGX:SPMD is trading in a rising channel, and the technical indicator MACD is positive.
I see the stock is preparing to break out the resistance (upper channel line R) to target 0.47
Trading above 0.47 for 2 days will activate the targets up to 0.60
Consider stop loss below 0.36
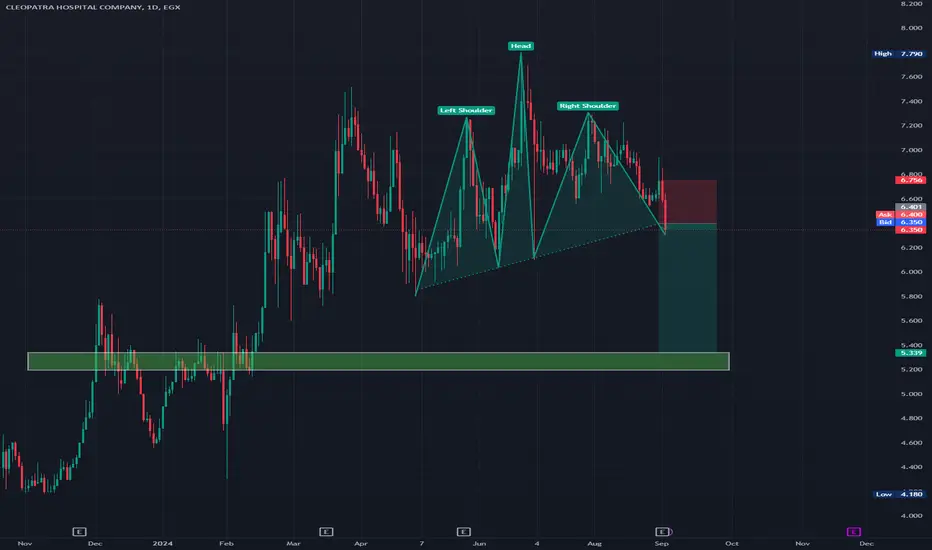
CLHO H&S Chart PatternCLHO created a head and shoulder Chart pattern, the target is the main volume resistance of the stock 5.4 range.
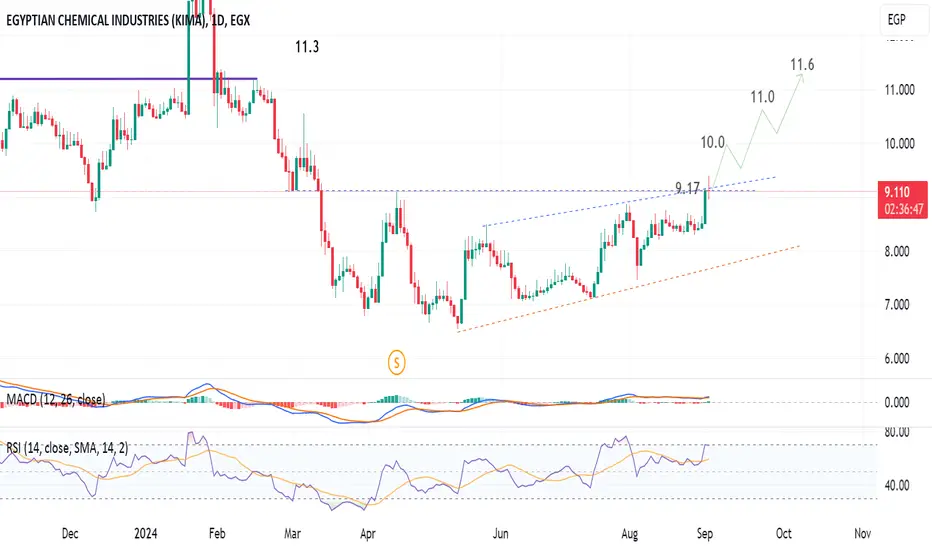
Kima Egypt should target 11Daily chart, the stock EGX:EGCH is preparing to cross the resistance zone 9.1 - 9.2
Trading above 9.2 for 2 days, the target will be 11 then 11.6 passing through a resistance zone at 10
MACD indicator is positive.
Stop loss below 8.8 should be considered.
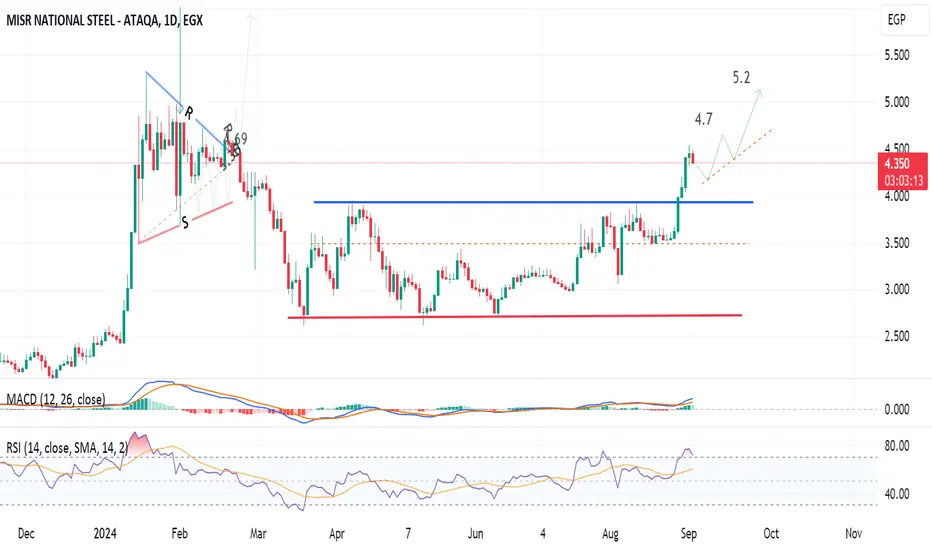
Ataqa should target 4.7 then 5.2Daily chart, after the breakout of the horizontal channel, the stock EGX:ATQA should have a pull-back, and prepare to continue upwards to target 4.7 then 5.2
The technical indicator MACD is positive.
Stop loss below 4.15
Egyptian Kuwaiti is preparing for a nice breakoutDaily chart, the stock EGX:EKHOA is drawing a chart pattern, where the targets up to 41 and 44 will be activated after crossing the resistance zone 31 - 32
The technical indicators RSI and MACD are supporting this view.
Consider a stop loss below 29.5 - 29

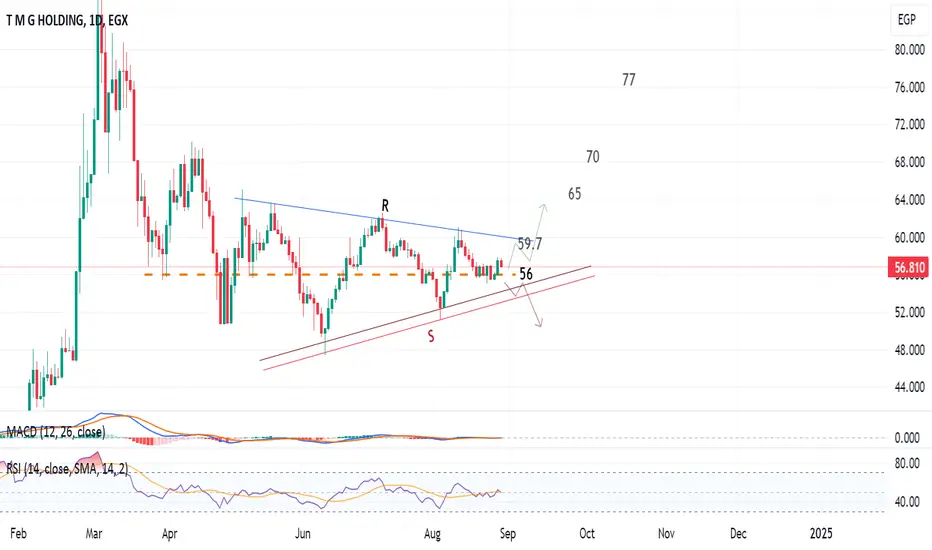
Talaat Mostafa TMG is challenging!Daily chart, the stock EGX:TMGH is trading in a symmetrical triangle (for the last 72 candles). The orange dashed line is pivotal - Above 56, the price will go up to test the upper triangle's edge. Otherwise, the price will test the lower edge.
Should consider a stop loss below 55
Technical indicators RSI and MACD are almost neutral.
So, direction should be confirmed first, for the new entry.
The targets are shown on the chart are after crossing the resistance line R, and trading above it with high volume for 2 days.
EKHO (Egypt) should rebound to 0.750 short-term1-hour chart, EGX:EKHO is trading in a falling wedge.
I am expecting a rebound from this zone 0.720 - 0.725
Closing for 3 hours above 0.725 will push the price to 0.750 passing through some resistance levels 0.732 , 0.740
Currently, the chart's technical Indicator RSI is inclined towards over-sold.
Stop loss below 0.720

Misr Fertilizers (MOPCO) has a potential to 54Weekly chart, the stock EGX:MFPC was pumped to the 70's then dropped sharply to 35.
It has started a rebound, expected to 51, then 54
Stabilizing for 2 weeks with high volume trading above 55, the target will be 66 - 68
Be careful, the stop loss should be considered as near as possible.

Dice, Egypt, should target 1.44 then 1.69Weekly chart, the stock formed a chart pattern, the target is 1.44 then after crossing 1.50, the next target will be 1.69
Dynamic profit protection level should be considered as the price increases.

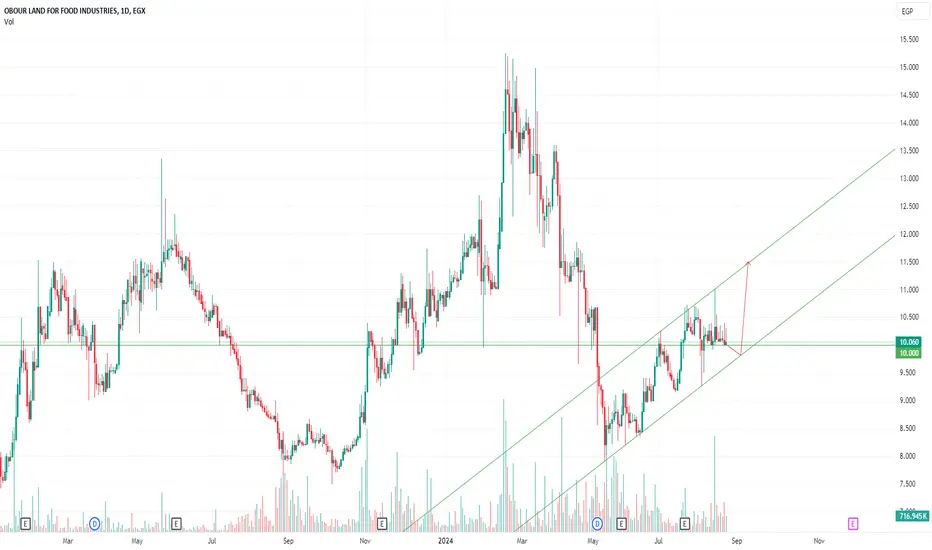
OLFI fair price and up potential For a considerable time, OFLI has maintained a level of 10.00 pounds. The company is projected to achieve remarkable revenue by the end of this year, and the material costs are now at a fair price, including milk powder and palm oil. The stock is not highly volatile, which suggests it could be suitable for medium-term traders. Consider buying around 10:00 or 9:80, with targets of 11:5, 15, 20 for short, medium, and long-term investments. Exercise caution as the overall market may undergo a correction, particularly as the pound strengthens against the USD, which typically leads to a short-term weakness in stocks. Begin to build positions, for instance, 10% of your portfolio, and buy gradually on daily dips of 20%.
**As usual, this is not financial advice to buy or sell.**