PHDC outlook 10-7-24Daily Analysis of PHDC based on Ichimoku, Law of diminshing returns, FIB EXT, BB, and others

EGX 33 daily analysis (10/7/2024)Analysis of the index using ichimoku kinko hyo, fib retracement, & Law of Diminishing Return.

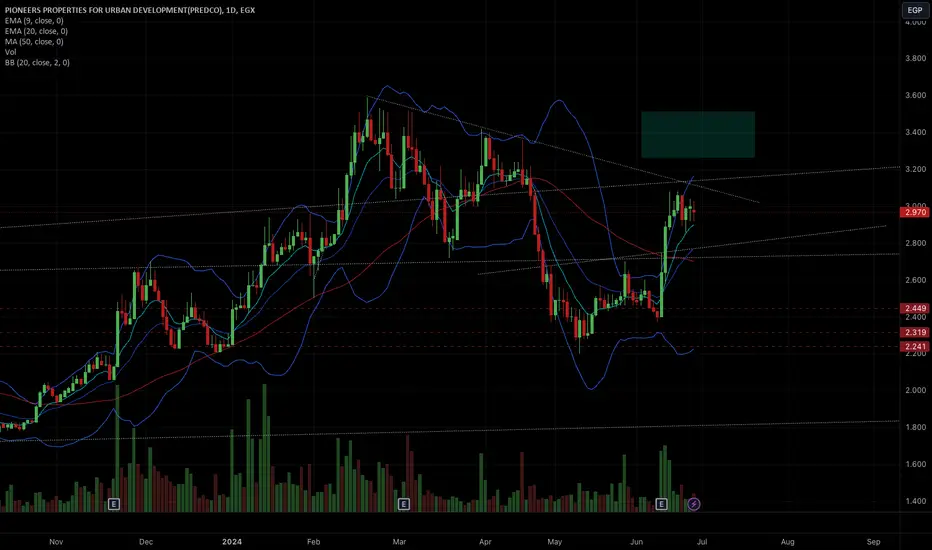
PRDC is relentless - Consolidation after an impulsive move with a resistance around 3.08
- Breakout from this level can send it to 3.20 - 3.30 (3.40 or higher if the market keeps its momentum)
- find a good entry and set a stoploss with a good R:R.
-Size only to your comfort level because its all mere probability.
Abuk Jinny Gann Grid + LevelsJinny Gann Grid & Levels are on the Chart
Jinny Gann Grid/Horizontal Lines Works as Support / Resistance.
Important levels for the Big Cycle on the chart.
Please Make sure u need to zoom in to Present to see a good picture of Important Support/Resistance
Crosses Near the price The green trend and the Red.. Expect a Reversal at the Exact point with High Probabilities.
Every line on Chart was Drawn Based on Equations... not Manually
My Theories... Implemented it to Jinny GANN R
Best Regards
Trade Wisely.
Buy ISPH @2.8 ISPH has up potential
Buy @2.8 with target 3.6
Do not buy more than 10% of your account
medium term opportunity
the above is not a buying advise

SWDYanalysis performed using the following strategies and indicators:
Ichimoku Kinko Hyo
Law of diminishing returns
Volume price trend
Relative Strength Index (RSI)
Average True Range (ATR)
Linear Regression

EGALanalysis performed using the following strategies and indicators:
Ichimoku Kinko Hyo
Law of diminishing returns
Volume price trend
Relative Strength Index (RSI)
Average True Range (ATR)
Linear Regression

ORHDanalysis performed using the following strategies and indicators:
Law of diminishing returns
Volume price trend
Relative Strength Index (RSI)
Average True Range (ATR)
Linear Regression

TAQAanalysis performed using the following strategies and indicators:
Law of diminishing returns
Volume price trend
Relative Strength Index (RSI)
Average True Range (ATR)
Linear Regression

ABUKanalysis performed using the following strategies and indicators:
Law of diminishing returns
Volume price trend
Relative Strength Index (RSI)
Average True Range (ATR)
Linear Regression

FWRYanalysis performed using the following strategies and indicators:
Ichimoku Kinko Hyo
Law of diminishing returns
Volume price trend
Relative Strength Index (RSI)
Average True Range (ATR)
Linear Regression

TMGHanalysis performed using the following strategies and indicators:
Ichimoku Kinko Hyo
Law of diminishing returns
Volume price trend
Relative Strength Index (RSI)
Average True Range (ATR)
Linear Regression

CCAP
analysis performed using the following strategies and indicators:
Ichimoku Kinko Hyo
Law of diminishing returns
Volume price trend
Relative Strength Index (RSI)
Average True Range (ATR)
Linear Regression

Analysis of Shariaa index, ADIB, MFPC, TALM, & ISPHanalysis performed using the following strategies and indicators:
Ichimoku Kinko Hyo
Law of diminishing returns
Volume price trend
Relative Strength Index (RSI)
Average True Range (ATR)
Linear Regression

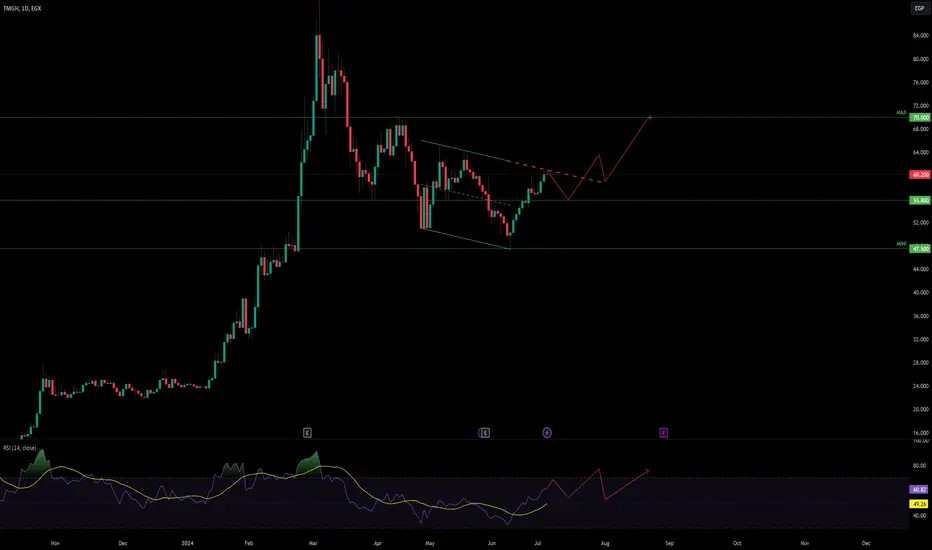
TMGH 25% up potential I would recommend entry point to be around 55 EGP and target is 70 EGP.
TMGH will achieve significant revenue and net profit this year.
may the have to adjust cash flow.
do not trade above 10% of your account at price 55
if price fail we will buy at 50 EGP 10 %
stop loss is below 47 EGP
this is not advice to trade :)
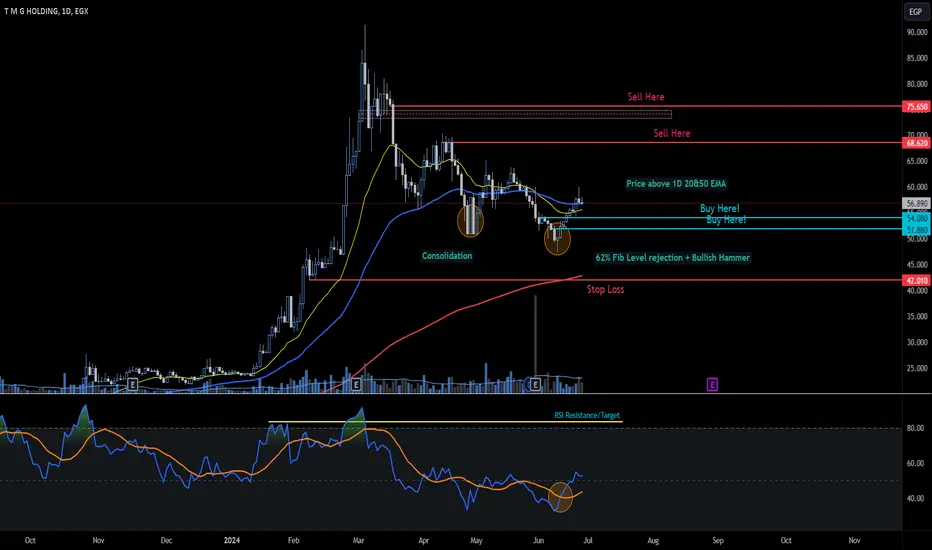
Talaat Mostafa Group Stock, only higher.
For those interested in the Egyptian Stock Exchange market, here's a technical analysis of Talaat Mostafa Group's stock. I recommend placing two buy limit orders and two sell limit orders for quick profits. In the long run, the stock is expected to reach higher levels. The fundamentals also support an upward move due to the inauguration of the new Southeast project next Sunday.
OIH Important Levels Long TermHello Dear Traders,
Wish you a good Day,
on The chart important Levels "Horizontal levels" Based on Gann sq9 Works as Support/Resistance
Watch for Price action around those levels.
also there are gann fan the green/Yellow trends works as close as Trendlines in your regular Classic analysis.
Trade around the levels and be as close as possible to take action around it.
Produced by Jinny Gann Ar.
Best Regards

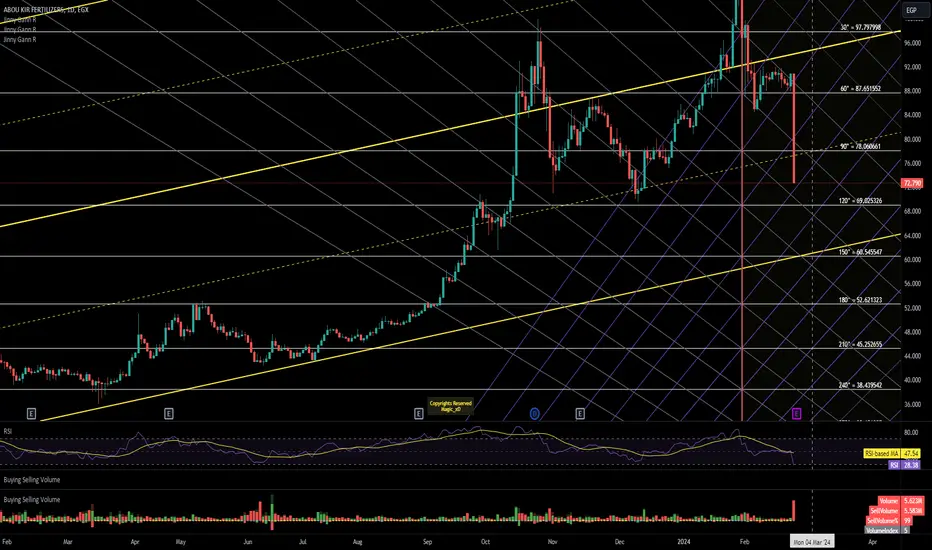
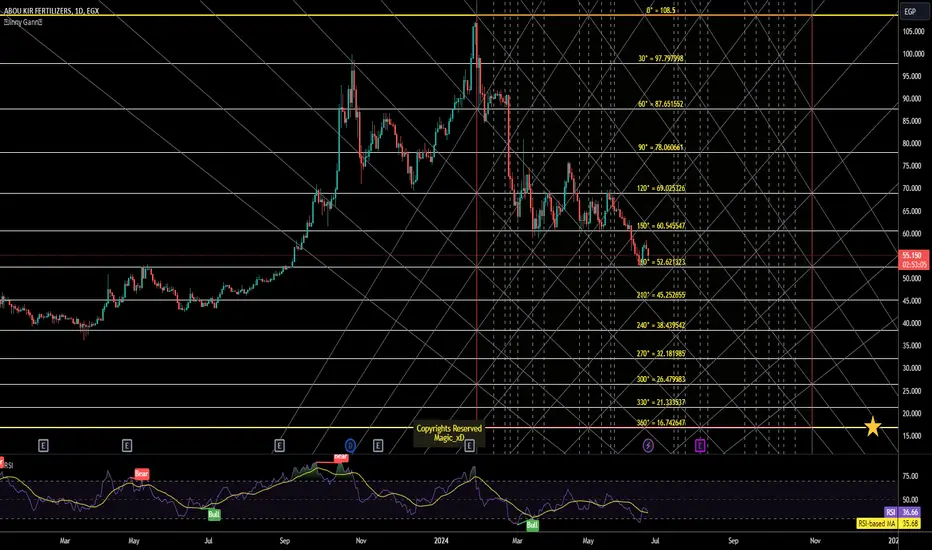
Abuk Important LevelsHello Dear Traders,
- Important Levels
On the Chart "Horizontal Lines" Based on Gann Square of 9
Works as Support/Resistance. Watch for Price action around those levels
- Jinny Gann Grid
- Vertical lines works as time lines. Expect Reversal around them.
For 25-6-2024
Support : 52.62
Resistance :58.5 then 60.54
Wish you Good Luck Trading.
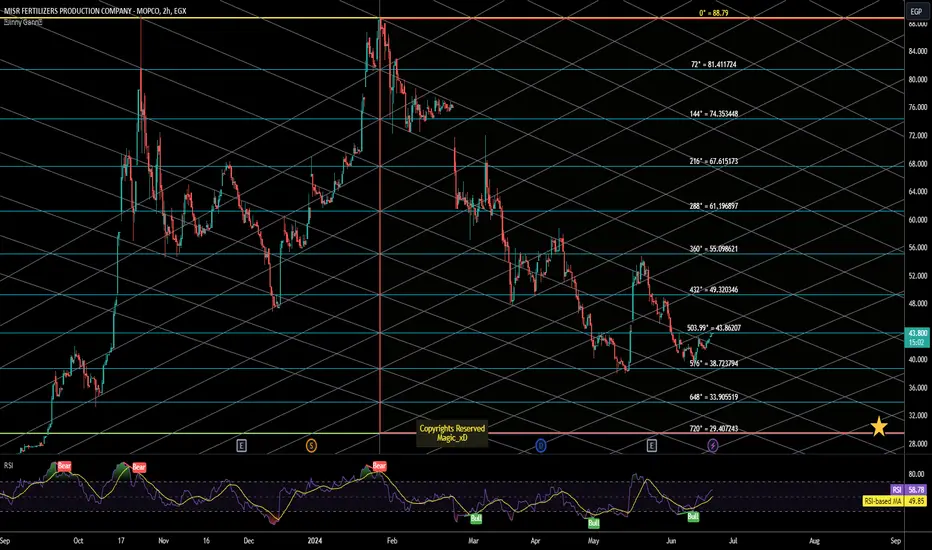
Mfpc Advanced Jinny Gann GridHello Dear Traders,
Wish you a good Day,
on The chart important Levels "Horizontal levels" Based Works as Support/Resistance
Watch for Price action around those levels.
also there are Jinny Gann grid the gray trends works as close as Channels in your regular Classic analysis.
Trade around the levels and be as close as possible to take action around it.
Produced by Jinny Gann Ar.
Best Regards
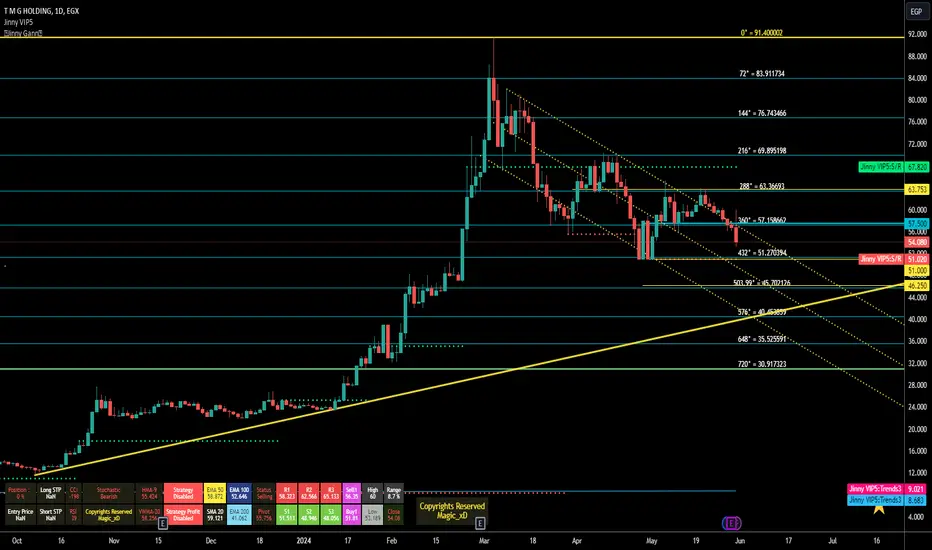
TmghHello Dear Traders,
Tmgh Important Levels on the chart (Jinny Gann square of 9 levels)
Treat it as Support/Resistance .
Main Up Trend-Line (Yellow Trend)
Current Support 51.27 - 51.0
was Pivot/Resistance : 57
Down-Trend Channel Plotted on The chart.
Cci levels -198 Indicating over Sold levels.
Rsi is 39 Near Support "Near over sold" Usually around 30
Table in the Bottom left corner has some important Data .
Updating old Chart by More levels
and Jinny Gann Grid
Wish you Best of luck Trading.
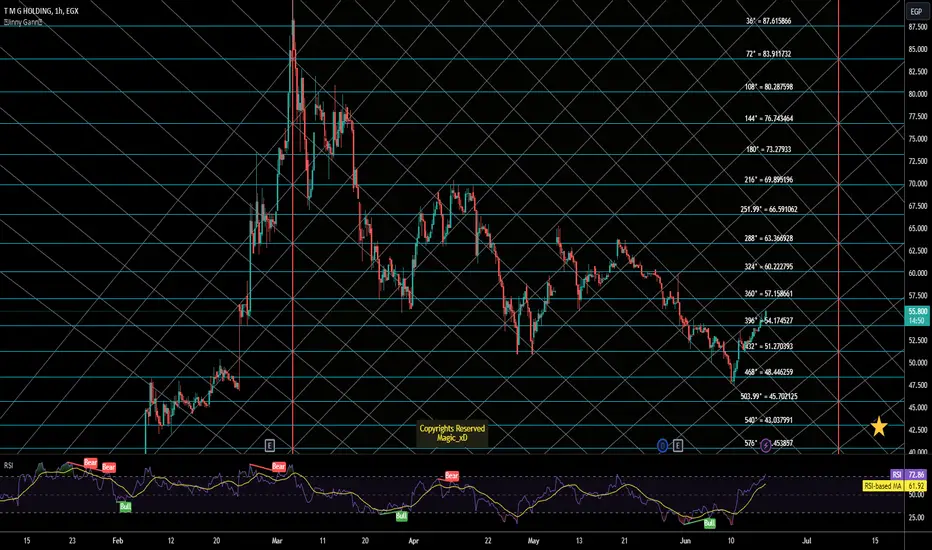
Tmgh Important LevelsHello Dear Traders,
Tmgh Important Levels on the chart (Jinny Gann square of 9 levels)
Treat it as Support/Resistance .
Main Up Trend-Line (Yellow Trend)
Current Support 51.27 - 51.0
was Pivot/Resistance : 57
Down-Trend Channel Plotted on The chart.
Cci levels -198 Indicating over Sold levels.
Rsi is 39 Near Support "Near over sold" Usually around 30
Table in the Bottom left corner has some important Data .
Wish you Best of luck Trading.
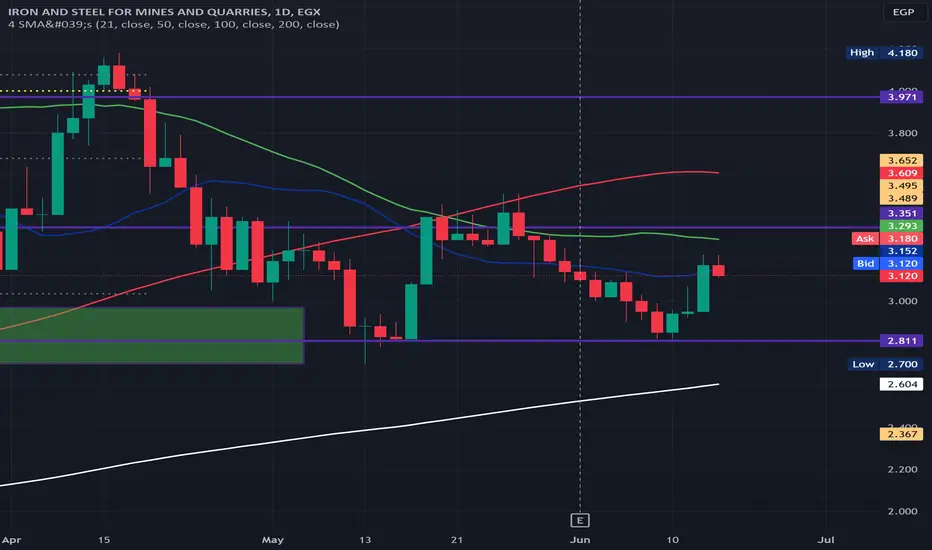
Iron and Steel for mines and quarries: : A Promising Opportunity
The stock exhibits several promising signals:
-Relative Strength Index crosses 50
Moving Average Convergence Divergence crosses signal line
Volume above Moving Average, except last day,
over the 200-day Moving Average
Touched the resistance level of 2.811 twice, forming a double bottom
Factors to monitor:
last day correction, it may test the 61.8% level at a stock price of 3
The stock price is at resistance, of the 50-day Moving Average
It will encounter very strong resistance at 3.41
Arabia Investments: A Promising Opportunity
The stock exhibits several promising signals:
- RSI has crossed the 50-line, indicating potential buying momentum
- MACD has crossed its signal line, hinting at a bullish trend
- Trading volume has surpassed the moving average, suggesting increased market activity
- The stock has gained ground for 2 consecutive weeks, outperforming the 200-day moving average
Market structure analysis reveals:
- The stock has touched the 150% Fibonacci level twice, forming a double bottom pattern.
Factors to monitor:
- An upcoming stock split on May 24th
- The stock is currently trading at a strong resistance level, with the 21-day moving average providing support
- The stock is expected to face significant resistance at the 0.6 and 50-day moving average levels
- A potential test of the 0.634 price could signal a very strong resistance zone
