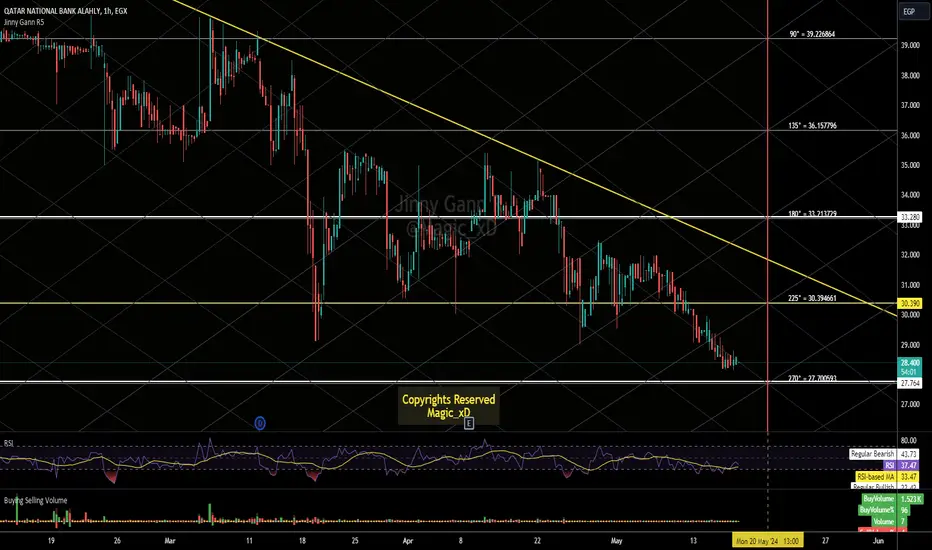
Qnba Important levelsHello Dear Traders,
Wish you a good Day,
on The chart important Levels "Horizontal levels" Based on Gann sq9 Works as Support/Resistance
Watch for Price action around those levels.
also there are gann grid the green/red trends works as close as Channels in your regular Classic analysis.
Trade around the levels and be as close as possible to take action around it.
Produced by Jinny Gann Ar.
Best Regards
EGX33: A Faith-Focused ApproachNavigating the Complexities of Sharia-Compliant Stock Trading: A Faith-Focused Approach
The index is composed of 33 stocks: 17 from EGX30 and the remaining from EGX70EWI. Determining the correlation coefficient of the index is challenging as it's unclear whether it pertains more to EGX30 or EGX70EWI. Unfortunately, the EGX authorities haven't disclosed the weight of the components, the members of the sharia advisory board, or the sharia criteria for inclusion and the frequency of reviewing the sharia index to ensure the sustainability of its components.
In the meantime, three brokerage firms have independently published their lists of sharia-compliant stocks. While these lists contradict each other, there are some areas of overlap. Notably, the EGX33 has added new sharia-compliant stocks that were excluded by the other three sharia lists. This has led to confusion regarding sharia-compliant stocks and sparked discussions about righteousness.
Despite the complexities surrounding the indexes and various lists, the primary focus remains on trading sharia-compliant securities while adhering to personal faith.

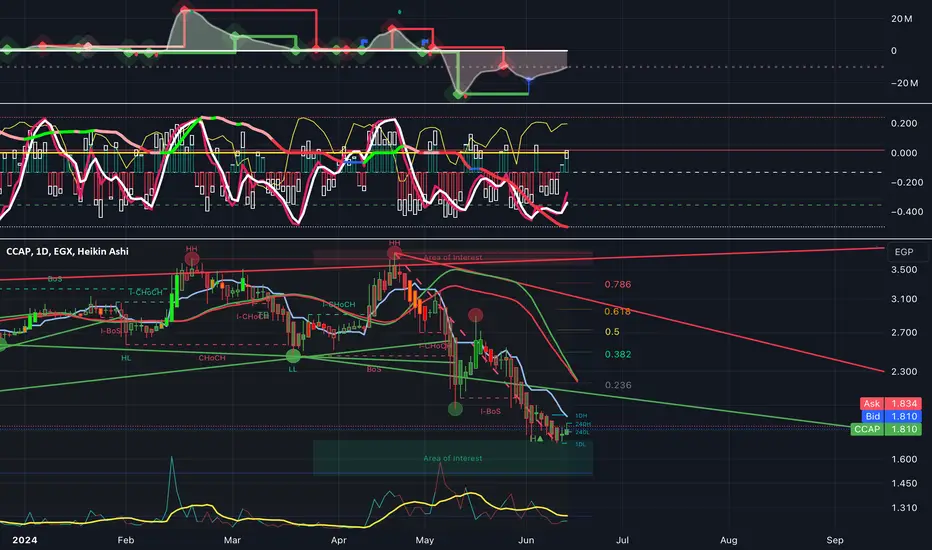
CCAP: negative trendThe CCAP analysis indicates a prevailing negative trend, with the stock price significantly below its moving averages and clear bearish signals from the MACD and RSI indices. Volumes are also notably down, reinforcing a lack of buying interest. However, there is a potential support zone around the 2.25 mark, which could provide some stability. For tomorrow, the outlook remains bearish unless there is a surprising influx of positive news or increased buying volume to support a reversal.
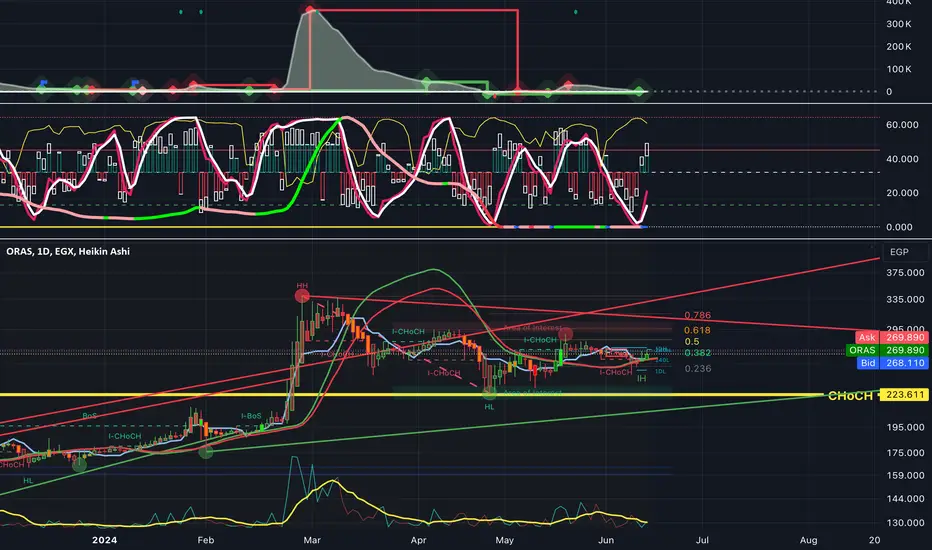
ORAS: Triangle Pattern Suggests Potential Breakout
ORAS: Triangle Pattern Suggests Potential Breakout
The chart reveals a symmetrical triangle pattern, signified by the converging trendlines. This pattern suggests a potential breakout, but the direction—upward or downward—is uncertain. The VPT indicator shows a potential positive divergence which might indicate an upcoming bullish move. However, the Efforts vs Results indicator shows mixed signals, suggesting caution. The fibonacci levels, particularly the 0.618 level, are critical as they can either act as a strong resistance or support. Monitoring volume and price action near pivotal Fibonacci levels and trendlines will be crucial to anticipate the next move. Conversely, a breakdown below the lower trendline might indicate a bearish continuation. Keep an eye on the price levels and volume for confirmation.
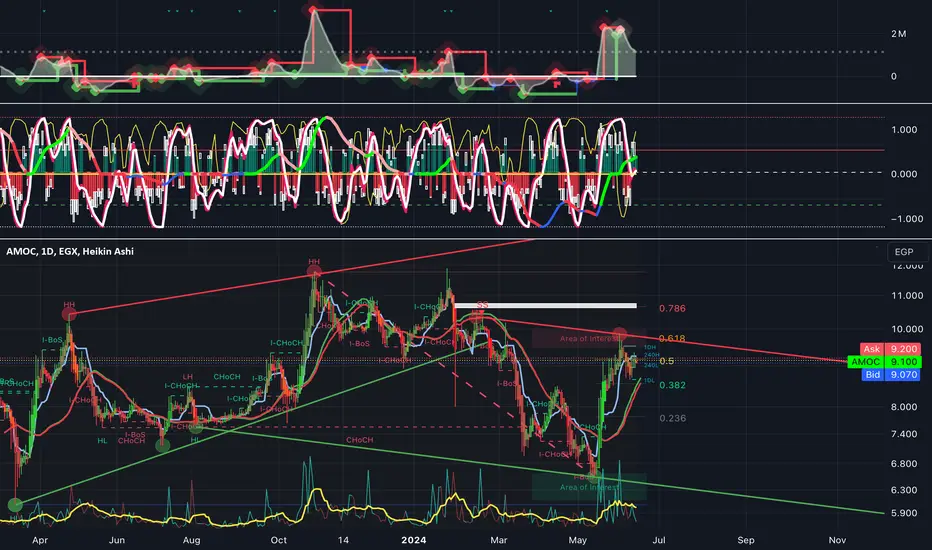
Comprehensive Technical Analysis and Outlook for AMOC Stock
The AMOC stock chart presents a detailed technical analysis using various indicators and overlays. At the top, the Volume Price Trend (VPT) indicator highlights cumulative volume adjusted for price changes, indicating significant buying and selling pressures through its peaks and troughs. The Efforts vs. Results indicator below shows the relationship between volume and price movements, where oscillations and crossovers can signal potential trend reversals or continuations.
The main price chart, which uses Heikin Ashi candles, shows a slight decline to 9.138 EGP (-0.55%). The chart also includes a Moving Average (MA9) to identify short-term trends, and volume is displayed at the bottom to gauge trading activity. The stock has experienced fluctuations, with notable upward movements but currently facing resistance around the 9.2 EGP level.
Key levels of support and resistance can be inferred from the chart’s price actions and volume. The stock has been in a consolidation phase, with the price oscillating between support at approximately 8.5 EGP and resistance around 9.2 EGP. The recent price movements suggest a potential continuation of this range unless a breakout occurs.
Detailed Analysis
1. Volume Price Trend (VPT):
• The VPT indicator shows significant buying and selling pressures. Peaks in the VPT correspond to strong buying activity, while troughs indicate selling pressures.
• Currently, the VPT is relatively stable, suggesting a balance between buyers and sellers.
2. Efforts vs. Results:
• This indicator highlights the relationship between volume and price movements. Oscillations and crossovers can signal changes in market sentiment.
• The recent oscillations suggest uncertainty, with no clear trend dominance.
3. Heikin Ashi Candles:
• These candles provide a smoothed representation of price movements, filtering out market noise.
• The recent candles show a mixed sentiment with small-bodied candles, indicating indecision among traders.
4. Moving Average (MA9):
• The MA9 provides insight into short-term trends.
• The stock is currently fluctuating around the MA9, indicating a lack of strong short-term momentum.
5. Support and Resistance Levels:
• The stock is facing resistance at 9.2 EGP. If it breaks this level with increased volume, it could signal a bullish trend.
• Support is around 8.5 EGP. If the stock falls below this level, it could signal a bearish trend.
Outlook for Tomorrow
For tomorrow’s trading session, the immediate outlook for AMOC stock suggests caution. The stock is at a critical resistance level of 9.2 EGP. If it breaks above this level with increased trading volume, it could signal the start of a more substantial upward move. However, if it fails to break this level and instead moves downward, it may retest the support level around 8.5 EGP.
Recommendation for Investors Holding from 9.5 EGP
Investors who bought AMOC at around 9.5 EGP are currently at a slight loss. Here are some recommendations:
• Short-Term Strategy: If the stock breaks above 9.2 EGP with strong volume, consider holding as it might signal further gains. Set a stop-loss just below the 9.0 EGP level to minimize potential losses.
• Long-Term Strategy: If you believe in the long-term potential of AMOC, consider holding the stock. Monitor key support levels, especially around 8.5 EGP. If the stock falls below this level, consider selling to limit further losses.
• Risk Management: Use stop-loss orders to protect your investment. A stop-loss just below the 8.5 EGP support level can help limit losses if the stock continues to decline.
Overall, closely monitoring the volume and price action, as well as market news and sentiment, will be crucial for making informed decisions.
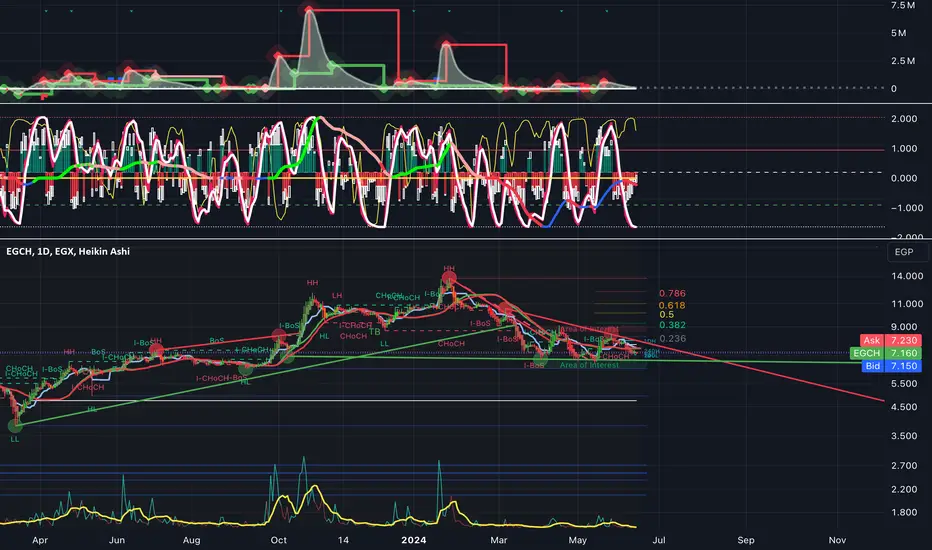
Comprehensive Technical Analysis and Outlook for KIMA StockThe KIMA stock chart presents a comprehensive technical analysis with several indicators and overlays. At the top, the Volume Price Trend (VPT) indicator highlights cumulative volume adjusted for price changes, reflecting significant buying and selling pressures through its peaks and troughs. The Efforts vs. Results indicator below demonstrates the relationship between volume and price movements, where oscillations and crossovers can signal potential reversals or trend continuations.
The main price chart, which uses Heikin Ashi candles, shows a slight increase to 7.158 EGP (+0.42%). It includes a Moving Average (MA9) to identify short-term trends, and volume is shown at the bottom to gauge trading activity. The light line on the price chart represents the Tenkan-sen from the Ichimoku cloud, which provides insight into short-term momentum and trend direction.
The chart also features Fibonacci retracement levels, marking significant support and resistance levels at 0.236, 0.382, 0.5, 0.618, and 0.786. These levels help identify potential areas where the price might reverse or consolidate. Trendlines indicate a persistent downward trend since late 2023, with lower highs confirming the bearish sentiment.
For tomorrow’s outlook, the stock is at a critical juncture near the 7 EGP support level. If this level holds and the volume increases, we could see a potential reversal or bounce-back, especially if it breaks above the 7.5 EGP resistance level. However, if the stock falls below 7 EGP with increased selling volume, further declines could be expected, with the next support level likely around 6.5 EGP.
For investors who bought at 8.5 EGP, the situation is more delicate. If the stock begins to recover and surpasses the 7.5 EGP mark, holding on might be beneficial. However, if the downward trend continues, it would be wise to set stop-loss orders to limit further losses. Monitoring the key Fibonacci levels, trendlines, and volume trends will be crucial for making informed decisions.
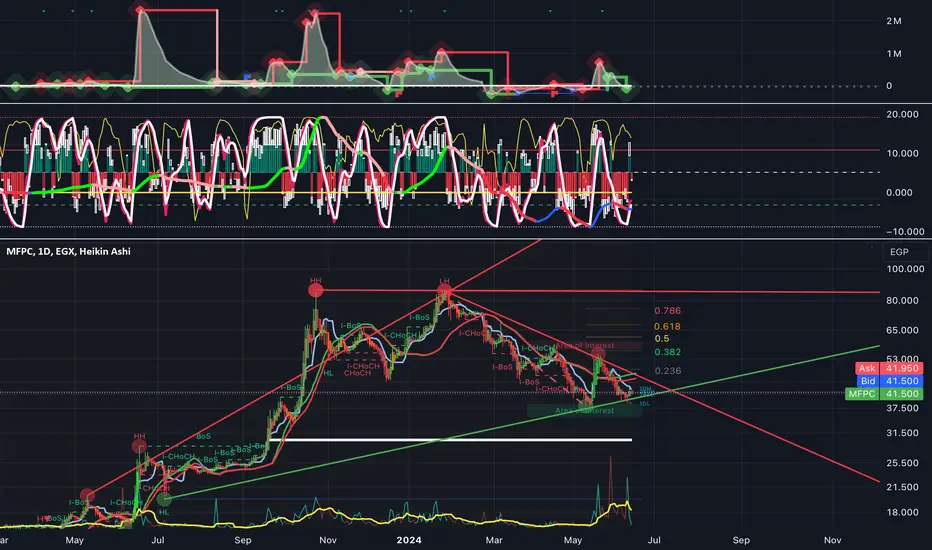
Analysis of MFPC Stock with Outlook
The MFPC stock chart presents a detailed technical analysis using various indicators and overlays. The Volume Price Trend (VPT) indicator at the top shows cumulative volume adjusted for price changes, revealing significant buying and selling pressure through its peaks and troughs. The Efforts vs. Results indicator below highlights the relationship between volume and price movements, where oscillations and crossovers can signal potential reversals or trend continuations.
The main price chart, which uses Heikin Ashi candles, smooths out price action to make trends more apparent. Green lines indicate rising trends, while red lines denote downtrends. The stock is currently trading at 41.870 EGP, reflecting a slight decline of 1.19%. The chart also includes a Moving Average (MA 9) for short-term trend identification and a volume line indicating the traded volume during each period.
Annotated on the chart are key price levels and patterns, such as Higher Highs (HH) and Lower Highs (LH), which signal trend reversals. Labels like Break of Structure (BoS) and Change of Character (CHoCH) mark significant shifts in market structure. Fibonacci retracement levels (0.236, 0.382, 0.5, 0.618, 0.786) are drawn to identify potential support and resistance levels.
Outlook for Tomorrow
For tomorrow’s trading session, the immediate outlook for MFPC stock suggests cautious optimism. The stock is near a key support level around 41 EGP, which it has tested and held multiple times. If the support level continues to hold and the volume increases, there could be a potential reversal or a bounce-back. Traders should watch for a break above the 43 EGP level, which would indicate the beginning of a recovery phase. Conversely, if the stock breaks below 41 EGP with increased selling volume, further declines could be expected, with the next support level possibly around 38 EGP.
Advice for Investors Who Bought Around 50 EGP
Investors who bought MFPC around 50 EGP are currently facing a significant unrealized loss. For these investors, the key is to closely monitor the support and resistance levels mentioned. If the stock begins to show signs of recovery and breaks above 43 EGP, it might be worth holding on to the stock for a potential further recovery. However, if the downward trend continues and the stock breaks below 41 EGP, investors might consider setting stop-loss orders to limit further losses. Long-term investors should also consider the company’s fundamentals and any upcoming news or earnings reports that could impact the stock’s performance.
In summary, while the MFPC stock is in a downtrend, the support at 41 EGP and volume trends provide a glimmer of hope for a reversal. Tomorrow’s session could be crucial, and investors should stay vigilant, particularly those who bought at higher levels around 50 EGP.
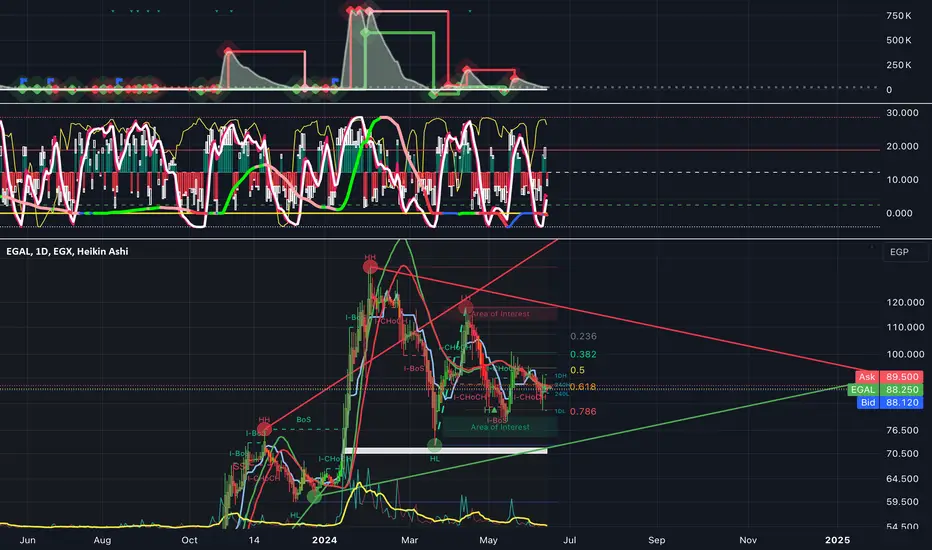
EGAL: Bearish Continuation with Potential DownsideThe EGAL stock, analyzed using Heikin Ashi candles, reveals the formation of a descending triangle pattern. This pattern is characterized by a descending resistance line and a relatively stable support base around the 0.786 Fibonacci retracement level, indicating potential bearish continuation.
- **Heikin Ashi Candles:** Indicate a prevailing bearish momentum.
- **Volume Price Trend (VPT):** Shows declining volume during upward movements, suggesting weakening buying pressure.
- **Effort vs. Results Indicator:** Significant effort does not correspond to expected price gains, indicating market inefficiency and a lack of robust buying support.
If the stock fails to break above the descending resistance line, particularly with notable volume, it suggests the likelihood of downward movement. A breach below the support line could lead to further declines, potentially targeting levels around 81 EGP or lower. Conversely, a breakout above the resistance line with strong volume could indicate a bullish reversal, though current indicators lean towards a bearish outlook.
**Outlook for Intraday Traders:**
- **Bearish Scenario:** If the stock remains below the descending resistance line, intraday traders should consider short positions if it approaches the current support level, targeting a drop towards 81 EGP or lower.
- **Bullish Scenario:** If the stock breaks above the resistance line with significant volume, consider long positions, targeting the 110-115 EGP zone.
**Outlook for Weekly Traders:**
- **Bearish Scenario:** Monitor the stock for a potential breakdown below the current support level. A move towards 81 EGP or lower could present short-selling opportunities.
- **Bullish Scenario:** Look for a decisive breakout above the resistance line. Sustained movement upwards with volume could indicate potential gains towards the 110-115 EGP range.
**Recommendation for Current Holders (around 100 EGP):**
- **Primary Recommendation:** Given the existing bearish indicators, consider setting a stop-loss near the current support level to mitigate potential losses.
- **Secondary Recommendation:** If the stock breaks above the descending resistance line with strong volume, it might be prudent to hold for potential gains, targeting the 110-115 EGP zone.
CONCLUSION:
The overall sentiment for EGAL stock remains bearish unless a strong breakout above the descending triangle's resistance line is established with substantial volume. Failure to maintain the support could confirm the descending triangle with a downside target revisiting lows around the 81 EGP level or lower.
CIRA is waiting for a bullish market- Probably the best looking chart at the moment in the market.
- market needs to be bullish for this trade to work.
- its hanging now around a good R:R.
- We have a gap on the monthly around the 16.40. Once we break the 14 area, we may get an impulsive move towards the gap.

Ecap long term levelsHello dear traders
On the Chart important gann levels for the up cycle from the low of 7.08
To current top 38.80
Current support is around 17.31
Pivot is 18.8
Resistance levels above the price.
Horizontal lines are considered Support/Resistance wait for price action around these levels
Vertical lines are time lines important to watch for reversal around those dates.
Jinny gann fans .
Wish you best of luck trading.

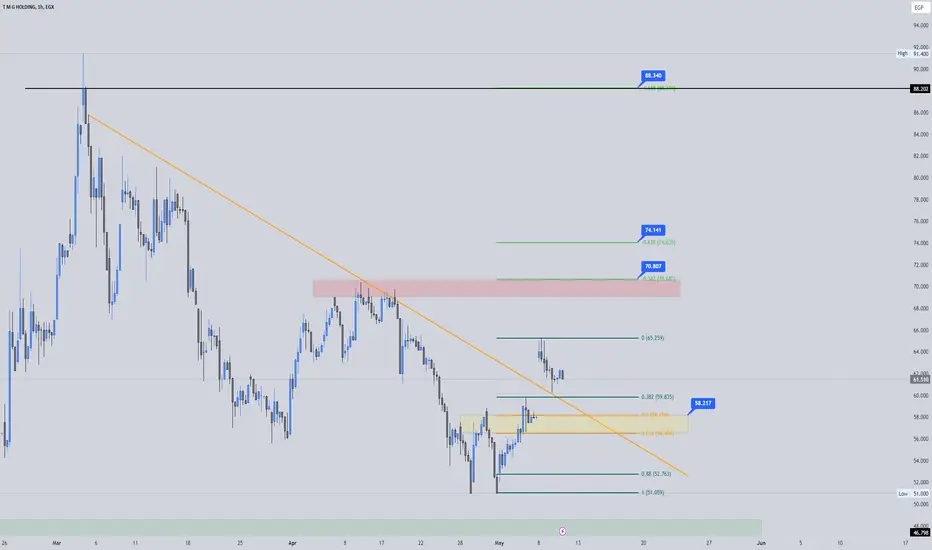
King Tut's Ascendancy: The Triumphant Tale of TMGHBeneath the gaze of King Tut, the victorious pharaoh, the destiny of TMGH's stock unravels like an ancient prophecy. Currently priced at EGP 51.80, the stock finds itself ensnared in a downward trend, yet whispers of potential reversal echo through the markets. Much like Tutankhamun reclaiming his throne, TMGH teeters on the brink of resurgence. The 24-day and 18-day moving averages loom above as formidable barriers, casting bearish shadows over the short-term outlook. Yet, as the price flirts with the lower Bollinger Band, it suggests oversold conditions—ready for a regal rebound.
The Ichimoku Cloud foretells a grim narrative with the price decidedly below its mists, signaling ongoing bearish sentiment. However, like the youthful king's surprise ascendancy, the RSI hints at an impending shift, currently entrenched in oversold territory below 30 and poised for a revolutionary upward correction. The MACD, while still echoing the murmurs of bearish momentum, shows signs of flattening—perhaps heralding a new dawn of consolidation or a reversal.
In the immediate term, during the next trading hour, TMGH's price could stage a rally, targeting resistance levels between EGP 52.00 and EGP 52.50, potentially climbing towards EGP 53.00 if bullish sentiment gains strength. Tomorrow, as King Tut leads the charge, the stock might continue to battle bearish forces, with key support levels anchoring at EGP 51.00 and EGP 50.50. Yet, should the pharaoh's favor shine, a bullish reversal could see TMGH surging past immediate resistance to scale the heights of EGP 53.50 and beyond, striving towards EGP 54.00. Under the watchful eye of King Tut, TMGH could re-establish itself, echoing the triumphs of ancient Egypt.

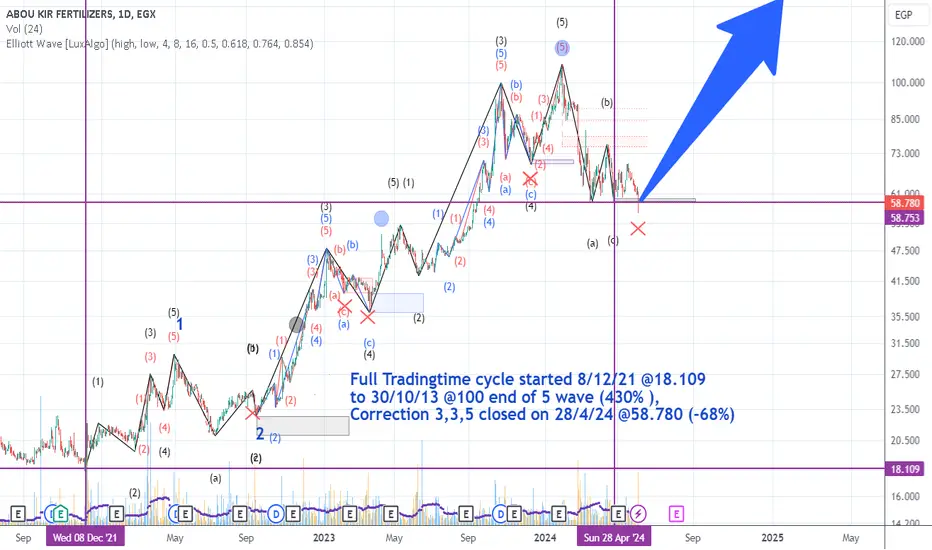
ABUKFull trading cycle started on 12/8/21 at 18.109, ending on 10/30/13 at 100 with a profit of 430%. The complete correction (3,3,5) closed on 4/28/24 at 58.780, resulting in a loss of 68%. A new trading cycle has begun.
Join us in investing in a first-class opportunity, capitalizing on the profit from the initial wave of Wave 1.
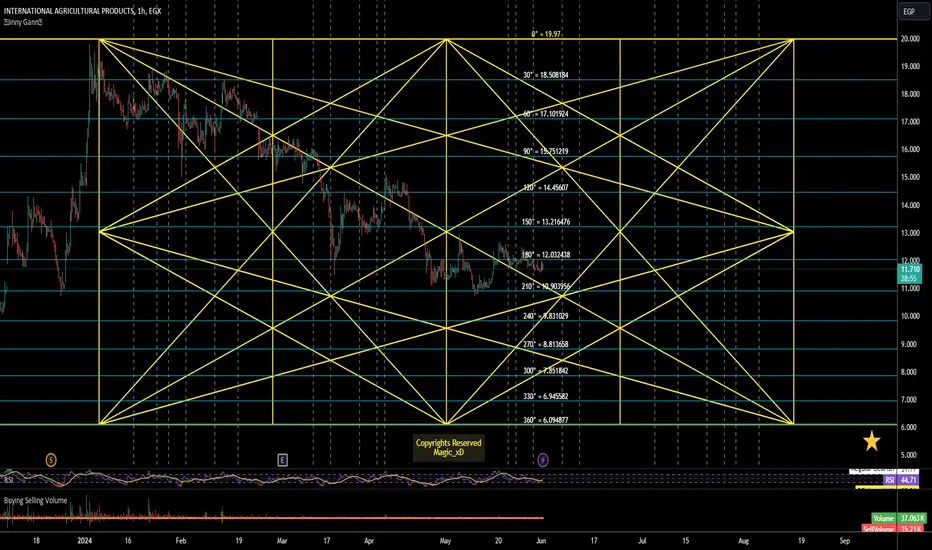
Ifap Gann Star - Gann Important LevelsHello Dear Traders.
Ifap Started a Downtrend from The top of 2024 @ 19.97
Horizontal lines are Support/Resistance, You should Watch Price action around these levels, and Take your Trades as close to these levels as possible.
on The chart Vertical lines that might Help you Expect the next reversal .
Big cycle bottom should be "6.07" Before the End of this Star.
Best of luck to you all.
RMDA Opportunities Exposure to "RMDA" stock
On testing the resistance at the 2.20 level, it rose to approximately 5%, and there are opportunities for growth during approximately the week’s session on the 2.5 test.
Bullish on TMGTMG have showed positive signals during the previous sets.
So, we are waiting it to correct backward to the golden zone, to get long with a but entry.
TP are marked with blue.
KIMA's performance remains mediocreKIMA's performance remains mediocre, struggling to gain traction at the 7.87 level. It's like Deportivo La Coruña during their relegation seasons. Despite having a talented player like Lucas Pérez, who showed great potential and skill, the team struggled significantly and faced relegation from La Liga. Pérez, while a strong individual performer, couldn't turn the tide for the team on his own, illustrating the challenge of a superstar player unable to secure victories for a faltering team
KIMA is like a team in the major league that just can't find its rhythm, akin to one of the worst teams in the Spanish football league, trying to score but failing to dribble past defenders.

Chicago Bulls Chart Play: EGAL's Bullish Setup Echoes 1999 ChampEGAL is in the golden zone, aiming for the 61% Fibonacci retracement, mirroring the EGX70EW. A bullish TK cross could emerge next week. The mid-point of the Bollinger Band rests at the 50% Fibonacci, with the upper band at the 61%. The 50% Fibonacci level is the current hurdle, and volume is diminishing.
We're poised for a rebound by Pippen, setting up a fast break to Jordan for a slam dunk, reminiscent of the Chicago Bulls' fiery championship final game in the 1999 season. Just like then, we're aiming to dominate and clinch the world championship!

Chart Victory: Bulls Charge as Heikin Ashi Signals Potential TK Chart Victory: Bulls Charge as Heikin Ashi Signals Potential TK Cross - A Win Like Mo Salah's Championship Goal!
Despite a positive outlook being challenged by the Kumo at 3.77, PHDC is on the verge of a bullish TK cross. Buyers showed tremendous interest at 3.73, evidenced by enormous volume in the last 15 minutes before the auction, which culminated in a supersonic finish. It's reminiscent of Hakeem Olajuwon and Michael Jordan slam dunking in the NBA championship. HOOOOORRRAy!

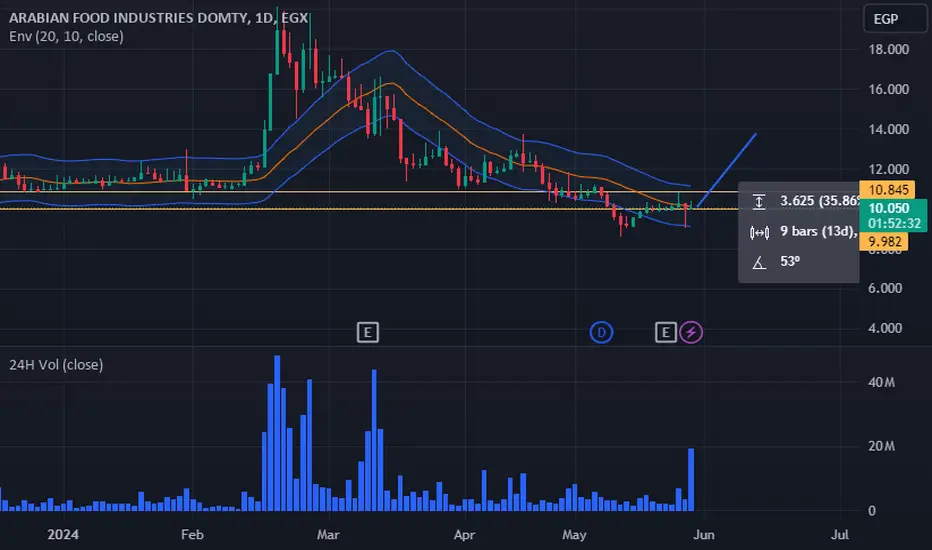
DOMT Betweenincrease "EPS" and increase in volumeOn a specialized economic level, after reviewing the financial statements for the first quarter of the stock, the increase in the number of shares was marginal (in the millions) and the increase in earnings per share was also by a fraction of a penny. However, on a technical analysis level of the volume, a state of stability and exchange of shares in large quantities ("accumulation") is evident without any increase in the stock price. In other words, the chart shows us that there are accumulation operations for a full session without including holidays, especially after the last cash dividend distribution from the stock. This operation makes us wait for a strong upward movement for the stock to return to the levels of 14 Egyptian pounds during June. The stock will recover, and it is a great opportunity to achieve no less than 20% on investing in this stock. This is not advice, but an analysis. I believe that the second quarter results will be higher because the month of Ramadan, which was between March and April, disrupts a large part of the revenue from Suntech Dmetty's sales. We will notice high semi-annual statements at a high rate.
Please note that this is a direct translation and does not include any additional information or interpretations
Egyptian Drug Authority and Pharmaceutical CompaniesEbeco Company is one of the leading pharmaceutical companies in Egypt, with a long history of manufacturing and exporting medicines. Over the past two years, the company has benefited from therapeutic supply contracts to African countries through the United Nations and the African Union, which has led to significant growth in its revenues and profits.
Negative Impacts:
However, the company has faced some challenges in the Egyptian market over the past seven months due to the implementation of maximum price caps for medicines by the Egyptian Drug Authority. This decision has particularly affected Ebeco, as most of its profitable medicines are antibiotics and cough syrups, which are categories of medicines that have been included in the price cap.
Positive Impacts:
Despite these challenges, Ebeco has been able to compensate for some of its losses by expanding its operations into Central African markets through international export companies.
Short-Term Outlook:
In the short term, Ebeco's share price is expected to move in a trading range between 32 and 48 Egyptian pounds. This is due to investors waiting for the Egyptian Drug Authority's approval of requests from pharmaceutical companies to raise their prices.
Future Scenarios:
In case of approval to raise prices:
Share prices of all pharmaceutical companies are expected to rise significantly, in line with the percentage allowed for price increases.
This will lead to an improvement in Ebeco's financial performance and attract more investors to the stock.
In case of rejection by the Egyptian Drug Authority of requests to raise prices:
The scenario of a decline in the share price and a continued trading range is likely to continue until a new development occurs.
The company may face further challenges in the Egyptian market, which could negatively impact its financial performance.

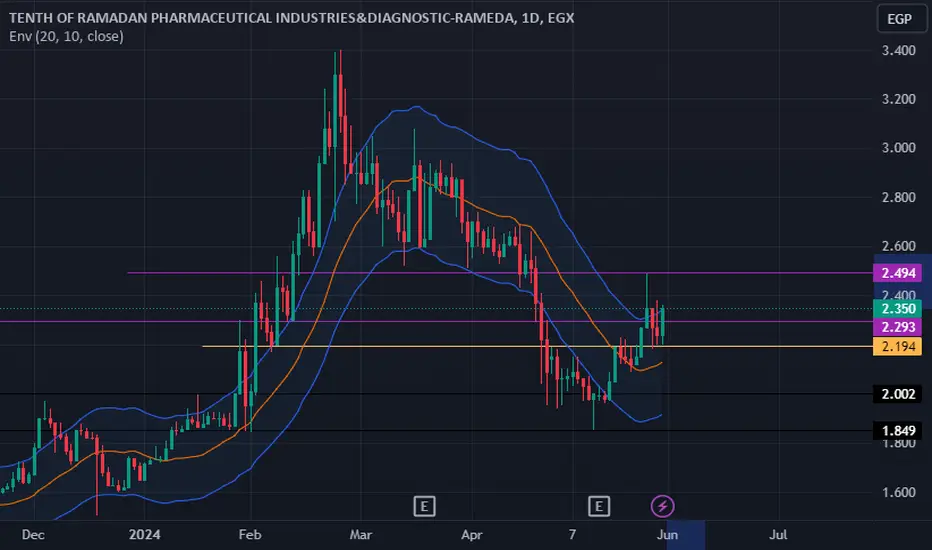
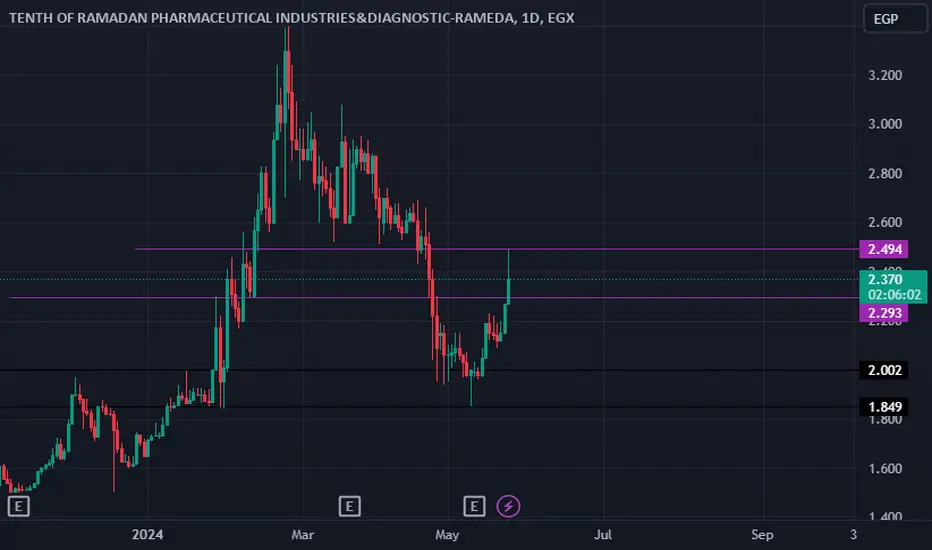
RMDA faces strong resistance at 2.5The chart shows strong resistance for Monday at the 2.5 level that cannot be broken, and there is a lack of desire from the market maker to break this level. Support is expected at the 2.29 level. The expected scenario is that the stock will move sideways for the rest of the trading week until a "flag" is formed, after which it will break the 2.5 level and soar to the 2.8 level. This is expected to happen in August before the dividend distribution, which is expected to be 0.067 per share.
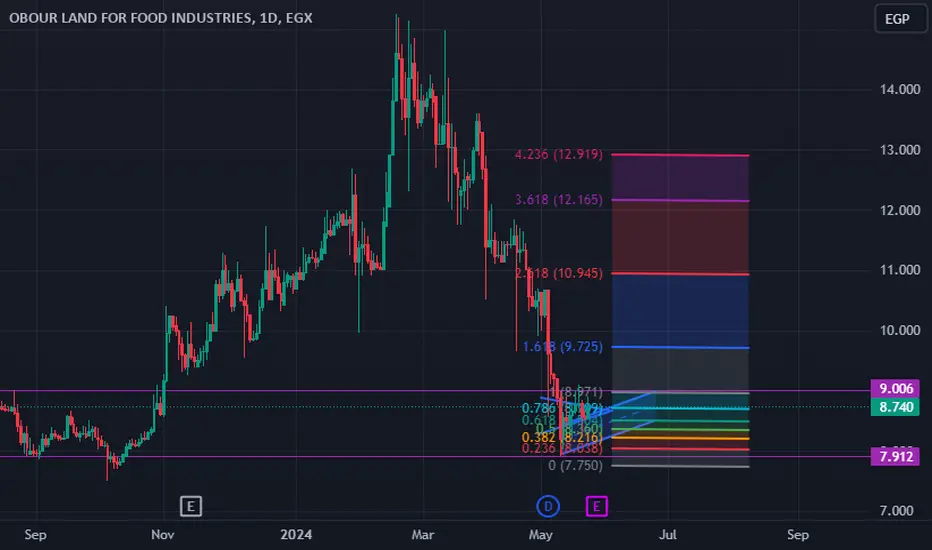
Obour Land for Food Industries (OLFI) Four next 6 MonthOver the past months, the stock has experienced a decline after it showed growth and a decline in its p/e from 9 to 7, and this should have been reflected in the price, but it was much lower.
What happened was 3 years ago
The pound's concerns faded against the US dollar
Customs release
The distribution of good profits is 0.95 piasters
During the coming period, we notice the following: First, there will be a rise in the resistance levels, which are represented by 9 pounds.
If he breaks it, we will go to 9.5, and then 10 to 12 to 14 pounds for sure.
We expect success for everyone
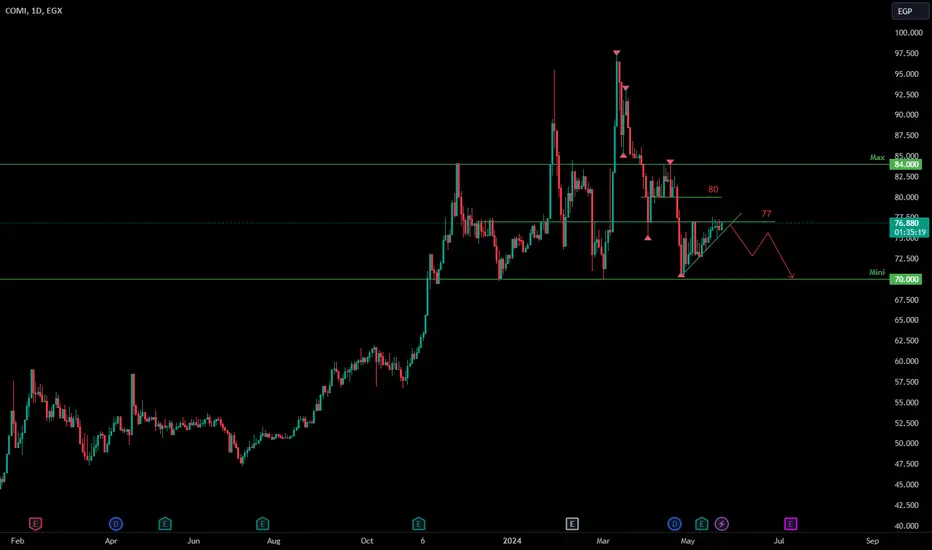
medium term CIB is down trendin daily perspective we are in counter up trend will low momentum. with to strong resistance 77 and 80
the price in range between 70 minimum and max 84 EGP
I would say buying level is 70 with target 82
if breaker 70 I will again buy at 65 level and hold
recommendation
no entry now waiting for 70 EGP
if reach will buy 5-10% of my account
if 70 level broken will buy at 65 with 5-10% of my account
and hold