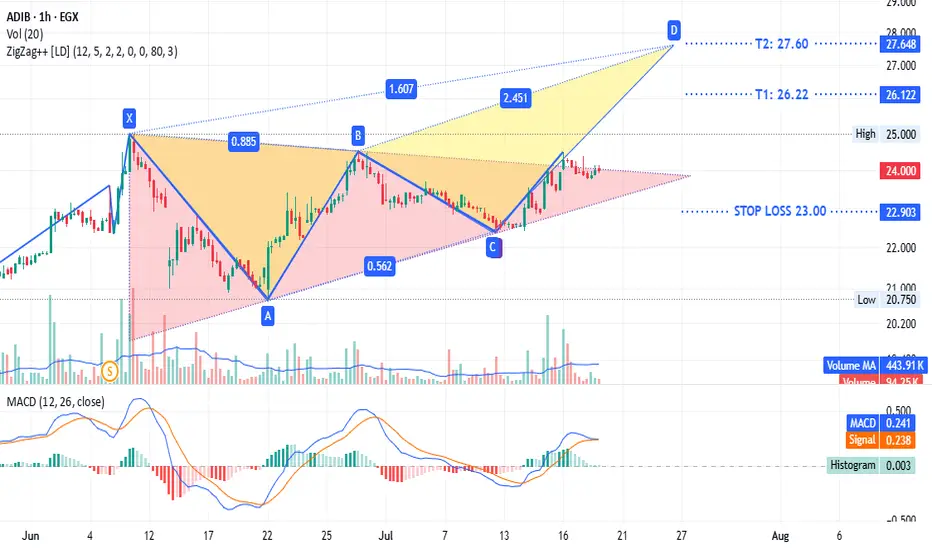
ADIB - same $comi patternADX:ADIB timeframe 1 hour
Is showing a triangle pattern with a potential bearish trend. It is currently testing the upper line of the triangle. The stop loss is at 23.00, and the target sell point ranges from 26.22 to 27.60.
This is not investment advice, only my analysis based on the chart data. Consult your account manager before making any investment decisions. Good luck.
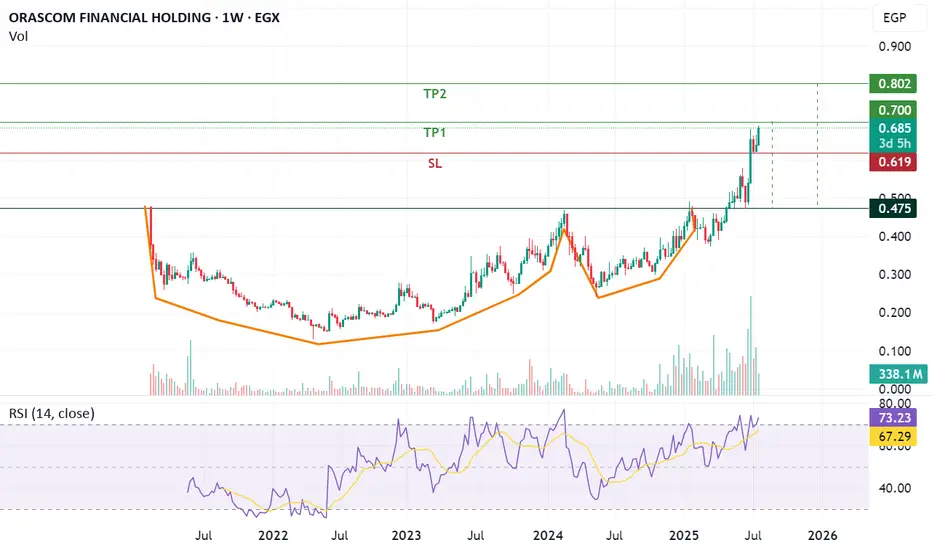
Cup and Handle pattern OFH has breakthrough a significant resistance line which represents the neck of the pattern "Cup & Handle" leading the stock to achieve the below targets on the medium to long term.
- Potential buy range: 0.64 - 0.66
- TP1: 0.7
- TP2: 0.8
- SL: below 0.62
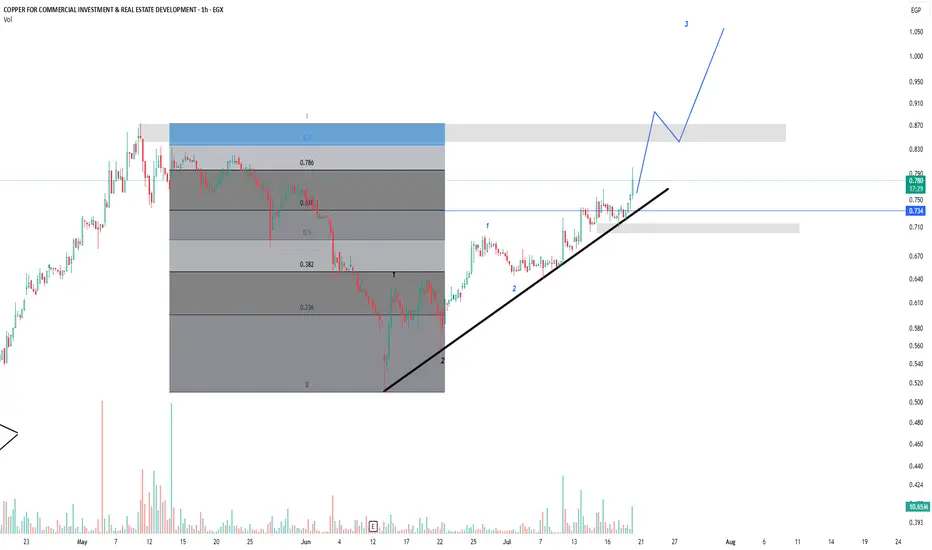
copran impulse wave is in its way to make new highs ,, i think 0.87 will be easy to be shocked very soon ,,,, 61% level is a strong support now
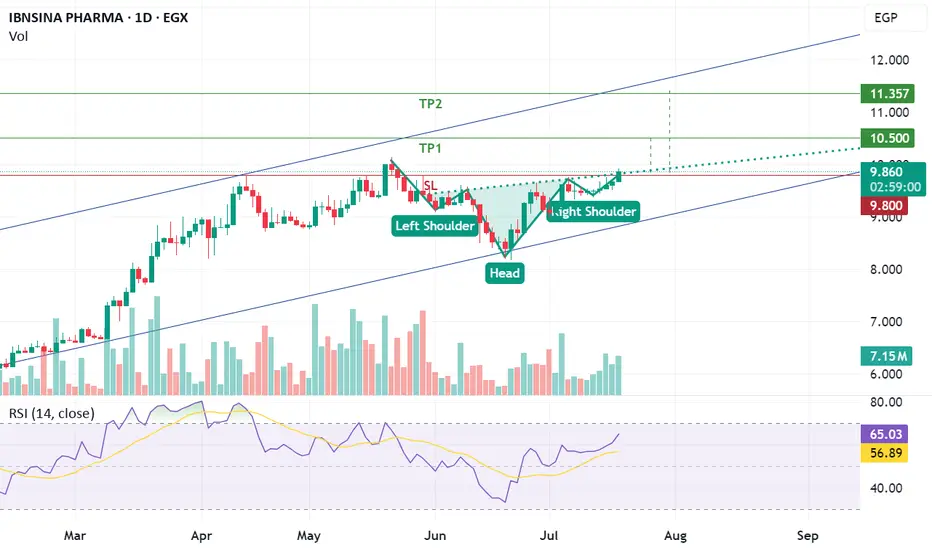
Inverted head and sholder patternISPH just breakthrough a significant resistance line which is considered inverted head and shoulders resistance line, if the price closed higher than 9.8 this will result in achieving the below targets.
- Potential buy range: 9.75 - 9.83
- TP1: 10.5
- TP2: 11.3
- SL: below 9.7 "require confirmation"
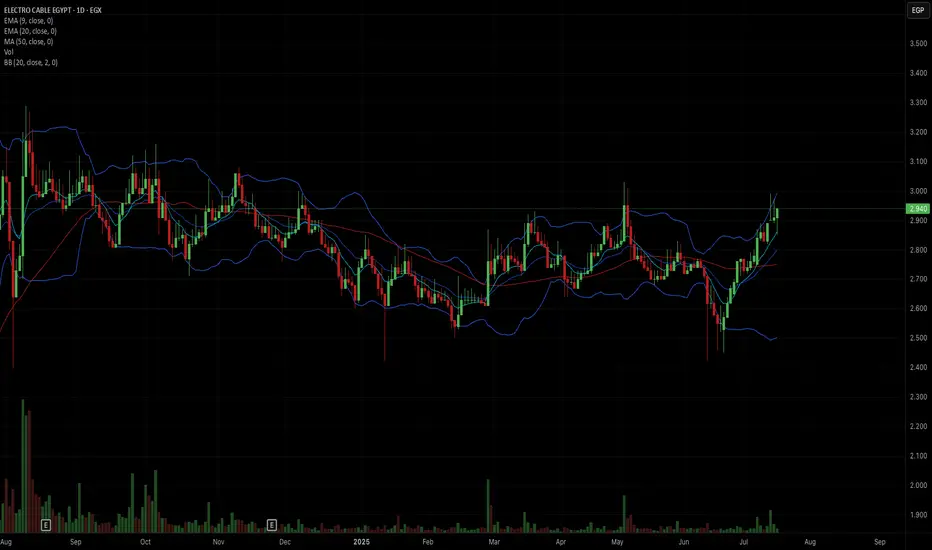
ELEC Trade Plan Entry Trigger:
✅ Break and strong close above 3.00
✅ with volume surge
⸻
Risk Management
🔸 Stop-Loss:
2.79
⸻
Profit Targets
🎯 Target 1: 3.15-3.20
🎯 Target 2: 3.40 – 3.50
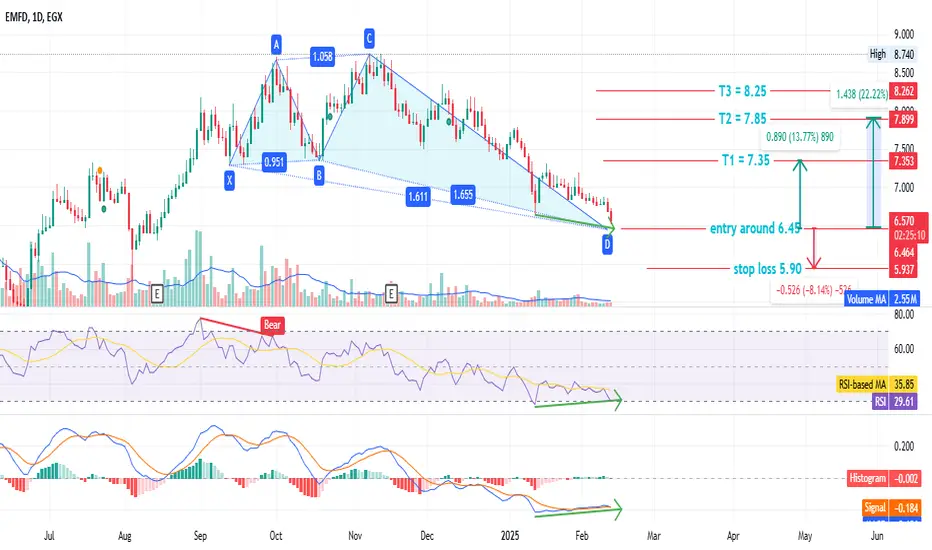
#EMFD - Egyptian stock#EMFD time frame 1 DAY
Created Gartley Bullish pattern ,
Entry level around 6.45
Stop loss 5.90 ( estimated loss - 8% )
First target at 7.35 ( estimated profit 13% )
Second target 7.85 ( estimated profit 22% )
Third target 8.25 ( with profit 27% )
MACD and RSI show positive diversion that is may support our idea
NOTE : this data according to time frame I DAY , it`s may take period up to 3 months to achieve targets , you must study well the Alternative opportunities before invest in this stock .
In addition EGX30 is negative.
Its not an advice for investing only my vision according to the data on chart
Please consult your account manager before investing
Thanks and good luck
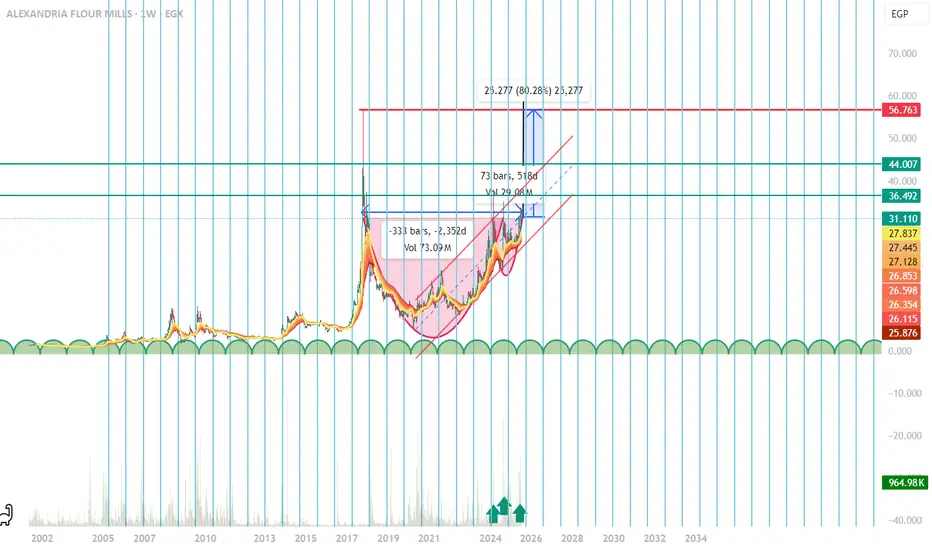
Cup And Handle with big potential Hello Traders,
i believe that is stock in the next year will make huge profits as a medium investor and long one for us as Dailly to week trade we can take advantage from this coming two month as a huge move will happen as it align with the money cycles and the pattern any down move is new opportunity to dca again targets as mentioned its just my opinion not more good luck.entry is from 28 to 33 and take profit one is 36 and the 2nd is 44 and last is 56 with stop loss 25
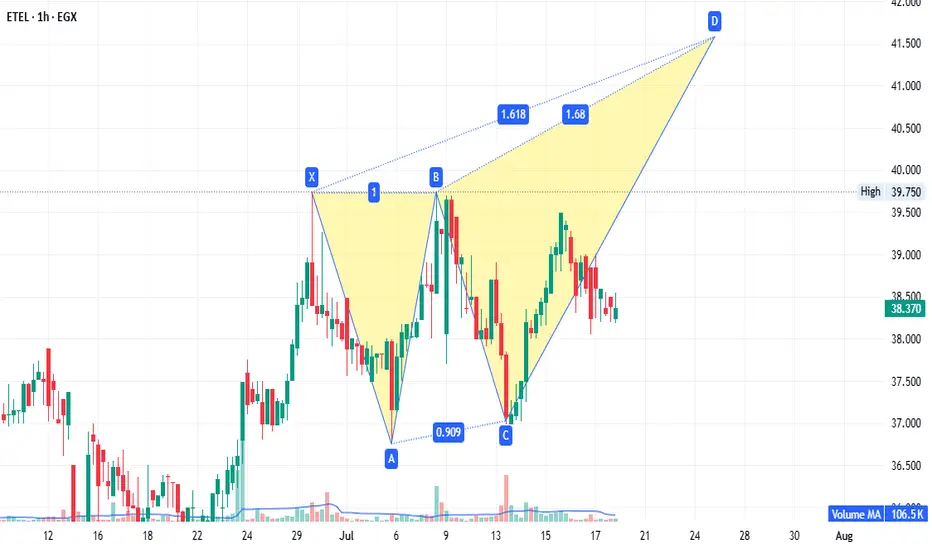
ETEL - strong fundamentals.EGX:ETEL 1-hour timeframe:
A potential bearish Gartley pattern targets 41.50. If prices reach 41.55 (without breaking 37.00), it becomes a sell point with targets at 39.73 and 38.60. Conversely, if prices continue rising and close above 42.70, rebuy what was sold at 41.50, targeting 52.00. This setup is both strategic and supported by strong fundamentals.
Disclaimer: This is not financial advice, only our analysis based on chart data. Consult your account manager before investing.
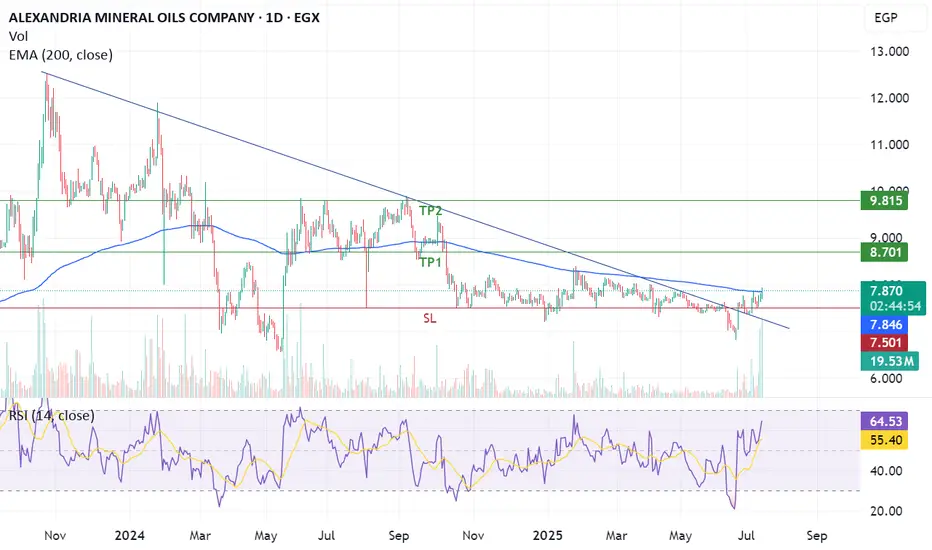
Breakthrough significant downtrend resistance line - EMA200 AMOC has successfully penetrated significant downtrend resistance line and EMA200 supported by volume exceeding average 30 days vol, targeting the bellow level:
- Potential buy range: 7.8 - 7.9
- TP1: 8.7
- TP2: 9.8
- SL: below 7.5
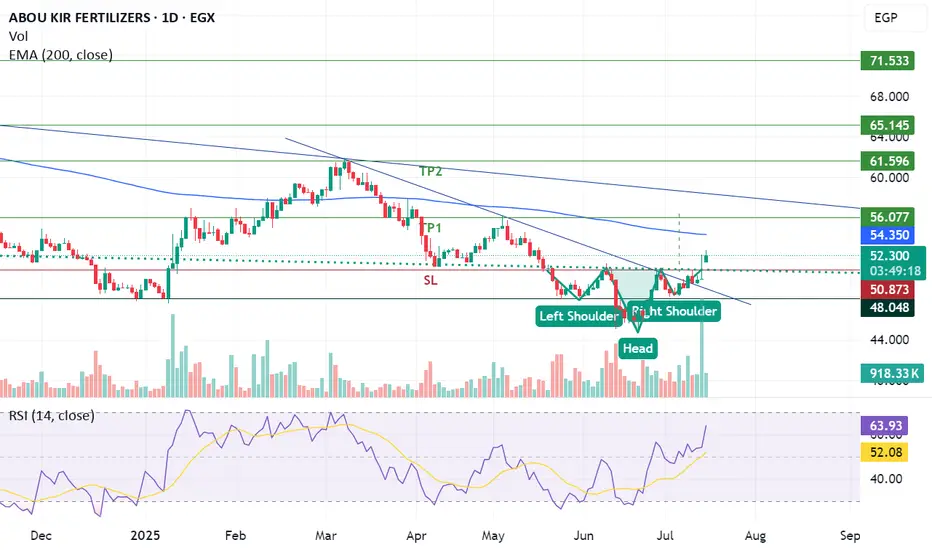
Breakthrough inverted head and shoulders and downtrend lineABUK has successfully breakthrough inverted head and shoulders pattern and downtrend resistance line supported with volume exceeding average 30 days allowing the stock to achieve the below targets:
- Potential buy range: 51 - 51.5
- TP1: 56
- TP2: 61.5
- SL: below 50.70 "Require confirmation"
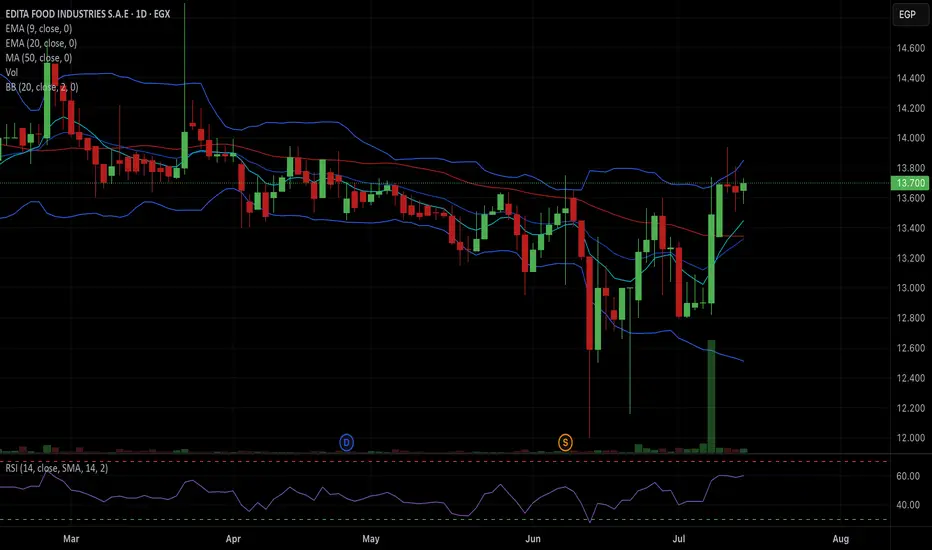
EFID Trade plan🔹 Entry: Above 13.85 (confirmed breakout of upper BB and resistance zone)
🔹 Stop-Loss: 13.33
🔹 Profit Target:
• TP1: 14.20 (next resistance zone – upper wick from mid-March)
• TP2: 14.60 (monthly resistance)
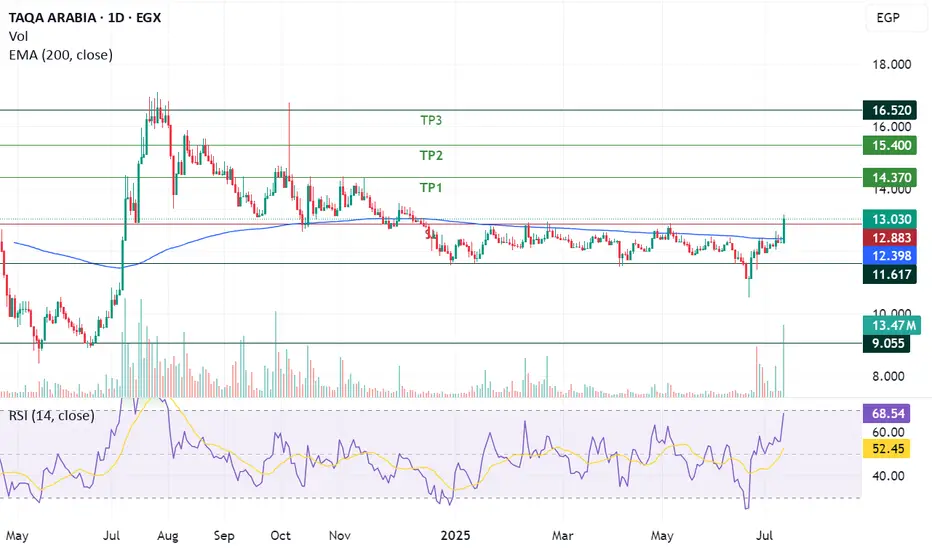
Breakthrough sideways price channelTAQA has been moving in sideways price channel ranged from 11.60 to 12.90 in the past 7 month, and successfully breakthrough the significant upper resistance line of the sideways channel supported with trading volume higher than the past 10 month potentially targeting the below:
- TP1: 14.3
- TP2: 15.4
- TP3: 16.5
- SL: Below 12.9 "Confirmation required"
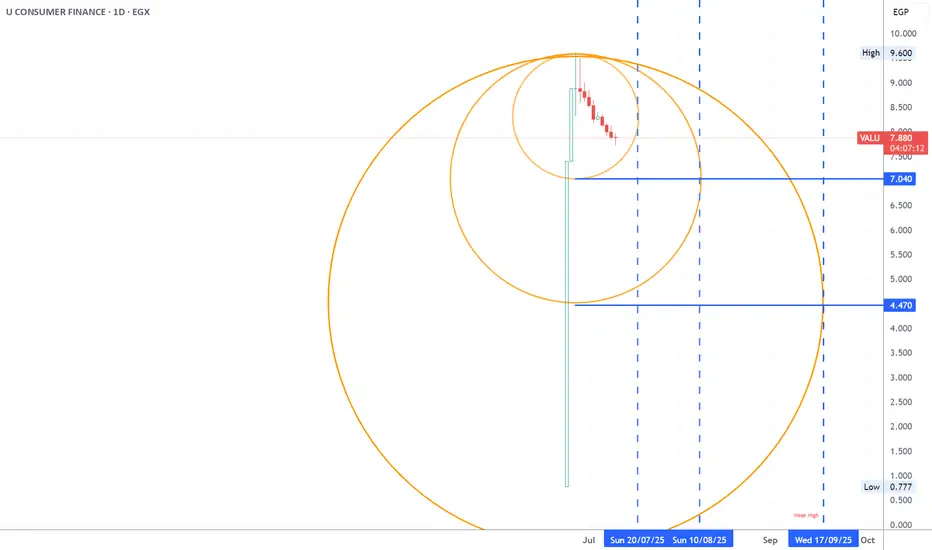
valu suport level and time lines this is a possible support level and time line of the new stock VALU using W.D Gann method
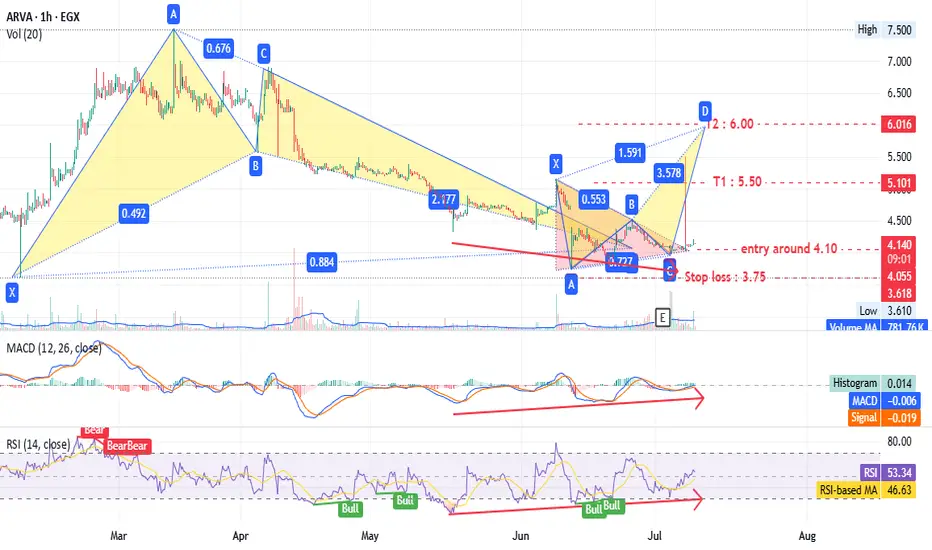
ARVA - many patterns give one target - Amazing EGX:ARVA timeframe 1 hour
Entry around 4.10
Stop loss at 3.75 (10% loss).
Targets at 5.50 and 6.00 (up to 44% profit).
Hourly chart shows a triangle pattern and bearish Gartley pattern.
Daily timeframe also indicates a bullish pattern with the same targets.
MACD and RSI support this analysis.
Note: This is not investment advice—only my analysis based on chart data. Consult your account manager before investing. Good luck!
Upside wedge + breakthrough short term downtrend resistance linCCAP has been moving in an upside wedge since May 2024 and faced a downtrend resistance line which it succeeded to breakthrough today with a volume exceeding the past 12 month.
- Potential buy range: 2.97:3.05
- TP1: 3.2
- TP2: 3.5
- SL: 2.97 "confirmation required"

Simitric triangle pattern breakthrough + vol.The stock has been moving sideways since March 2024, and today succeeded to breakthrough a simitric triangle pattern with volume exceeding the past 6 month.
- Potential buy range: 8:8.4
- TP1: 9.1
- TP2: 11
- TP3: 12.2
- SL: Below 7.9
Simitric triangle pattern breakthrough + volThe stock has been moving in sideways since March 2024, and formed a simitric triangle pattern which succeeded to breakthrough today with volume exceeding past 6 month.
- Potential buy range: 8 : 8.30
- TP1: 9.1
- TP2: 11
- TP3: 12.2
- SL: 7.9
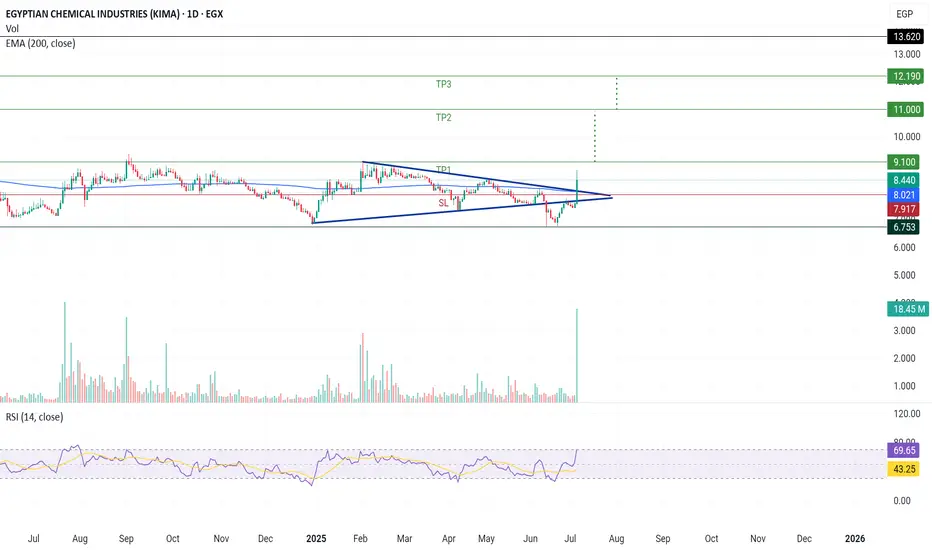
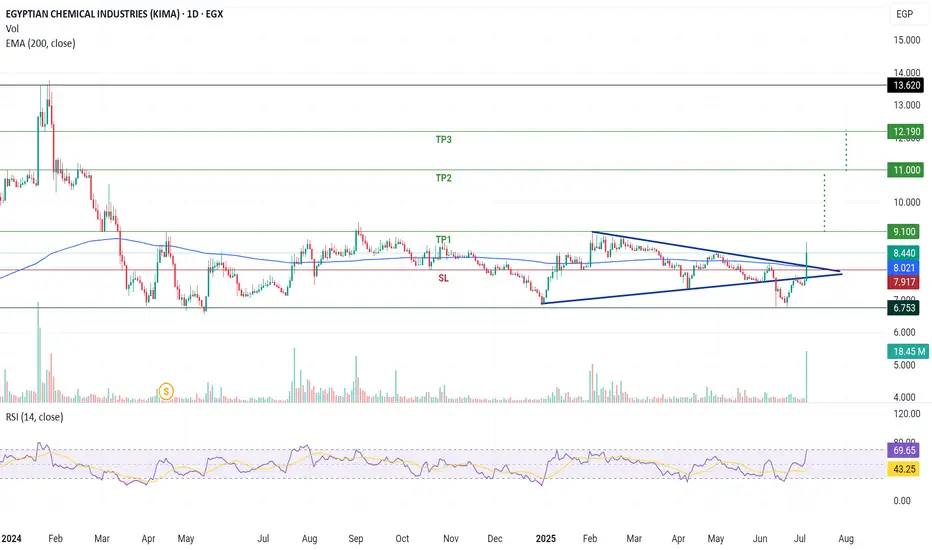
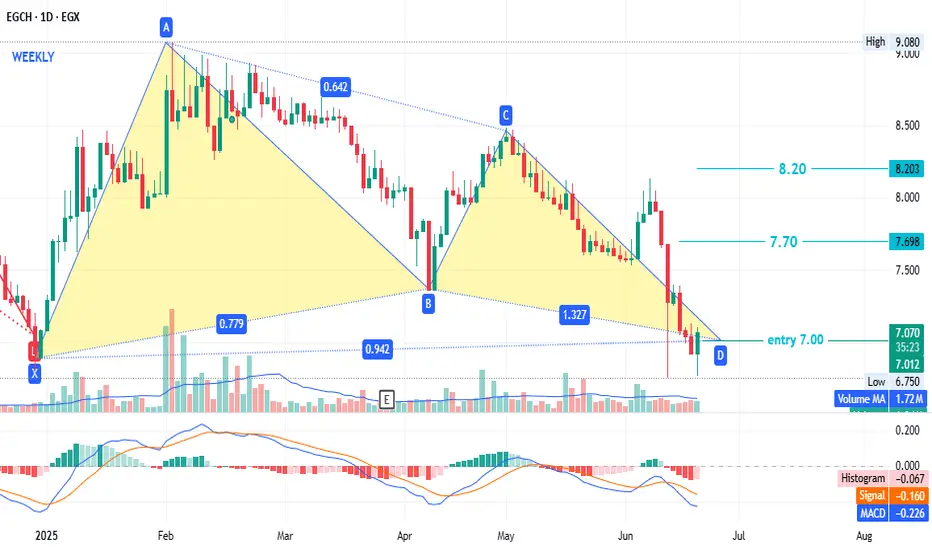
EGCH - old enemy - low riskConsider a long position with the following parameters:
Entry: 7.00
Stop loss: 6.80
Targets: 7.70 (T1), 8.20 (T2)
This is not investment advice but my analysis based on chart data. Consult your account manager before investing. Good luck.
CLHO Short (midterm)Well, This is a countertrend trade, so be cautious.
1- uptrend
2- Chart pattern (bullflag)
3- Price is within downward channel that could translates to short opportunity, but in the long term the price will hit higher.
4- Also since its an uptrend so its also possible that the price will close above the blue line and continue higher from there, but since lately the price action is bearish so i would lean bearish until 7.12 EGP, then bullish from there.
5- I hope that the price wicks in the gray area above the blue trendline and from then go to the 1h tf, check if the price action turns bearish, and we can enter from there.
Check the news, also the economical situation in Egypt has been good lately and expected to do better in the coming months, so short positions should be monitored.
DYOR

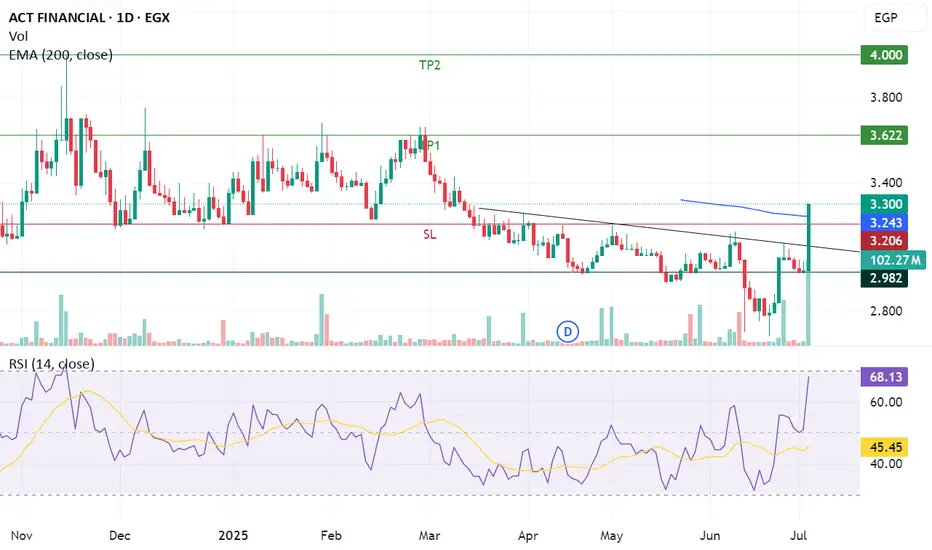
Significant resistance breakthroughACTF just breakthrough a horizontal resistance level and a declining resistance line which supports an uptrend targeting 3.6 as a 1st target and 4 as a 2nd target.
A bullish crossover would add confirmation.1. Chart Pattern Analysis:**
- The chart shows a **symmetrical triangle** formation, which is a **neutral pattern** that can break in either direction.
- The price is near the **apex of the triangle**, meaning a breakout is imminent.
- **Bullish Breakout Confirmation:** The latest candle appears to be attempting a breakout above the upper trendline.
#### **2. Support & Resistance Levels:**
- **Resistance Levels:**
- **8.41 EGP (current price level)**
- **8.51 - 8.60 EGP** (previous consolidation area)
- **9.05 EGP** (potential target after breakout)
- **Support Levels:**
- **8.22 EGP** (nearby support)
- **8.11 - 8.05 EGP** (critical support)
- If the price falls below **8.00 EGP**, the pattern may fail and lead to a downtrend.
#### **3. Volume & Momentum Indicators:**
- **Volume (2.69M)**:
- A significant increase in volume is needed to confirm a breakout.
- If volume remains low, the price might retest support.
- **RSI (Relative Strength Index):**
- RSI is trending upwards but not yet in the overbought zone.
- If it crosses above **70**, it would confirm strong bullish momentum.
- **MACD (Moving Average Convergence Divergence):**
- The MACD is **slightly positive**, signalling potential bullish momentum.
- A bullish crossover would add confirmation.
#### **4. Potential Future Scenarios:**
- **Bullish Case (Breakout Above 8.51 EGP)**
- If the price breaks and sustains above **8.51 EGP**, it may target **9.05 EGP** and beyond.
- Increased volume would strengthen the breakout signal.
- **Bearish Case (Failure at Resistance)**
- If the price fails to break and closes below **8.00 EGP**, it could drop towards **7.80-7.50 EGP**.
- A breakdown below **8.00 EGP** invalidates the bullish case.
### **Conclusion & Trading Plan:**
- **Watch for a breakout confirmation above 8.51 EGP** with high volume.
- **Stop-loss below 8.00 EGP** to protect against a false breakout.
- **Upside Target:** 9.05 EGP and higher if momentum continues.
🚀


MISR FERTILIZERS The stock of Mobco is in a downward trend, forming a large double top pattern with a peak at 79.26EGP and another at 78.98 EGP. The neckline has been broken, and now we have a flag pattern that has been broken downwards. The targets are as indicated. We expect the formation of a corrective wave, as shown, or a rapid decline. We will monitor the downward movement. The stop-loss will be a break of the strong supply zone and a breakout above 57 EGP, closing above this level after compelet correction target new peak above 80EGP.
