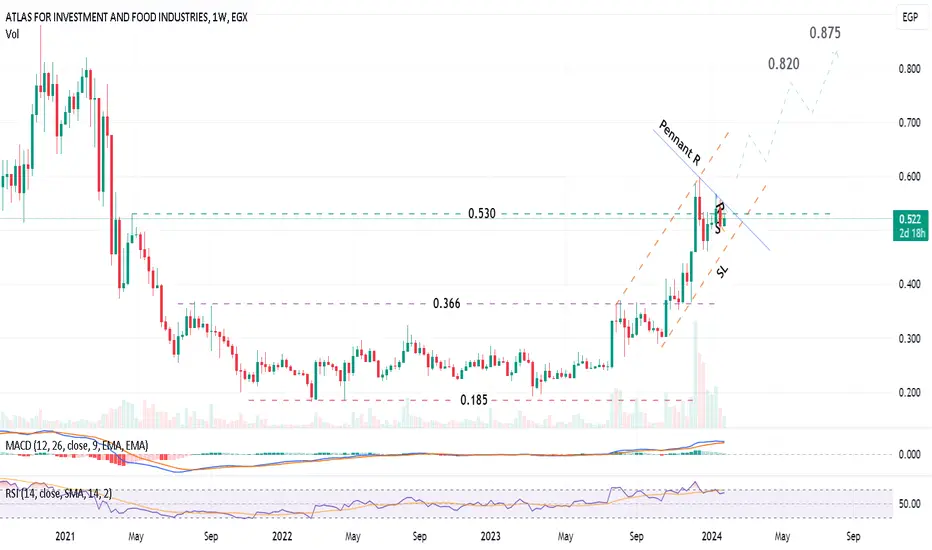
ATLAS (AIFI) should target 0.875 after stabilizing above 0.545Weekly chart, the stock is trading in the rising channel, and should cross the Pennant pattern Resistance at around 0.543
Stabilizing above 0.545 for one week with high volume, will push the price to target 0.875
Stop loss (SL) line should be considered for the rising stop loss level.
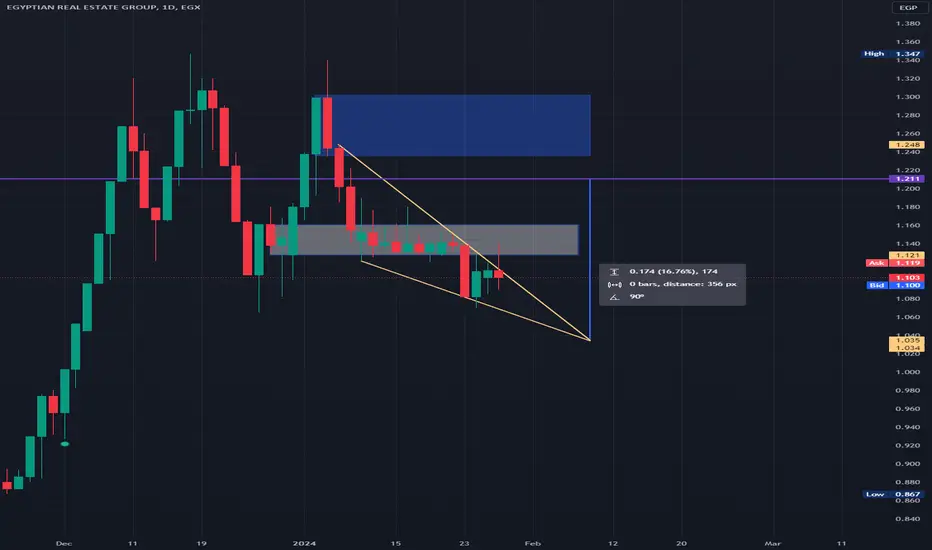
AREH is not showing promising signals yet for a breakout but if For good signals consider the following:
RSI should pass 50
Cross up the sideways pattern since the 10th of January.
When cross 1.2 it will have strong resistance from the (1.24 : 1.3) range
ABUK is bull flaggingHigh probability trade on ABUK with potential target at 107 and 118.
Probability 70%

Good setup on RMDA It has a probability of a good uptrend imo.
the trade requires good risk management and patience.
there is an opportunity for trading next week, let's pass ....The demonstrated concept is based on FVG, Order Block, and Ichimoku Kinko Hyo. The narrative is in Arabic, and channeled toward Arabic speaking trader in CASE.
Disclaimer: this is not an investment proposal; if you want to invest consult your investment/wealth manager.

Great Opportunity ---- Sunday 28th Jan 24The demonstrated concept is based on FVG, Order Block, and Ichimoku Kinko Hyo. The narrative is in Arabic, and channeled toward Arabic speaking trader in CASE.
Disclaimer: this is not an investment proposal; if you want to invest consult your investment/wealth manager.

Let's wait & confirm our decision on Sunday 1-28-24 he demonstrated concept is based on FVG, Order Block, and Ichimoku Kinko Hyo. The narrative is in Arabic, and channeled toward Arabic speaking trader in CASE.
Disclaimer: this is not an investment proposal; if you want to invest consult your investment/wealth manager.

High Roller ---- DICE 1-28-24he demonstrated concept is based on FVG, Order Block, and Ichimoku Kinko Hyo. The narrative is in Arabic, and channeled toward Arabic speaking trader in CASE.
Disclaimer: this is not an investment proposal; if you want to invest consult your investment/wealth manager.

outlookSunday 28th jan 2024The demonstrated concept is based on FVG, Order Block, and Ichimoku Kinko Hyo. The narrative is in Arabic, and channeled toward Arabic speaking trader in CASE.
Disclaimer: this is not an investment proposal; if you want to invest consult your investment/wealth manager.

outlookThe demonstrated concept is based on FVG, Order Block, and Ichimoku Kinko Hyo. The narrative is in Arabic, and channeled toward Arabic speaking trader in CASE.
Disclaimer: this is not an investment proposal; if you want to invest consult your investment/wealth manager.

Outlook Sunday Jan 28th, 2024The demonstrated concept is based on FVG, Order Block, and Ichimoku Kinko Hyo. The narrative is in Arabic, and channeled toward Arabic speaking trader in CASE.
Disclaimer: this is not an investment proposal; if you want to invest consult your investment/wealth manager.

outlook for Jan 28th, 2024The demonstrated concept is based on FVG, Order Block, and Ichimoku Kinko Hyo. The narrative is in Arabic, and channeled toward Arabic speaking trader in CASE.
Disclaimer: this is not an investment proposal; if you want to invest consult your investment/wealth manager.

Weekly outlookThe demonstrated concept is based on FVG, Order Block, and Ichimoku Kinko Hyo. The narrative is in Arabic, and channeled toward Arabic speaking trader in CASE.
Disclaimer: this is not an investment proposal; if you want to invest consult your investment/wealth manager.

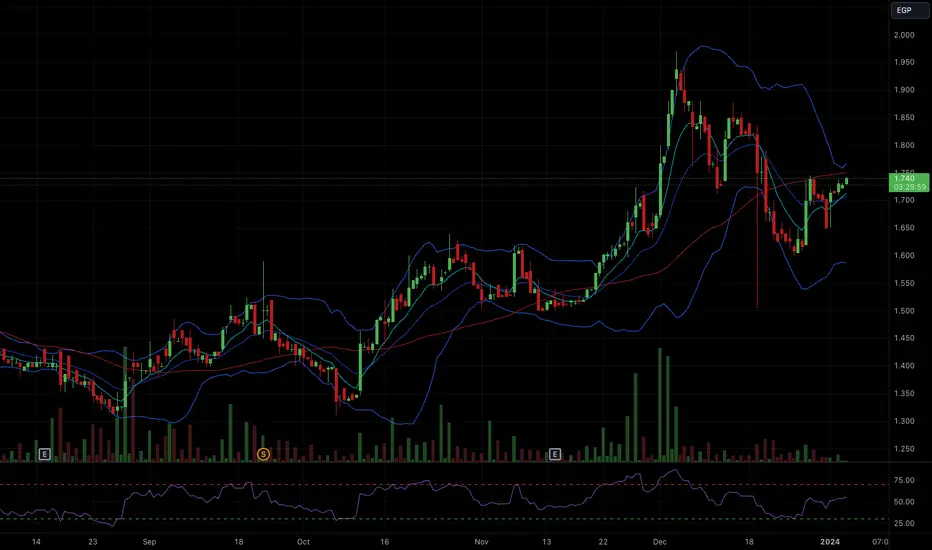
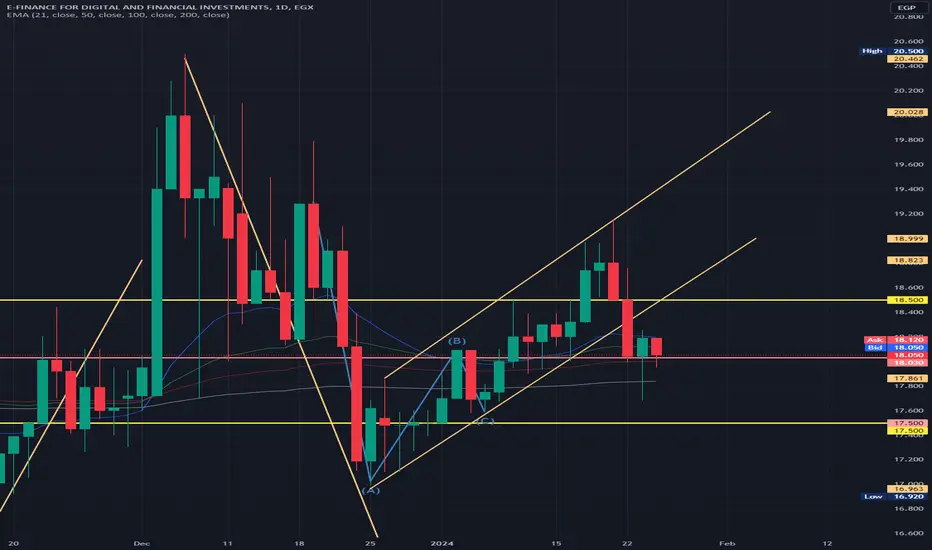
EFIH drops from the uptrend channel and goes sidewaysMomentum is lost and now in the sideway channel.
Wait till it returns to the uptrend channel and check the price action afterwards.
Sunday 28th of January - Smart Money outlookThe demonstrated concept is based on FVG, Order Block, and Ichimoku Kinko Hyo. The narrative is in Arabic, and channeled toward Arabic speaking trader in CASE.
Disclaimer: this is not an investment proposal; if you want to invest consult your investment/wealth manager.

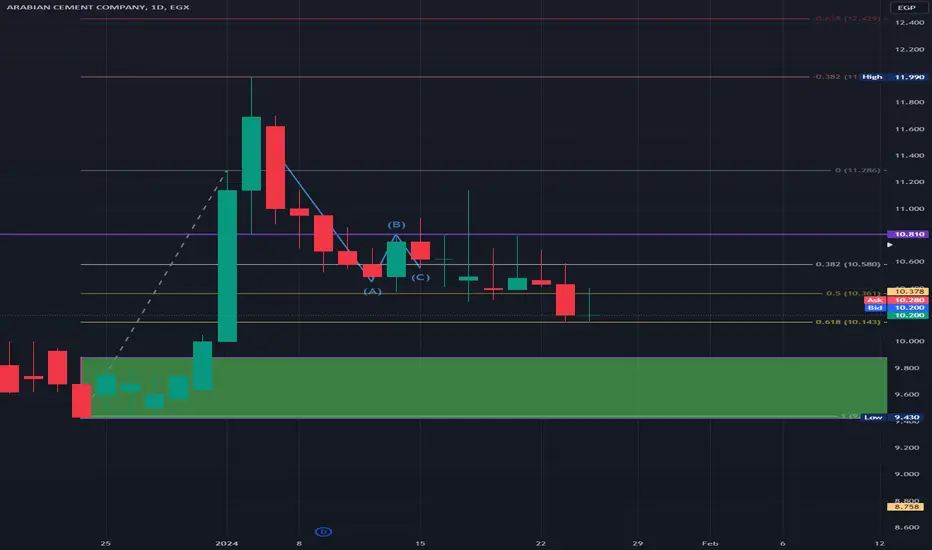
Domit to test the trend lineIf it passes the trendline it will test the liquidity line@10.8,
If it rebounds, it will face a high resistance range of 12.1:12.7

ARCC testing Fibonacci golden level projection to go long once pIf it is corrected 10.1 will test the demand area in the range 9.4:9.9
Should buy it once it crosses 10.8.
Intraday trading opportunity ALCN is listed on CASE. ALCN is currently consolidating even though it is forward trending. Combining SMART MONEY CONCEPT, FVG, and Ichimoku Kinko Hyo outlined a potential intraday trading opportunity as well as medium term.
The video narrative is in Arabic language channeled toward Arabic speakers CASE traders.
Disclaimer: this is not an investing proposal but a forward thinking analysis that might be right based on the market dynamics.

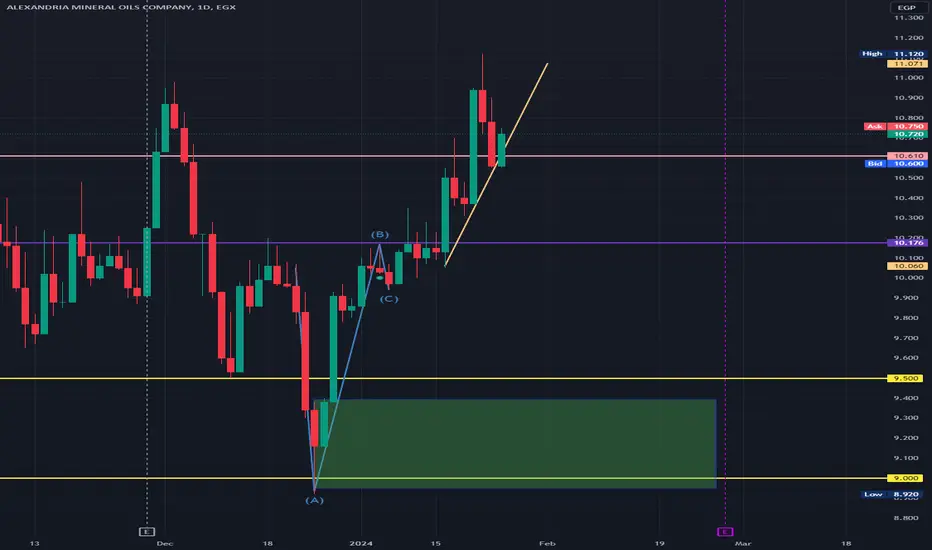
AMOC wait till it tests the main resistance at 10.17I don't recommend buying until it gives a better sign, or testing 10.17 if it crosses down, will test the demand zone with a range of 9-9.4
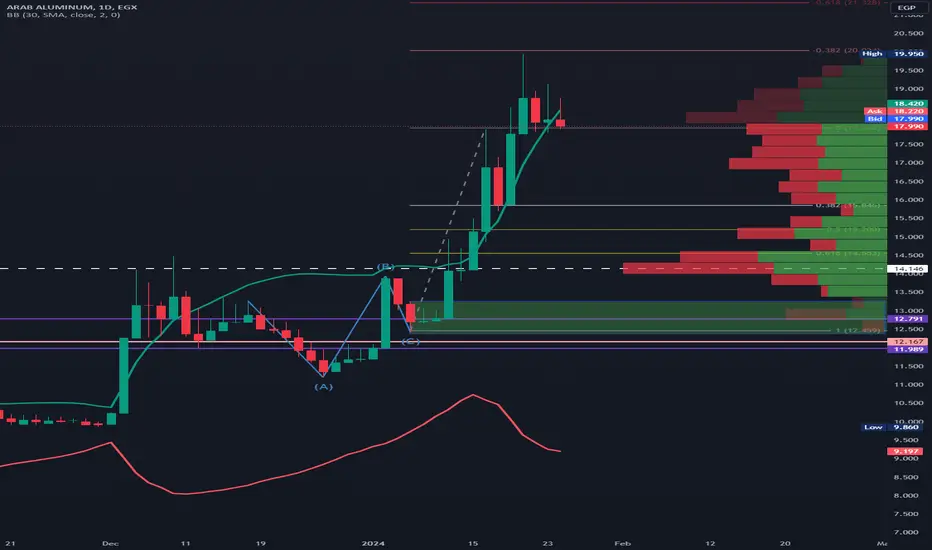
AlUM to test an important resistance of 17.9If crossed down, will test the demand zone after testing the important volume profile 14.16
Elshams to test the demand zone and bounce back the stock broke the trend line and will test the demand zone.

Commercial International Bank (COMI) opportunity Seizing intraday opportunity based on Smart Money Integrated with Ichimoku Kinko Hyo + FVG.
The narrative is channeled toward Arabic speakers trading in CASE.
Disclaimer: My analysis is not an investment proposal; Please consult your Investment Advisor and/or your Wealth Manager for your investment decisions.

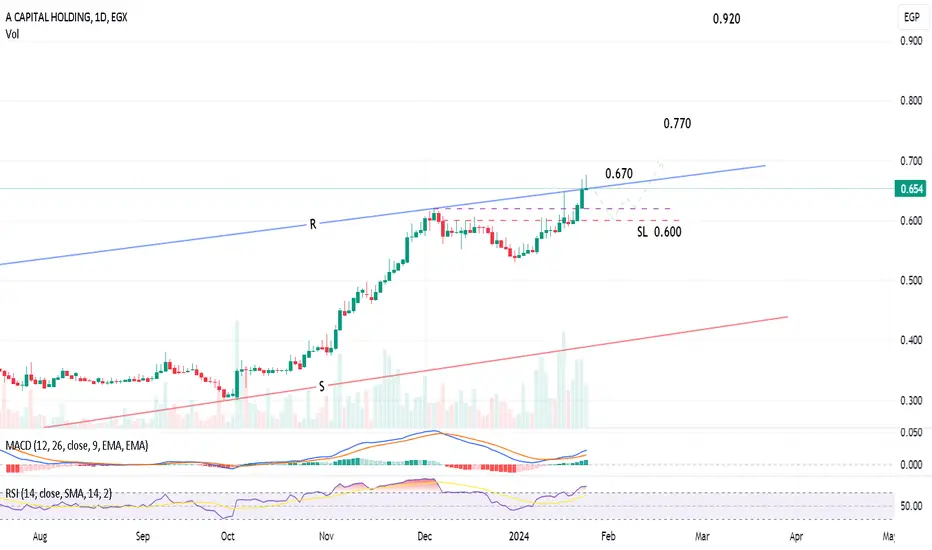
ACAP is preparing to cross the Resistance line RDaily chart, the stock is trying to beat the Resistance line R.
Some correction may happen between 0.618 - 0.600 and rebound afterwards to test the Resistance line R.
Above Resistance line R (crossing at around 0.670), the target will be 0.770 then 0.920
Stop loss below 0.600 should be considered.